LAKE G. DIMITROV
Eastern end of the lake
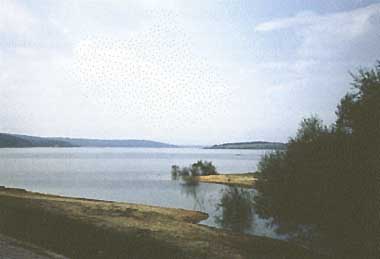
Photo: A.Kurata
A. LOCATION
- Kazanlak, Bulgaria.
- 42:36N, 25:19E; ca. 800 m above sea level.
B. DESCRIPTION
The man-made lake "G. Dimitrov" has been built 7 km upstream from the town of Kazanlak on the Tundja River in the Rosa Valley, which separates the Balkan mountain chain from the Sredna Gora mountains. The rock-filled dam is provided with thick concrete cover on the lake side and a road on its crest. The construction was completed in 1954 and the lake is managed by the office of "Lake and Cascades" Kazanlak Branch.
The watershed covers an area of 861 km2, and has an average altitude of ca. 800 m and a mean river gradient of 31.4%. The area is built of granite and granite-gneiss, old Tertiary sediments, diluvial and alluvial deposits. One may find traces of tectonic activities - fissured rocks, dislocation zones with sources of hot spring, etc. Its northern part includes the highest peak of Balkan Mountains, where thick and prolonged snow cover is characteristic. Steep slopes favor surface erosion development.
The lake is about 11 km2 in its surface area and the maximum depth reaches 40 m. It is located in a rich rural region that needs much clean water, and serves to regulate the seasonal turnoff of water supply according to the requirements of consumers - irrigation for fertile fields of both Kazanlak and Stara Zagora, chemical industry in the town of St. Zagora, and hydroelectric power plant.
Lake Dimitrov is also a great local centre for recreation and hot-spring cure because it is surrounded by a number of settlements and dense network of roads. There are good water-sport facilities including a paddle sport base on its northern bank (Q).
C. PHYSICAL DIMENSIONS (Q)
| Surface area [km2] | 11 |
| Volume [km3] | 0.14* |
| Maximum depth [m] | 40 |
| Mean depth [m] | 12.7 |
| Water level | Regulated |
| Normal range of annual water level fluctuation [m] | 24 |
| Length of shoreline [km] | 26.3 |
| Residence time [yr] | 0.6 |
| Catchment area [km2] | 861 |
* Maximum.
D. PHYSIOGRAPHIC FEATURES
D1 GEOGRAPHICAL
- Sketch map: Fig. EUR-44-01.
- Names of main islands: None.
- Number of outflowing rivers and channels (name)
3 (Tundja R. and 2 irrigation channels).
D2 CLIMATIC
- Climatic data at Kazanlak, 1931-1985
| Jan | Feb | Mar | Apr | May | Jun | Jul | Aug | Sep | Oct | Nov | Dec | Ann. |
| Mean temp. [deg C] | -0.7 | 1.3 | 4.8 | 10.6 | 15.3 | 18.9 | 31.4 | 21.0 | 16.8 | 11.2 | 6.4 | 1.6 | 11.6 |
| Precipitation [mm] | 41 | 33 | 31 | 46 | 75 | 76 | 65 | 48 | 34 | 45 | 49 | 45 | 588 |
- Number of hours of bright sunshine: 2,168 hr yr-1.
- Solar radiation: 13 MJ m-2 day-1.
Fig-EUR-44-01
Sketch map of the lake and its river network (Q).
- Water temperature [deg C]
| Floating plot, 1954-1964 |
| Depth [m] | Jan | Feb | Mar | Apr | May | Jun | Jul | Aug | Sep | Oct | Nov | Dec |
| 0.5 | 3.2 | 2.8 | 6.0 | 11.3 | 18.2 | 22.5 | 24.8 | 25.0 | 21.2 | 16.8 | 10.6 | 5.6 |
| 5 | 3.4 | 2.8 | 5.3 | 9.8 | 15.1 | 18.8 | 21.5 | 22.8 | 19.7 | 14.8 | 10.3 | 6.0 |
| 10 | 3.7 | 2.7 | 5.1 | 8.6 | 13.0 | 16.2 | 18.9 | 21.4 | 19.1 | 14.8 | 10.2 | 5.9 |
| 20 | 3.7 | 3.0 | 4.9 | 7.8 | 11.4 | 14.2 | 16.9 | 19.5 | 18.5 | 14.9 | 10.7 | 6.2 |
| B* | 3.8 | 3.0 | 5.0 | 7.9 | 10.4 | 13.2 | 15.6 | 18.4 | 18.0 | 14.3 | 10.0 | 6.0 |
* Bottom.
- Mixing type: Monomictic.
- Notes on water mixing and thermocline formation
After its formation the thermocline sinks downward due to both the heating of surface water layer and the intensive outflow.
Fig. EUR-44-02
The vertical water temperature distribution at the floating plot on 11 August 1987.
E. LAKE WATER QUALITY (Q)
E1 TRANSPARENCY [m]
| Floating plot, 1986-1988 |
| Jan | Feb | Mar | Apr | May | Jun | Jul | Aug | Sep | Oct | Nov | Dec |
| - | - | - | 2.4 | 2.1 | 1.6 | 1.2 | - | 1.2 | 1.2 | - | - |
E2 pH
| Floating plot, 1971-1988 |
| Depth [m] | Jan | Feb | Mar | Apr | May | Jun | Jul | Aug | Sep | Oct | Nov | Dec |
| S*1 | - | 7.1 | 6.6 | 6.8 | 6.5 | 6.7 | 6.6 | 6.9 | 6.9 | 7.6 | 6.8 | 6.4 |
| 20 | - | - | - | - | - | - | - | 6.5 | - | - | 6.5 | - |
| 30 | - | - | - | 6.0 | 6.0 | - | - | - | - | - | - | - |
| B*2 | - | 6.5 | 6.5 | 7.0 | 6.5 | 6.5 | 7.0 | 6.7 | 7.0 | 7.5 | 6.8 | 6.8 |
*1 Surface. *2 Bottom.
E3 SS [mg l-1]
| Floating plot, 1986-1988 |
| Depth [m] | Jan | Feb | Mar | Apr | May | Jun | Jul | Aug | Sep | Oct | Nov | Dec |
| 0 | - | - | - | - | 10 | - | - | - | 46 | - | - | - |
| 1 | - | - | - | - | - | - | - | - | 53 | - | - | - |
| 3 | - | - | - | - | 45 | - | - | - | 54 | - | - | - |
| 5 | - | - | - | - | 3 | - | - | - | 58 | - | - | - |
| 8 | - | - | - | - | - | - | - | - | 71 | - | - | - |
| 10 | - | - | - | - | 6 | - | - | - | - | - | - | - |
| 15 | - | - | - | - | 5 | - | - | - | - | - | - | - |
| 20 | - | - | - | - | 11 | - | - | - | - | - | - | - |
| 25 | - | - | - | - | 11 | - | - | - | - | - | - | - |
| 27* | - | - | - | - | 115 | - | - | - | - | - | - | - |
* Bottom.
Fig. EUR-44-03
Vertical distribution of water temperature [deg C], suspended solid concentration (SSC) and suspended organic matter concentration (SOC) at the floating plot on June 30, 1987 (Q).
E4 DO [mg l-1]
| Floating plot, 1986-1988 |
| Depth [m] | Jan | Feb | Mar | Apr | May | Jun | Jul | Aug | Sep | Oct | Nov | Dec |
| 0 | - | - | - | - | 10.5 | - | - | - | - | - | - | - |
| 3 | - | - | - | - | 10.2 | - | - | - | - | - | - | - |
| 5 | - | - | - | - | 10.8 | - | - | - | - | - | - | - |
| 10 | - | - | - | - | 10.0 | - | - | - | - | - | - | - |
| 15 | - | - | - | - | 10.5 | - | - | - | - | - | - | - |
| 20 | - | - | - | - | 9.3 | - | - | - | - | - | - | - |
| 23 | - | - | - | - | 10.3 | - | - | - | - | - | - | - |
E6 CHLOROPHYLL CONCENTRATION [micro l-1]
| Floating plot, 1988 |
| Depth [m] | Jan | Feb | Mar | Apr | May | Jun | Jul | Aug | Sep | Oct | Nov | Dec |
| 0.25 | - | - | - | - | 4.26 | - | - | - | - | - | - | - |
| 1 | - | - | - | - | 4.49 | - | - | - | - | - | - | - |
| 3 | - | - | - | - | 4.86 | - | - | - | - | - | - | - |
| 5 | - | - | - | - | 3.24 | - | - | - | - | - | - | - |
| 7 | - | - | - | - | 2.22 | - | - | - | - | - | - | - |
E7 NITROGEN CONCENTRATION
| Floating plot, 1986-1988 |
| Depth [m] | Jan | Feb | Mar | Apr | May | Jun | Jul | Aug | Sep | Oct | Nov | Dec |
| 0 | - | - | - | - | 3.4 | - | - | - | 0.8 | - | - | - |
| 1 | - | - | - | - | - | - | - | - | 1.4 | - | - | - |
| 3 | - | - | - | - | - | - | - | - | 1.6 | - | - | - |
| 5 | - | - | - | - | - | - | - | - | 3.8 | - | - | - |
| 10 | - | - | - | - | 4.65 | - | - | - | - | - | - | - |
| 20 | - | - | - | - | 3.00 | - | - | - | - | - | - | - |
| 30 | - | - | - | - | 0.90 | - | - | - | - | - | - | - |
| Floating plot, 1986-1988 |
| Depth [m] | Jan | Feb | Mar | Apr | May | Jun | Jul | Aug | Sep | Oct | Nov | Dec |
| 0 | - | - | - | - | 0.24 | - | - | - | 0.08 | - | - | - |
| 1 | - | - | - | - | - | - | - | - | 0.10 | - | - | - |
| 3 | - | - | - | - | - | - | - | - | 0.10 | - | - | - |
| 5 | - | - | - | - | - | - | - | - | 0.12 | - | - | - |
| 10 | - | - | - | - | 0.80 | - | - | - | - | - | - | - |
| 20 | - | - | - | - | 1.00 | - | - | - | - | - | - | - |
| 30 | - | - | - | - | 1.98 | - | - | - | - | - | - | - |
E8 PHOSPHORUS CONCENTRATION
| Floating plot, 1988 |
| Depth [m] | Jan | Feb | Mar | Apr | May | Jun | Jul | Aug | Sep | Oct | Nov | Dec |
| 0 | - | - | - | - | 0.03 | - | - | - | - | - | - | - |
| 10 | - | - | - | - | 0.04 | - | - | - | - | - | - | - |
| 20 | - | - | - | - | 0.04 | - | - | - | - | - | - | - |
| 30 | - | - | - | - | 0.03 | - | - | - | - | - | - | - |
E9 CHLORIDE CONCENTRATION [mg l-1]
| Floating plot, 1986-1988 |
| Depth [m] | Jan | Feb | Mar | Apr | May | Jun | Jul | Aug | Sep | Oct | Nov | Dec |
| 0 | - | - | - | - | 14.2 | - | - | - | 22.2 | - | - | - |
| 1 | - | - | - | - | - | - | - | - | 26.9 | - | - | - |
| 3 | - | - | - | - | - | - | - | - | 22.8 | - | - | - |
| 5 | - | - | - | - | - | - | - | - | 25.1 | - | - | - |
| 10 | - | - | - | - | 14.2 | - | - | - | - | - | - | - |
| 20 | - | - | - | - | 12.8 | - | - | - | - | - | - | - |
| 30 | - | - | - | - | 14.8 | - | - | - | - | - | - | - |
F. BIOLOGICAL FEATURES (Q)
F1 FLORA
Floating plot, May 1988
- Phytoplankton
Pyrrophyta (Cryptomonas sp.), Bacillariophyta (Cyclotella sp.), Cyanophyta, Chlorophyta.
F2 FAUNA
- Zooplankton
Cyclops strenuus, Daphnia pulex, D. longispina, Monia recrostris, Bosmina longirostris, Ceriodaphia setosa, Chydorus sp., Leydigia sp., Brachionus pala, B. angularis.
- Benthos
Chironomus plumosus, C. semireductus, Cryptochironomus ex. gr. conjugens, C. gr. camptolabis, Polypedilum ex. gr. nebuculosum, Polypedilum sp., Paratendipes gr. albimanus.
- Supplementary notes on the biota
An 1988 search showed a fair uniformity in the biological parameters throughout the lake due to the continuous water outflow that produces a permanent water current going downstream and temporary upstream currents. They both mix up the water.
F3 PRIMARY PRODUCTION RATE
| Floating plot, May 1988 |
| [m] | [g 02 m-2] |
| 0.0 | 0.69 |
| 0.5 | 0.80 |
| 1.0 | 0.43 |
| 3.0 | 0.28 |
| 5.0 | 0.14 |
| 7.0 | 1.00 |
F5 FISHERY PRODUCTS
- Annual fish catch [metric tons]
1954-1964: 30.
- Fishery products other than fish: None.
G. SOCIO-ECONOMIC CONDITIONS (Q)
G1 LAND USE IN THE CATCHMENT AREA (1985)
| Area [km2] | [%] |
| Natural landscape |
| - Woody vegetation | 448 | 52 |
| - Herbaceous vegetation | 103 | 12 |
| Agricultural land |
| - Crop field | 241 | 28 |
| - Pasture land | 34 | 4 |
| Residential area | 34 | 4 |
| Total | 861 | 100 |
- Types of important woody vegetation
Low-stemmed forest (beech, oak), pine forest.
- Main kinds of crops and/or cropping systems
Rose and lavender (for perfume oil), wheat and maize.
- Levels of fertilizer application on crop fields: Moderate.
- Trends of changes in land use in recent years: None.
G2 INDUSTRIES IN THE CATCHMENT AREA AND THE LAKE
| No. of persons engaged [%] | Main products or major industries |
| Primary industry | 40 | Mash & tool production, timber industry |
| - Crop production | 24 |
| - Others | 9 |
| Secondary industry | 12 | Energy production, textile, food industry |
| Tertiary industry | 15 |
G3 POPULATION IN THE CATCHMENT AREA (1986)
| Population | Population density [km-2] | Major cities (population) |
| Urban | 35,000 |
| Rural | 60,000 | | None |
| Total | 95,000 | 110 |
H. LAKE UTILIZATION (Q)
H1 LAKE UTILIZATION
Source of water, sightseeing and tourism, recreation (swimming, sport-fishing, yachting) and fisheries.
H2 THE LAKE AS WATER RESOURCE (1985)
| Use rate [m3 yr-1] |
| Domestic | None |
| Irrigation | 118,000,000 |
| Industrial | 44,000,000 |
| Power plant | 100 MWh |
I. DETERIORATION OF LAKE ENVIRONMENTS AND HAZARDS (Q)
I1 ENHANCED SILTATION
- Extent of damage: Not serious.
- Supplementary notes
The sedimentation rate is still larger than the target rate decreasing rather slowly.
I2 TOXIC CONTAMINATION
- Main contaminants and their concentrations
| Floating plot, May, 1988 |
| Names of contaminants | Concentration [ppm] |
| Water | Sediments |
| Mn | 0.021 | 0.088 |
| Cu | 0.008 | 0.0044 |
| Pb | 0.001 | 0.0067 |
| Zn | 0.0285 | 0.0161 |
| Fe | 0.132 | 3.30 |
| Cd | 0.0 | 0.0004 |
- Environmental quality standards for contaminants in the lake: Present.
- Food safety standards or tolerance limits for toxic contaminants in the
lake: Present.
I3 EUTROPHICATION
- Nuisance caused by eutrophication
Unusual algal bloom (Cyanophyta, Chlorophyta, Chlamydomonas, Bacillariophyta).
- Nitrogen and phosphorus loadings to the lake [g l-1] (1988)
| Sources | Industrial | Agricultural | Natural |
| T-P | 10.64 | 28.02 | 4.29 |
I4 ACIDIFICATION
- Extent of damage: Detected but not serious.
- Past trends in hydrogen ion concentration in lake water
Since 1976 pH changed from 7.5-7.8 to 6.2-6.4.
I5 OTHER HAZARDS
None.
J. WASTEWATER TREATMENTS
J1 GENERATION OF POLLUTANTS IN THE CATCHMENT AREA (Q)
(c) Limited pollution with wastewater treatment.
J3 SANITARY FACILITIES AND SEWERAGE
- Percentage of municipal population in the catchment area provided with
adequate sanitary facilities (on-site treatment systems) or public sewerage: 92%.
- Municipal wastewater treatment systems
No. of tertiary treatment systems: 2.
No. of secondary treatment systems: 2.
No. of primary treatment systems: 2.
K. IMPROVEMENT WORKS IN THE LAKE
K1 RESTORATION (Q)
River bed dredging at the mouth for the dam safety.
L. DEVELOPMENT PLANS (Q)
Since 1970 - Recreation development.
M. LEGISLATIVE AND INSTITUTIONAL MEASURES FOR UPGRADING LAKE ENVIRONMENTS (Q)
M1 NATIONAL AND LOCAL LAWS CONCERNED
- Names of the laws (the year of legislation)
- The law for water, air and soil protection (1963)
- The law for environment protection (1967)
- The law for water (1969)
- Responsible authorities
- Local authority
- Ministry of Energetics
- Ministry of Agriculture and Forestry
- Main items of control
- Quality and quantity of water inflow
- Quality of water outflow
- Rate of lake sedimentation
M2 INSTITUTIONAL MEASURES
- State Committee for Environment Protection
- Local authority
- Ministry of Health
- Bulgarian Academy of Sciences
M3 RESEARCH INSTITUTES ENGAGED IN THE LAKE ENVIRONMENT STUDIES
- Institute for Hydrology and Meteorology, Sofia
- Institute for Water Management, Sofia
- Environment Protection Research Centre, Sofia
N. SOURCES OF DATA
- Questionnaire filled by Dr. G. Gergov, Institute for Hydrology and Meteorology, Sofia, Bulgaria.
- Handbook of the Bulgarian Rivers, vol. I (1957), II (1958), XVI (1964). Science and Art, Sofia.
- Results from both the Economy and Technical Exploitation of the Bulgarian Large Man-made Lakes (1965). Technica, Sofia.
- Statistical Yearbook for Bulgaria (1986). Sofia.
- The data from field measurements on the man-made lake "G. Dimitrov" supported by a grant of the Ministry of Culture, Science & Education, No. 747/87.

