
LAKE THINGVALLA
A view from the western shore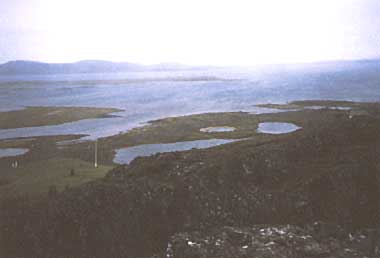
Photo: A.Kurata
A. LOCATION
- Arnes; Sysla; and Iceland.
- 64:15N, 21:07W; 102.5 m above sea level.
B. DESCRIPTION
-
Lake Thingvalla is the largest lake in Iceland with an area of 83.7 km2, a maximum depth of 114 m and an average depth of 34.1 m. The lake is located about 30 km east from Reykjavik in a geologically active zone and is almost entirely tectonic in its origin. In fact, a fault zone traverses Iceland and cuts through the landscape of Thingvalla, actually the lake basin itself.
The yearly cycle of the lake is affected partly by the origin of the lake, and partly by its position in the middle of the Atlantic ocean. Weather is wet and windy throughout the year. The yearly temperature amplitude of the lake is 12deg C. Yearly precipitation ranges from 1,226 mm at the northern to 1,436 mm at the southern end (mean 1975-1980).
The mean discharge rate from the lake is about 110 m3 sec-1, and the retention time is about 300 days, i. e. almost one year. Water mainly flows into the lake via an underground spring system within the porous volcanic lava surrounding the lake on its north and east sides. However, water entering the lake can be divided into two categories on the basis of ionic composition and temperature. In the northwestern part water of glacial origin percolates the lava basement during some 30-70 years before entering the lake, mostly through subterraneous conduits. Water from this direction has the same ionic composition as the lake water. Water coming from geothermically active areas at the southwestern end is slightly warmer and with higher chloride and silicon content than the lake water in general.
The inflows are very stable throughout the year. Although natural in origin, Lake Thingvalla serves as a natural reservoir for an electric power plant with water intake via a tunnel through the mountain barrier embracing the south end. The water level is slightly regulated and fluctuates around 0.5 m. Both the lake and its surroundings are oligotrophic.
A slightly pronounced stratification usually occurs between 10 and 25 m depth in most years. The temperature difference within this layer is 4-4.5deg C. The stratification increases during spring and summer until late August. Cooling of the lake in September starts a gradual, complete mixing of the lake. Recently, symptoms of eutrophication have been observed in the littoral zone of the lake and investigations have been made by responsible authorities (Q, 2, 3, 4).
C. PHYSICAL DIMENSIONS
| Surface area [km2] | 84 |
| Maximum depth [m] | 114 |
| Mean depth [m] | 34.1 |
| Water level | Regulated |
| Normal range of annual water level fluctuation [m] | 0.5 |
| Residence time [yr] | ca. 1* |
D. PHYSIOGRAPHIC FEATURES
D1 GEOGRAPHICAL- Bathymetric map: Fig. EUR-42-01.
- Number of outflowing rivers and channels (name): 1 (unknown).
- Climatic data at Reykjavik, 1983 (l)
| Jan | Feb | Mar | Apr | May | Jun | Jul | Aug | Sep | Oct | Nov | Dec | Ann. | |
|---|---|---|---|---|---|---|---|---|---|---|---|---|---|
| Mean temp. [deg C] | -0.4 | -0.1 | 1.5 | 3.1 | 6.9 | 9.5 | 11.2 | 10.8 | 8.6 | 4.9 | 2.6 | 0.9 | 5.0 |
| Precipitation [mm] | 90 | 65 | 65 | 53 | 42 | 41 | 48 | 66 | 72 | 97 | 85 | 81 | 805 |
Bathymetric map [m](2, 3).
- Water temperature [deg C](2)
| Station 1, May-September 1975 | |||
| Depth [m] | Min | Max | Ann. |
|---|---|---|---|
| 0 | 2.7 | 8.8 | 6.7 |
| 20 | 2.7 | 8.5 | 6.4 |
| 50 | 0.9 | 8.2 | 5.1 |
| 70 | 1.2 | 8.2 | 5.7 |
Seasonal variation of water temperature [deg C] in the lake (2).
- Freezing period: January-late April or early May.
- Mixing type: Monomictic.
- Notes on water mixing and thermocline formation
Thermocline usually occurs between 10 and 25 m depth in most years. The stratification develops during spring and summer until late August.
E. LAKE WATER QUALITY
E2 pH (2)| Station 1, May-September 1975 | |||
| Depth [m] | Min | Max | Ann. |
|---|---|---|---|
| 0 | 7.0 | 7.6 | 7.3 |
| 20 | 7.0 | 7.6 | 7.3 |
| 50 | 7.0 | 7.6 | 7.3 |
| 70 | 7.0 | 7.6 | 7.2 |
Vertical variation of SS concentration [mg l-1] at Station 0 (depth 80 m) and Station 1 (depth 75 m), 23 August 1979 (2).
- Horizontal variation of SS concentration at the depth of 6 m (2).
DM: dry matter, C: carbon, N: nitrogen, CHA: chlorophyll a.
The carbon proportion of the dry matter was calculated to be 0.25 (25.9%).
Sampling stations are shown in Fig. EUR-42-03.
| Date | Station | DM [mg l-1] | C [mg l-1] | N [mg l-1] | CHA [micro l-1] |
|---|---|---|---|---|---|
| 24 Aug | 8 | 0.538 | 0.136 | 0.024 | 0.6 |
| 9 | 0.513 | 0.139 | 0.022 | 0.5 | |
| 11 | 0.430 | 0.126 | 0.020 | 0.5 | |
| 13 | 0.505 | 0.111 | 0.015 | 0.7 | |
| 25 Aug | 3 | 0.945 | 0.145 | 0.022 | 0.5 |
| 6 | 0.485 | 0.055 | 0.011 | 0.5 | |
| 29 Aug | 0 | 0.407 | 0.108 | 0.015 | 0.5 |
| 30 Aug | 1 | 0.479 | 0.107 | 0.018 | 0.4 |
| 1 | 0.450 | 0.118 | 0.019 | 0.4 | |
| 3 | 0.432 | 0.091 | 0.015 | 0.5 | |
| 3 | 0.407 | 0.085 | 0.013 | 0.5 | |
| 8 | 0.330 | 0.100 | 0.014 | - | |
| 8 | 0.373 | 0.124 | - | 0.4 | |
| 9 | 0.405 | 0.139 | 0.019 | - | |
| 9 | 0.471 | 0.151 | 0.023 | 0.3 | |
| 9 | 0.413 | 0.099 | 0.015 | - | |
| 11 | 0.332 | 0.118 | 0.016 | 0.4 | |
| 13 | 0.343 | 0.098 | 0.014 | 0.5 | |
| Averages | 0.459 | 0.114 | 0.016 | 0.5 |
- Trap experiments for SS, 1979
DM: dry matter, C: carbon, N: nitrogen, P: phosphorus. In percentage of DM (2).
| Series 1, 22 August-6 September (15 days) | ||||
| Depth [m] | DM [mg m-2 d-1] | C % | N % | P % |
|---|---|---|---|---|
| 20 | 62 | 7.0 | 1.0 | - |
| 40 | 16 | 8.7 | 1.4 | - |
| 60 | 155 | 9.4 | 1.2 | - |
| 80 | 465 | 6.9 | 1.1 | - |
| Series 2, 6-28 September (22 days) | ||||
| Depth [m] | DM [mg m-2 d-1] | C % | N % | P % |
|---|---|---|---|---|
| 20 | - | 5.9 | 0.8 | 0.19 |
| 40 | - | 4.6 | 0.7 | 0.19 |
| 60 | - | 4.9 | 0.8 | 0.25 |
| 80 | - | 5.0 | 0.8 | 0.27 |
| Series 3, 28 September-9 November (42 days) | ||||
| Depth [m] | DM [mg m-2 d-1] | C % | N % | P % |
|---|---|---|---|---|
| 20 | 857 | 3.4 | 0.5 | 0.18 |
| 40 | 2012 | 3.6 | 0.5 | 0.17 |
| 60 | 3230 | 3.5 | 0.5 | 0.18 |
| 80 | 3365 | 3.5 | 0.5 | 0.19 |
| Station 1, May-September 1975 | |||
| Depth [m] | Min | Max | Ann. |
|---|---|---|---|
| 0 | 7.77 | 9.94 | 8.66 |
| 20 | 7.83 | 9.73 | 8.65 |
| 50 | 8.18 | 9.66 | 8.88 |
| 70 | 7.72 | 9.69 | 8.47 |
Seasonal variation of chlorophyll a concentration at Station 1 (2). See also Fig. EUR-42-03.
E7 NITROGEN CONCENTRATION (2)
- NH4-N [micro l-1]
| Station 1, September-November 1979 | |||
| Depth [m] | Min | Max | Ann. |
|---|---|---|---|
| 6 | 4.2 | 8.4 | 5.6 |
| 20 | 2.8 | 35.0 | 14.0 |
| 40 | 1.4 | 32.2 | 11.6 |
| 70 | 2.8 | 33.6 | 14.4 |
- NO3-N [micro l-1]
| Station 1, March 1975-November 1979 | |||
| Depth [m] | Min | Max | Ann. |
|---|---|---|---|
| 0 | 0.0 | 12.6 | 3.9 |
| 6 | 1.4 | 28.0 | 10.7 |
| 20 | 0.0 | 8.4 | 2.3 |
| 40 | 1.4 | 11.2 | 4.6 |
| 50 | 0.0 | 7.0 | 1.7 |
| 70 | 0.0 | 4.2 | 2.2 |
- Total-N [micro l-1]
| Station 1, March-September 1975 | |||
| Depth [m] | Min | Max | Ann. |
|---|---|---|---|
| 0 | 44.8 | 74.2 | 59.9 |
| 20 | 43.4 | 77.0 | 61.3 |
| 50 | 51.8 | 78.4 | 64.7 |
| 70 | 57.4 | 156.8 91.8 | |
- PO4-P [micro l-1]
| Station 1, March 1975-November 1979 | |||
| Depth [m] | Min | Max | Ann. |
|---|---|---|---|
| 0 | 8.4 | 15.8 | 11.0 |
| 6 | 9.6 | 14.6 | 11.9 |
| 20 | 8.7 | 17.1 | 10.8 |
| 40 | 8.7 | 12.4 | 10.1 |
| 50 | 10.5 | 15.2 | 13.1 |
| 70 | 8.1 | 23.9 | 12.3 |
| Station 1, March-September 1975 | |||
| Depth [m] | Min | Max | Ann. |
|---|---|---|---|
| 0 | 6.04 | 8.42 | 6.81 |
| 20 | 6.04 | 6.54 | 6.34 |
| 50 | 6.13 | 6.73 | 6.40 |
| 70 | 6.08 | 6.56 | 6.35 |
F. BIOLOGICAL FEATURES
F1 FLORA- Emerged macrophytes: None (4).
- Floating macrophytes: None (4).
- Phytoplankton (3)
Ulothrix zonata, U. tenuissima, Cymbella cistula, Synedra ulna, Fragilaria vauheriae, Nitzschia dissipata, Anabaena inaequalis, Tolypathrix distorta, Calothrix braunii, Nostoc sp., Gomphonema clevei, Epithemia turgida, Rhoicosphenia curvata, Achanthes lancedata, Amphora ovalis var. pediculus, Cocconeis placentula var. lineata, Cladophora glomerata, C. aegagropila.
Gross production at Station 1 (3).
F4 BIOMASS: Fig. EUR-42-06 and 07.
Vertical distribution of periphyton standing crop [mg total chlorophyll a per m2 of the stone surface covered with algae] in the 3 transects in 1977 (Fig. EUR-42-01) and the Midfell transect in 1978 and 1982 (3).
Standing crop of periphyton [total chlorophyll a mg per m2 of the stone surface covered with algae] at various depths during the summer in 1978 and 1981 (3).
G. SOCIO-ECONOMIC CONDITIONS (Q, 4)
G1 LAND USE IN THE CATCHMENT AREA (1990)- Mostly rocky barren area and moss-covered grazing fields; no forests nor crop fields.
- None.
- Very scarce.
H. LAKE UTILIZATION (Q, 3, 4)
H1 LAKE UTILIZATION- Source of water, sight-seeing and tourism.
- For power plant and domestic water.
I. DETERIORATION OF LAKE ENVIRONMENTS AND HAZARDS (Q, 3, 4)
I1 ENHANCED SILTATION- Extent of damage: Slight.
- Present status: None.
- Nuisance caused by eutrophication: None.
- Extent of damage: None.
J. WASTEWATER TREATMENTS (Q, 3, 4)
J1 GENERATION OF POLLUTANTS IN THE CATCHMENT AREA- (b) No sources of significant pollution.
- None.
K. IMPROVEMENT WORKS IN THE LAKE (Q, 4)
- Investigations have been done on the trend of eutrophication by responsible authorities and improvement works are being planned.
L. DEVELOPMENT PLANS (Q, 4)
- None.
M. LEGISLATIVE AND INSTITUTIONAL MEASURES FOR UPGRADING LAKE ENVIRONMENTS
M3 RESEARCH INSTITUTES ENGAGED IN THE LAKE ENVIRONMENT STUDIES (3)- University of Iceland, Marine Research Institute
- The National Energy Authority
- The Thingvalla Commission
- The Power Plant Landsvirkjun
N. SOURCES OF DATA
- Questionnaire filled by the editors with the support of Dr. G. S. Jonsson, National Centre for Hygiene, Food Control and Environmental Protection, Reykjavik, Iceland, based on the following sources.
- Tokyo Shoseki (1983) A Latest Economical Survey of World Countries (Saishin Sekai Kakkoku Yoran, 1983 nendo-ban). 399 pp. Tokyo Shoseki, Tokyo.*
- Lastein, E. (1983) Oikos, 40: 103-112.
- Jonsson, G. S. (1987) Arch. Hydrobiol., 108: 531-547.
- The editor's observation.
* Printed in Japanese. The title is tentatively translated into English with the original title in romanized Japanese in parentheses.
