
LAKE SLAPY
A view from the damside hill
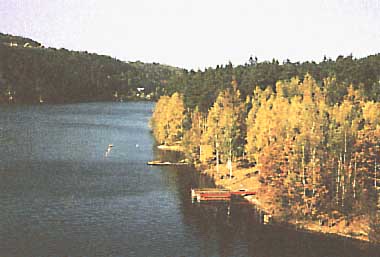
Photo: M. Straskraba
A. LOCATION
- Bohemia, Czechoslovakia.
- 49:37N, 14:20E; 271 m above sea level.
B. DESCRIPTION
Lake Slapy is a multipurpose reservoir
built on the Vltava River about 40 km south of Praha, the capital
of Czechoslovakia. It represents the third major step of the
Vltava Cascade of Reservoirs (Lipno, Orlik and Slapy) built primarily
for power generation. Orlik Reservoir (volume 0.722 km3, 75 km
long, 70 m deep, completed in 1960) with its re-regulation step
(volume 0.013 km3) is located immediately upstream of Slapy.
After its completion in 1954, the Slapy area became recreational
and, because of the lack of natural lakes in the country, is
heavily visited during summer.
The underlying geological formation is
a plutonic massif, the bed being formed by granodiorite from
the younger Paleozoic with the inclusion of Algonkian paleo-volcanites.
The reservoir is riverine in its shape, with an average width
of about 300 m and a length of 44.5 km, and is rather through-flowing.
Due to the peak power generation at both Slapy and Orlik reservoirs,
the water level fluctuates daily in addition to the seasonal
variation with winter minima. Characteristic is the brown water
color resulting from the paper mill industry in the upper reaches
of the Vltava (some 200 km upstream from Slapy) and also from
natural fulvic acids supplied by bogs in the Black Forest Mountains.
Other sources of pollution are municipal sewage containing wastewater
from food industry and agricultural non.point runoff.
During its history the reservoir water
quality has changed several times: due to "reservoir aging"
in 1954-58 when heavy water blooms of blue-greens were observed,
in 1960 due to construction of Orlik Reservoir immediately upstream,
and in 1966 due to stopping the operation of old paper mills
in the upper reaches which reduced the load of resistant organic
matter and decreased the brown water colour. Also, the use of
motor boats and houseboats has been prohibited since 1970. Most
profound effects were due to the construction of the upstream
reservoir, which resulted in lowering the load of phosphorus
due to its retention by Orlik Reservoir and resultant shifting
of the blooms to that reservoir. Also, the stratification structure
in Slapy changed: until the construction of Orlik, Slapy were
fed by a river with a natural temperature regime, whereas afterwards
the inflow is mainly hypolimnic water of Orlik. A continuous
water quality trend is related to the development of agriculture
in the watershed (about 50% of the watershed is agricultural
land). During the last thirty years the amount of fertilizers
applied to the drainage area has been gradually increasing and
field meliorations were carried on in the upper reaches of the
river. This is mainly reflected in the concentration of nitrogen
compounds (annual mean values up to 5 mg l-1 N), but also of
chlorides and sulphates. Concerning limnological research Slapy
Reservoir is, on a long term basis, one of the most intensively
studied reservoirs (Q).
C. PHYSICAL DIMENSIONS (Q)
| Surface area [km2] | 13 |
| Volume [km3] | 0.27 |
| Maximum depth [m] | 53 |
| Mean depth [m] | 20.7 |
| Water level | Regulated |
| Normal range of annual water level fluctuation [m] | 5-25* |
| Length of shoreline [km] | 150 |
| Residence time [yr] | 0.1 |
| Catchment area [km2] | 12,900 |
| * Exceptional. | |
D. PHYSIOGRAPHIC FEATURES
D1 GEOGRAPHICAL
- Sketch map: Fig. EUR-39-01.
- Names of main islands: None.
- Number of outflowing rivers and channels (name): 1 (Vltava R.).
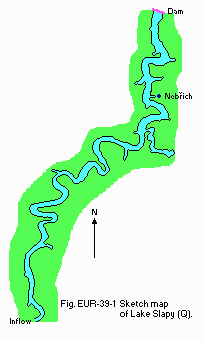
Fig. EUR-39-01
Sketch map (Q).
D2 CLIMATIC (1)
- Climatic data
| Mean temp. [deg C]*1 | ||||||||||||
| Jan | Feb | Mar | Apr | May | Jun | Jul | Aug | Sep | Oct | Nov | Dec | Ann. |
|---|---|---|---|---|---|---|---|---|---|---|---|---|
| -2.5 | -0.3 | 2.2 | 8.1 | 12.3 | 16.0 | 16.9 | 16.2 | 12.9 | 8.1 | 3.5 | -0.8 | 7.7 |
| Precipitation [mm]*2 | ||||||||||||
| 23 | 30 | 30 | 39 | 81 | 88 | 56 | 66 | 46 | 34 | 39 | 27 | 559 |
| *1 Solenice, 1958-1967. *2 Slapy, 1967-1974. | ||||||||||||
- Number of hours of bright sunshine: 1,489 hr yr-1.
- Solar radiation: 10.4 MJ m-2 day-1.
- Water temperature [deg C](2, 3, 4)
| Nebrich, 1960-1970 | |||||||||||||
| Depth [m] | Jan | Feb | Mar | Apr | May | Jun | Jul | Aug | Sep | Oct | Nov | Dec | Ann. |
|---|---|---|---|---|---|---|---|---|---|---|---|---|---|
| S*1 | 3.0 | 1.8 | 2.5 | 6.8 | 13.6 | 18.7 | 21.1 | 19.7 | 17.6 | 14.6 | 11.1 | 7.3 | 11.9 |
| 5 | 3.3 | 2.0 | 2.6 | 5.1 | 10.1 | 14.5 | 17.3 | 18.0 | 17.0 | 14.6 | 11.1 | 7.3 | 10.5 |
| 10 | 3.4 | 2.2 | 2.6 | 4.9 | 8.6 | 11.5 | 14.2 | 16.0 | 16.3 | 14,6 | 11.1 | 7.3 | 9.5 |
| 15 | 3.5 | 2.3 | 2.6 | 4.7 | 8.1 | 10.9 | 13.6 | 15.9 | 15.6 | 14.6 | 11.1 | 7.3 | 9.2 |
| 20 | 3.6 | 2.5 | 2.6 | 4.6 | 7.4 | 10.2 | 13.1 | 14.7 | 15.3 | 14.5 | 11.1 | 7.3 | 8.9 |
| 30 | 3.7 | 2.9 | 2.8 | 4.3 | 6.8 | 9.4 | 12.4 | 13.8 | 14.8 | 14.0 | 10.6 | 7.1 | 8.6 |
| B*2 | 3.8 | 3.1 | 2.9 | 4.2 | 6.1 | 8.5 | 10.6 | 11.5 | 12.5 | 12.4 | 10.4 | 6.8 | 7.9 |
| *1 Surface. *2 Bottom. | |||||||||||||
- Freezing period: January-March.
- Mixing type: Dimictic.
- Notes on water mixing and thermocline formation
All measures of stratification and mixing intensity such as the degree of stratification, surface and bottom temperature, thermocline depth, coefficient of turbulent diffusion and heat budget are strongly related to theoretical retention time.
E. LAKE WATER QUALITY
E1 TRANSPARENCY: Fig. EUR-39-02.
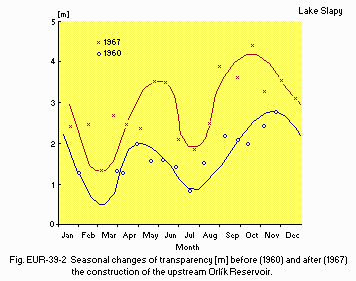
Fig. EUR-39-02
Seasonal changes of transparency [m] before (1960) and after
(1967) the construction of the upstream Orlik Reservoir.
E2 pH: Fig. EUR-39-03.
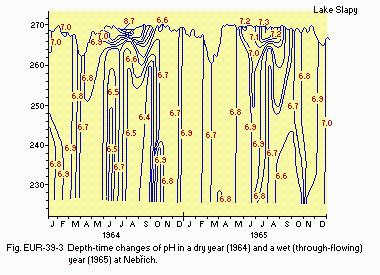
Fig. EUR-39-03
Depth-time changes of pH in a dry year (1964) and a wet (through-flowing)
year (1965) at Nebrich.
E4 DO: Fig. EUR-09-04.
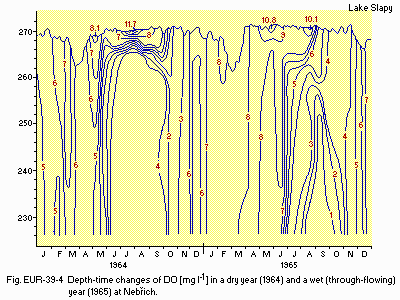
Fig. EUR-39-04
Depth-time changes of DO [mg l-1] in a dry year (1964) and a
wet (through flowing) year (1965) at Nebrich.
E5 COD Determined by K2Cr2O7 method: Fig. EUR-39-05.
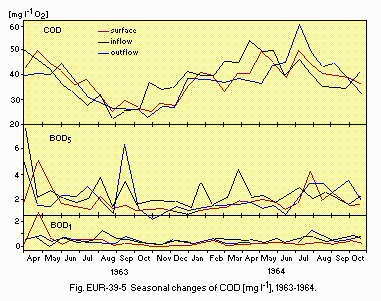
Fig. EUR-39-05
Seasonal changes of COD [mg l-1], 1963-1964.
E6 CHLOROPHYLL CONCENTRATION [micro g l-1]
| Nebrich, 1964-1975 | ||||||||||||
| Depth [m] | Jan | Feb | Mar | Apr | May | Jun | Jul | Aug | Sep | Oct | Nov | Dec |
|---|---|---|---|---|---|---|---|---|---|---|---|---|
| 0-4 | 0.7 | 1.2 | 0.8 | 13.3 | 17.5 | 7.3 | 16.6 | 14.9 | 7.9 | 1.4 | 0.8 | 0.7 |
E7 NITROGEN CONCENTRATION
- Total-N: Fig. EUR-39-06.
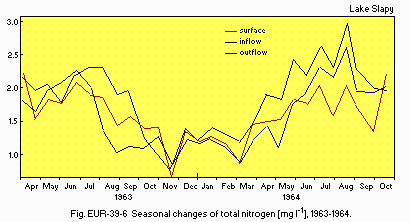
Fig. EUR-39-06
Seasonal changes of total nitrogen [mg l-1], 1963-1964.
E8 PHOSPHORUS CONCENTRATION
- PO4-P: Fig. EUR-39-07.
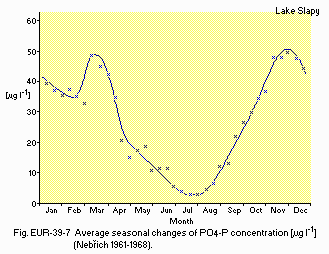
- Fig. EUR-39-07 Average seasonal changes of PO4-P concentration [micro g l-1](Nebrich 1961-1968).
E9 CHLORIDE CONCENTRATION [mg l-1]
| Slapy, 1978-1986 | ||||||||||||
| Depth [m] | Jan | Feb | Mar | Apr | May | Jun | Jul | Aug | Sep | Oct | Nov | Dec |
|---|---|---|---|---|---|---|---|---|---|---|---|---|
| 0 | 11.0 | 15.1 | 15.5 | 16.2 | 17.7 | 18.6 | 17.7 | 17.1 | 16.1 | 15.1 | 14.6 | 15.0 |
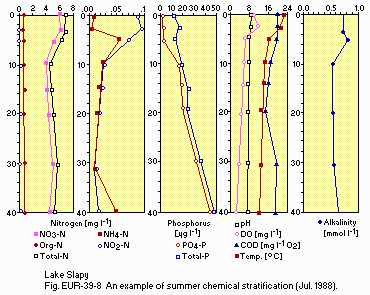
Fig. EUR-39-08
An example of summer chemical stratification (July 1988).
E10 PAST TRENDS: Fig. EUR-39-09.
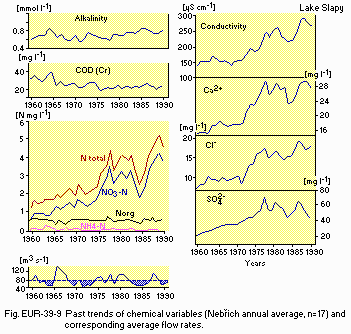
Fig. EUR-39-09
Past trends of chemical variables (Nebrich annual average, n
= 17) and corresponding average flow rates.
F. BIOLOGICAL FEATURES
F1 FLORA
- Emerged macrophytes
- Phytoplankton (2, 3, 4, 7)
Due to large water-level fluctuations there are no macrophytes in the lake.
Altogether 200 species were found. Dominant species differ according to the season. However, the species composition of different periods also shifts with time. Spring peak Rhodomonas lacustris, Cryptomonas marssonii, C. reflexa, C. curvata, Chrysococcus spp., Stephanodiscus hantzschii, Cyclotella comta, Aulacoseira granulata, Asterionella formosa, Nitzschia acicularis, Peridinium spp., Chrysococcus biporus, Ch. rufescens. Lake spring minimum Rhodomonas lacustris, Cryptomonas marssonii, C. reflexa, C. curvata, Chlamydomonas spp., Chlorococcales gen. div., Anabaena circinalis. Summer peak Cryptomonas marssonii, C. reflexa, Ceratium hirundinella, Aulacoseira granulata, Melosira italica, Asterionella formosa, Fragilaria crotonensis, Microcystis aeruginoaa, Aphanizomenon flos-aquae, Anabaena circinalis, A. flos-aquae, Oscillatoria limnetica, Pandorina morum, Coelastrum, Crucigeniella apiculata, Monoraphidium spp., Pediastrum spp., Scenedesmus spp., Sphaerocystis. Fall: Chrysococcus biporus, Ch. rubescens, Asterionella formosa, Fragilaria crotonensis, Rhodomonas lacustris. Other occasionally common species Trachelomonas volvacina, Synedra acus, Staurastrum sp., Aulacoseira sp., Gymnodinium spp., Closterium polymorphum, Cl. limneticum.
F2 FAUNA
- Zooplankton (2, 3, 4, 8)
- Benthos (3)
- Fish (9)
Abundant species of Ciliata: Cyclidium sp., Glaucoma spp., Halteria grandinella, Strombilidium spp., Vorticella natans. Abundant species of Rotatoria: Keratella guadrata, K. cochlearis, Asplanchna priodonta, Brachionus calyciflorus, B. angularis, B. quadridentatus, B. urceolaris, Polyarthra major, Synchaeta spp., Pedalia mira, Filinia longiseta, Kellicottia longiseta, Conochilus unicornis. Altogether more than 30 species of Rotatoria were found. Abundant Cladocera: Leptodora kindtii, Polyphemus pediculus, Limnosida frontosa, Daphnia galeata, D. cucullata, Bosmina longirostris, B. coregoni, Diaphanosoma brachyurum, Ceriodaphnia quadrangula. Abundant Copepoda: Mesocyclops leuckarti, Cyclops vicinus, Thermocyclops hyalinus, Th. crassus, Acanthocyclops cf. americanus, Megacyclops viridis, Diacyclops bicuspidatus, Eudiaptomus gracilis. Together 22 species of Crustacea were recorded.
Together 33 benthic animal taxa were recorded. Most common are Turbellaria, Oligochaeta (genera Tubifex and Limnodrilus), Hirudinea (Helobdella stagnalis), Chironomidae (Chironomus fl. plumosus and fl. semireductus, Glyptotendipes gr. gripekoveni, Polypedillum gr. nubeculosum, Procladius, Tanytarsus), Sphaeriidae (Asellus aquaticus).
The ichthyocoenosis consisted in 1982-1987 of 26 fish species belonging to 7 families (Salmonidae, Esocidae, Thymallidae, Cyprinidae, Siluridae, Anguillidae and Percidae). Rutilus rutilus and Perca fluviatilis were the dominant species, also Abramis brama. Gymnocephalus cernuus and Alburnus alburnus abundant; Cyprinus carpio was the most important angled fish. Dominant predators were Esox lucius, Stizostedion lucioperca and Silurus glanis.
F3 PRIMARY PRODUCTION RATE
- Gross primary production rate for phytoplankton (3, 4)
Annual gross production [g m-2 day-1] Nebrich Station, 1962-1969: 6.12 (0.90-13.02). By light and dark bottle/oxygen method. Composite value based on the measurements at 0, 0.5, 1, 2, ..., 6 m depths and recalculated from half-day exposures.
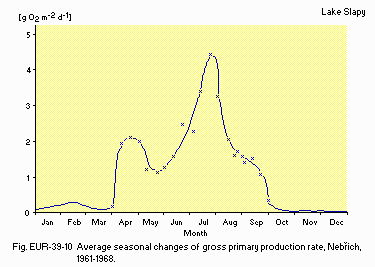
Fig. EUR-39-10
Average seasonal changes of gross primary production rate, Nebrich,
1961-1968.
F4 BIOMASS
- Phytoplankton (3, 4, 7)
- Zooplankton (2, 4, 8)
- Benthos (3)
- Fish (9)
The long term annual average is about 1.9 mg (fresh wt.) l-1. The annual development is characterized by a two-peak curve (spring and summer peaks) reaching maxima between 2.6 and 11.5 mg (fresh wt.) l-1 in different years. Winter values are extremely low (0.2-3 micro (fresh wt.) l-1).
The average value for the period 1959-1969 was for the top 5 m 0.195 g m-2 protein N, which is equivalent to about 23 g (fresh wt.) m-2. Cladocera accounted for about 50% of the total biomass.
At depths 30 m and 40 m at the sampling station Nebrich, the biomass was 62-96 g (fresh wt.) m-2 in 1960 and dropped to 51-56 g m-2 in 1961 after the construction of Orlik Reservoir. Oligochaeta amounted to 91-99% in both years. At a station near the river entrance the biomass was between 197 and 346 g m-2 in 1960, but dropped to just 5-8 g m-2 in 1961.
Rutilus rutilus and Perca fluviatilis comprised in average 75% of the biomass of all fish species caught by nets. Esox lucius and Stizostedion lucioperca formed 8% of the biomass.
F5 FISHERY PRODUCTS
- Annual fish catch [metric tons]
1958-1963: 21.0*1, 23.5*2. *1 By anglers. *2 By nets. - Fishery products other than fish: None.
F6 PAST TRENDS
- Past trends of phytoplankton community
Before Orlik Reservoir construction (samples from 1960-1961) the average biomass in the top 3 m was 4.13 mg (fresh wt.) l-1, with maxima formed mainly (97-100%) by heavy blooms of Aphanizomenon flos-aquae and Microcystis aeruginosa reaching 24.9 mg l-1. Since then, the biomass in fresh weight has remained nearly constant. However, chlorophyll a concentrations almost doubled within the last 30 years (average for 1963-1969,6.89 mg l-1, for 1982 -1989, 11.42 mg l-1). This is due to the replacement of larger species with low chlorophyll content (Ceratium hirundinella, Peridinium spp., diatoms) by smaller Cryptophycae, Volvocales and Chlorococcales with higher chlorophyll content. Recently also minute colonial Chlorococcales of the genera Aphanothece and Aphanocapsa have started to appear. In the seasonal changes the domination of summer peaks was replaced within the last 30 years by spring peaks which now represent the annual maxima (2, 3, 4, 7).
| Phytoplankton biomass and productivity (4) | ||||
| Period | '60-'61 | '63-'69 | '75-'83 | '84-'89 |
|---|---|---|---|---|
| Gross production rate [g m-2 day-1] | 2.37 | 1.62 | - | - |
| Biomass [mg (fresh wt.) l-1] | 4.13 | 1.76 | 1.92 | - |
| Chlorophyll a [g l-1] | - | 6.86 | 10.02 | 11.52 |
- Past trends of zooplankton community
Biomass was lower during 1959-1960 (the pre-Orlik period) with heavy blooms of blue-greens: 0.101-0.149 g m-2 protein N (2, 4, 8).
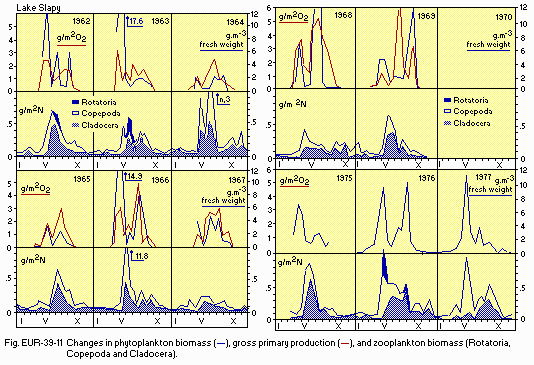
Fig. EUR-39-11
Changes in phytoplankton biomass, gross primary production, and
zooplankton biomass (Rotatoria, Copepoda and Cladocera).
- Past trends of fish community
- Past trends of benthos
Evident changes in the relative abundance of some species are observed when the two periods 1959-1963 and 1985-1987 are compared. The relative abundance of Abramis brama decreased from 57% to 3%, while the relative biomass of Rutilus rutilus and Perca fluviatilis increased from 43% to 75% (9).
In the pre-Orlik period the biomass of benthos in the inflow part of the reservoir was by two orders of magnitude larger than afterwards (annual average 150 g m-2 in 1960 and 4.9 and 1.2 g m-2 in 1961 and 1963, respectively). In the lower part near the dam the changes were less conspicuous (44 g m-2 in 1961 versus 34 and 22 g m-2 in 1961 and 1963, respectively).
F7 NOTES ON THE REMARKABLE CHANGES OF BIOTA IN THE LAKE IN RECENT YEARS (4)
Cyclic changes between years with alternating high and low bacteria numbers were observed, and possible causative factors such as secular changes of sun spots number, associated hydrometeorological changes and the relations between phyto- and zooplankton were investigated (Fig. EUR-39-12). In 1970-1975 some submerged objects were heavily overgrown by a freshwater bryozoan Pectinatella magnifica. The appearance of a fresh water medusa Craspedacusta sowerbyi in 1989 was also peculiar. The changes associated with the construction of upstream Orlik Reservoir in 1960: disappearance of heavy blooms of Aphanizomenon flos-aquae and Microcystis aeruginosa. Light blooms of Microcystis started to reappear in the late 1980's.
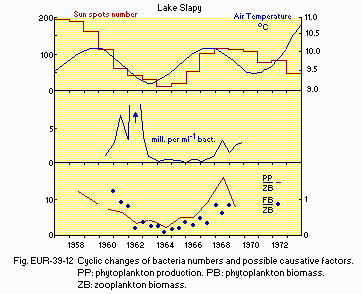
Fig. EUR-39-12
Cyclic changes of bacteria numbers and possible causative factors.
PP: phytoplankton production.
G. SOCIO-ECONOMIC CONDITIONS
G1 LAND USE IN THE CATCHMENT AREA(11)
| 1988 | ||
| Area[km2] | [%] | |
|---|---|---|
| - Natural landscape | 3,870 | 30 |
| - Agricultural land | ||
| Crop field | 6,192 | 48 |
| Pasture land | 387 | 3 |
| - Others | 2,451 | 19 |
| - Total | 12,900 | 100 |
- Types of important forest or scrub vegetation
- Main kinds of crops: Wheat, barley, oat, potato, maize.
- Levels of fertilizer application on crop fields: Heavy.
Coniferous forests (Picea, Pinus, Abies); percentage of broadleaf deciduous forests (dominantly Fagus) is low.
Between 1959-1982 a significant increasing trend in fertilizer application was noted (relative increase for N 7 times, for P 4 times, for K 3 times. After 1982 the levels fluctuate around 100 kg for N, 30 kg for P and 60 kg ha-1 yr-1 for K (4, 6, 8, 12).
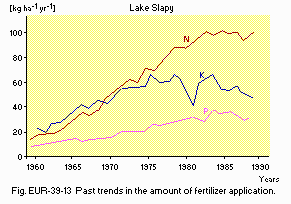
Fig. EUR-39-13
Past trends in the amount of fertilizer application.
G2 INDUSTRIES IN THE CATCHMENT AREA AND THE LAKE (11)
The watershed is dominated by primary industry, about 10% of population are engaged in agriculture in about 200 establishments (state or collective agricultural units). Secondary industry - mainly paper mills and power plant, and partly food processing and some machinery and textile factories.
- Number of domestic animals in the catchment area
Cattle 490,000, sheep 36,000, swine 578,000, poultry 3,227,000, others 3,000.
G3 POPULATION IN THE CATCHMENT AREA (11)
| 1988 | |||
| Population | Population density [km-2] | Major cities (population) | |
|---|---|---|---|
| Urban | 162,438 | 92 | C. Budejovice, Pisek, Tabor |
| Rural | 534,778 | 47 | |
| Total | 697,216 | 62 | |
H. LAKE UTILIZATION
H1 LAKE UTILIZATION
Source of water, sightseeing and tourism, recreation (swimming, sport-fishing, yachting), fisheries and power generation.
H2 THE LAKE AS WATER RESOURCE
| Use rate [GWh yr-1] | |
|---|---|
| Domestic | Local use |
| Power plant | 300 |
I. DETERIORATION OF LAKE ENVIRONMENTS AND HAZARDS (Q, 1, 2, 8, 9, 16)
I1 ENHANCED SILTATION
- Extent of damage: Not serious.
- Supplementary notes
Before the construction of upstream Orlik Reservoir, siltation was important, with effects on water quality of the inflowing river stretch. After 1960 there is nearly no siltation, all sediments being retained in Orlik Reservoir.
I2 TOXIC CONTAMINATION
- Present status: Detected but not serious.
- Main contaminants, their concentrations and sources
| Dam, 1976-1980 | ||
| Name of contaminants | Range of concentrations in water [micro g l-1] | Main sources |
| Zn | 10-650 | Industrial |
| Cu | 10-80 | |
| Pb | 3-8 | |
| Hg | max 0.7 | |
| Cd | 2 | |
- Past trends (13)
Pesticides concentrations determined in 1976-1977; pp' DDT 3 micro l-1, -HCH 0.5 micro l-1, aldrin 1 micro l-1, endrin 0.1 micro l-1, heptachlor 0.5 micro l-1.
I3 EUTROPHICATION
- Nuisance caused by eutrophication
- Nitrogen and phosphorus loadings to the lake
Unusual algal bloom (Aphanizomenon flos-aquae, Microcystis aeruginosa) and nuisance to swimming (prior to 1960).
| 1987 | |||
| Sources | Total | ||
|---|---|---|---|
| T-N | 1.4 [kg m-2 yr-1] | Agricultural (75%) | |
| T-P | 19 [g m-2 yr-1] | Domestic and agricultural (90%) | |
- Supplementary notes
Nitrogen loadings to the lake are continuously increasing from 1959 (0.23 kg m-2 yr-1) till present (1987: 1.4 kg m-2 yr-1). The source is dominantly agriculture. Phosphorus loadings before the construction of Orlik Reservoir (1959-1960) amounted to 15-25 g m-2 yr-1, but thereafter dropped to 5-20 g m-2 yr-1.
I4 ACIDIFICATION
- Extent of damage: None.
- Past trends in hydrogen ion concentration in lake water
Rain water is highly acid, with a mean pH value (volume-weighted average for the last 10 years) of 4.25. The following bulk precipitation loads [kg ha-1 yr-1] were observed in the last 10 years (1979-1987)(14).
Due to large natural buffering capacity and high nutrient and mineral contents due to fertilizer runoff, no signs of acidification have appeared in the lake.
| T-N | NO3-N | NH4-N | Org-N | T-P | Org-C | SO4-S | Na | K | Ca | Mg |
|---|---|---|---|---|---|---|---|---|---|---|
| 11.5 | 4.4 | 4.3 | 2.8 | 0.16 | 16 | 18 | 1.6 | 1.3 | 5.1 | 0.62 |
I5 OTHER HAZARDS
There are several sources of radioactivity in the watershed. Since 1962 a potential source is the treatment plant for uranium ore at Mydlovary. In 1982 uranium concentrations up to 0.37 mg-1-1 corresponding to about 22 Bq. 1-1 were recorded in the Vltava River above Slapy. Recent examination (1990) did not show any significant hazards.
J. WASTEWATER TREATMENTS
J1 GENERATION OF POLLUTANTS IN THE CATCHMENT AREA
d) Measurable pollution with limited wastewater treatment.
J2 APPROXIMATE PERCENTAGE DISTRIBUTION OF POLLUTANT LOADS
| [%] | |
|---|---|
| - Non-point sources (agricultural, natural and dispersed settlements) | 50 |
| - Point sources | |
| Industrial (paper mill wastes) | 50 |
| - Total | 100 |
J3 SANITARY FACILITIES AND SEWERAGE
- Percentage of municipal population in the catchment area
provided with
adequate sanitary facilities (on.site treatment systems) or public sewerage: 78.1%. - Percentage of rural population with adequate sanitary facilities
(on-site
treatment systems): None. - Municipal wastewater treatment systems
No. of tertiary treatment systems: None. No. of secondary treatment systems: 125. - Industrial wastewater treatment systems
No. of industrial wastewater treatment systems: 51.1% (total industrial sewage is treated; for paper mill industry a combined paper-mill/municipal sewage treatment system and an evaporation unit are under construction.)
L. DEVELOPMENT PLANS
Drinking water supply for Prague from or below Slapy Reservoir
- being planned for the year 2000.
Significant extension of the paper-mill industrial wastewater
treatment - under construction. A nuclear power plant - in the
process of construction at Temelin, some 8 km above the inflow
to Orlik and 90 km above Slapy. The operation of the first two
blocks of 1,000 MW each is expected to start in 1993; the construction
of two other blocks is under debate. The expected concentration
of tritium will be much below the WHO safety limit. Phosphorus
and sulphate concentrations may be more harmful.
M. LEGISLATIVE AND INSTITUTIONAL MEASURES FOR UPGRADING LAKE ENVIRONMENTS
M1 NATIONAL AND LOCAL LAWS CONCERNED
- Names of the laws (the year of legislation)
- 25/75 (1975)
- 28/75 (1975)
- 3/77 (1977)
- 83 0603 Czechoslovak State Norm
- 83 0611 Czechoslovak State Norm
- Responsible authorities
- Government of Czech Socialistic Republic
- Czech Ministry of Forestry and Water Management
- Czech Ministry of Forestry and Water Management
- Main items of control
- Determination of permissible degrees of the parameters of water pollution.
- Identification of streams for water supply and their watersheds and listing streams significant for water management.
- Protection of the quality of surface and ground waters.
- Monitoring of the quality of surface waters.
- Drinking water.
- Supplementary notes
Additional Czechoslovak State Norms: Instruction by Czech Ministry of Forestry and Water Management and Czech Ministry of Health and Nutrition on improvement of the quality of water in selected water supply reservoirs by specialized fish management. 83 0612 Operational monitoring of the quality of drinking water in water management; 83 0520 Physical-chemical analysis of drinking water; 83 0532 Biological analysis of surface water.
M2 INSTITUTIONAL MEASURES
- Povodi Vltavy (Vltava River Board)
M3 RESEARCH INSTITUTES ENGAGED IN THE LAKE ENVIRONMENT STUDIES
- Water Research Institute at Prague (15)
- Slapy Field Station of the Hydrobiological Laboratory (now Hydrobiological Institute), Czechoslovak Academy of Sciences
- Supplementary notes (2, 3, 4, 6, 7, 8, 10, 13, 14)
Long-term scientific investigations (since 1958 till present) of the Slapy Reservoir ecosystem from the physical, chemical, bacteriological and biological points of view. The following items are studied particularly; automatic monitoring of several parameters during summer months of several years; development of new chemical, bacteriological and biological methods; mathematical modelling of water quality; comparison between reservoirs of the effect of retention time on reservoir limnology; eutrophication studies; interrelations between bacteria, phytoplankton, zooplankton and fish.
N. SOURCES OF DATA
- Questionnaire filled by Dr. M. Straskraba, Hydrobiological Laboratory, Czechoslovak Academy of Sciences.
- Data by the Hydrometeorological Institute, Praha.
- Hrbacek, J. (ed.)(1966) Hydrobiological Studies, vol. 1. 408 pp. Academia, Praha.
- Hrbacek, J. & Straskraba, M. (eds.)(1973) Hydrobiological Studies, vol. 2. 348 pp. Academia, Praha.
- Data by the staff of Hydrobiological Laboratory, Czechoslovak Academy of Sciences. See also Annual Reports vols. 1-28, Hydrobiological Laboratory GAS, Praha and G. Budejovice.
- Straskraba, M. (1971) Limnological basis for modelling reservoir ecosystems. "Man-made Lakes: Their Problems and Environmental Effects (Geophysical Monograph Series 17)"(ed. Ackerman, W. C., White, G. F. & Worthington, E. B.), pp. 517-535.
- Prochazkova, C. & Blazka, P. (1986) Long-term trends in water chemistry of the Vltava River (Czechoslovakia). Limnologica (Berlin) 17: 263-271. See also --- (1989) Ionic composition of reservoir water in Bohemia: long-term trends and relationships. Arch. Hydrobiol., 33: 323-330.
- Desortova, B. (1980) Phytoplankton of Slapy Reservoir. Sbornik Vlastivednych praci z podblanicka, 21: 33-50 (in Czech). --- (1980) Seasonal development of phytoplankton in Slapy Reservoir with special attention to the spring algal phase. Arch. Hydrobiol. Beih., Ergebn. Limnol., 33: 409-417.
- Hrbacek, J. (1984) Ecosystems of European man-made lakes. "Lakes and Reservoirs" (ed. Taub, F.), pp. 267-290. Elsevier, Amsterdam.
- Hanel, L. (Klandruby) Personal communication.
- Straskrabova, V. (in print): Periodic interannual oscillations in bacterial number and activity related to meteorological cycles. Verh. Internat. Verein Limnol.
- Statistical Yearbook of Czechoslovakia (in Czech). SNTL, Praha.
- Straskraba, M., et al. (1981) Estimation of further development of water quality in the lower part of the Vltava Cascade. Final Reports, Section of Hydrobiology, Inst. Landscape Ecology CAS, Praha (in Czech).
- Prochazkova, L. & Bcazka, P. (1984) Summery of Papers and Reports Considering the Vltava River as Water-supply Source of the City of Prague and Its Surroundings. 15 pp. Report, Inst. Landscape Ecol., Section of Hydrobiology (in Czech).
- Blazka, P. & Prochazkova, L. (1987) Relationship of sulphate and nitrate concentrations and pH of precipitations. "Proc. Internat. Workshop on Geochemistry and Monitoring in Representative Basins" (ed. Moldan, B. and PaCes, T.), pp. 26-28. GEOMON, Czechoslovakia.
- Bradka, J. (1965) The Resulting Effect of Reservoirs of the Vltava Cascade on Water Quality. Final Report, Water Research Institute, Praha (in Czech).
