
LAKE ONEGO
A view on the lakeshore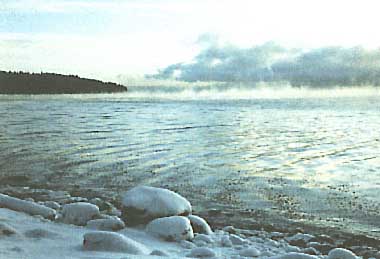 Photo: M. I. Fedorov
A. LOCATION
- Karelian ASSR, Leningrad and Vologda regions of RSFSR, Russia.*
- 60:55-62:55N, 34:14-36:30E; 35 m above sea level.
* Place names are not updated.
B. DESCRIPTION
-
Lake Onego
is the second largest lake in Europe next to Lake Ladoga. The lake basin
is situated on two contrasting parts of the earth crust with different
geological histories, Baltic shield and Russian plate. The boundary runs
approximately along the line connecting the mouths of the Vodla River and
the Shuja River. To the north of the boundary, the shoreline is extremely
jagged, and the greater part of islands and numerous fjord-type bays are
found. The northern basin is surrounded by hills and cliffs consisting
of crystalline rocks. There, land relief forms are oriented from northwest
to southeast, following the direction of ice flow during glacial periods.
Deep hollows (90- 100 m deep) are interspersed with ridges only 1-2 m below
the water surface. The southern basin is relatively shallow with a mean
depth of 30 m and more or less flat bottom. Shorelines are less jagged,
and are frequently covered by marsh.
Tectonic processes in the pre-glacial period, combined with glacial erosion and transport, formed the specific hydrographical network. The history of Lake Onego experienced several glacial periods, when its flora and fauna were exterminated. The last glaciation ended 11,000-12,000 years ago. The lakeshore became inhabited some 9,000 years ago. Some 800 rock drawings or so-called petrogliffs, which were made from the end of the third to the beginning of the second millennium B. C., are invaluable heritage in the history human culture. On the lake shore, there are also a number of wood architectures of 17-18th centuries including world-famous Kizhi-ensemble.
Lake Onego is now the source of freshwater of high quality (total mineral concentration 34-36 mg l-1). It also forms part of the major waterborne transport system in the USSR, and serves as a reservoir for hydroelectric power generation and an important fishing ground.
C. PHYSICAL DIMENSIONS (Q)
| Surface area [km2] | 9,890 |
| Volume [km3] | 280 |
| Maximum depth [m] | 120 |
| Mean depth [m] | 30 |
| Water level | Regulated |
| Normal range of annual water level fluctuation [m] | 0.5 |
| Residence time [yr] | 12 |
| Catchment area [km2] | 51,540 |
D. PHYSIOGRAPHIC FEATURES
D1 GEOGRAPHICAL (Q)- Sketch map: Fig. EUR-36-01.
- Names of main islands
- Number of outflowing rivers and channels (name): 1 (Svir R.).
Klimenetskiy (148 km2), Lelikovskiy (21 km2) and Suisari (19.3 km2).
- Climatic data, 1870-1950
| Mean temp. [deg C]*1 | ||||||||||||
| Jan | Feb | Mar | Apr | May | Jun | Jul | Aug | Sep | Oct | Nov | Dec | Ann. |
|---|---|---|---|---|---|---|---|---|---|---|---|---|
| -9.8 | -10.1 | -6.1 | 1.3 | 1.3 | 19.0 | 16.3 | 14.3 | 9.4 | 3.4 | -2.1 | -6.6 | 2.5 |
| Precipitation [mm]*2 | ||||||||||||
| 35 | 29 | 29 | 34 | 42 | 50 | 65 | 69 | 66 | 62 | 43 | 43 | 567 |
| *1 Petrozavodsk. *2 Shvets P.D. | ||||||||||||
- Number of hours of bright sunshine (Petrozavodsk): 1,719 hr yr-1.
- Solar radiation: 4.21 MJ m-2 day-1.
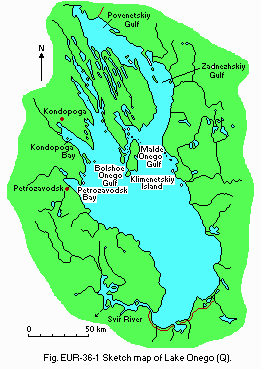
Sketch map of the lake (Q).
- Water temperature [deg C]
| 1972-1984 | |||||||||
| Depth [m] | Jan-Feb-Mar-Apr | May | Jun | Jul | Aug | Sep | Oct | Nov | Dec |
|---|---|---|---|---|---|---|---|---|---|
| 0.5 | Ice cover | 2.7 | 8.9 | 15.2 | 12.5 | 11.5 | 7.2 | 3.5 | 0.8 |
- Freezing period (Tichomirov, 1948-1967): 18 January-18 May.
- Mixing type: Dimictic.
- Notes on water mixing and thermocline formation
Thermal bar disappears at the end of June. Hydrological summer is 65-70 days. Maximum heating in August. Epilimnion about 20-30 m deep. Temperature in metalimnion is around 10deg C, hypolimnion 4-5deg C. Autumn thermal bar is observed in November.
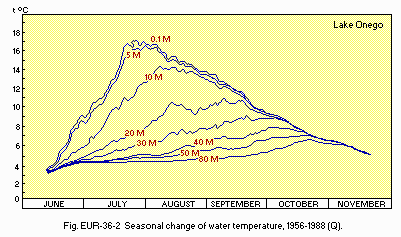
Seasonal change of water temperature, 1956-1988 (Q).
E. LAKE WATER QUALITY (Q)
E1 TRANSPARENCY [m]| Lake centre, 1989 | |||||||||
| Depth [m] | Jan-Feb-Mar-Apr | May | Jun | Jul | Aug | Sep | Oct | Nov | Dec |
|---|---|---|---|---|---|---|---|---|---|
| Ice cover | 3.5 | 3.7 | 3.5 | 3.5 | 3.5 | 3.5 | 3.5 | 3.7 | |
| Lake centre, 1989 | ||||||||||||
| Depth [m] | Jan | Feb | Mar | Apr | May | Jun | Jul | Aug | Sep | Oct | Nov | Dec |
|---|---|---|---|---|---|---|---|---|---|---|---|---|
| S*1 | - | - | - | - | 7.4 | 7.4 | 7.8 | 7.7 | 7.5 | 7.5 | - | - |
| 5.0 | - | - | - | - | 7.4 | 7.4 | 7.8 | 7.8 | 7.6 | 7.5 | - | - |
| 10.0 | - | - | - | - | 7.4 | 7.4 | 7.7 | 7.6 | 7.5 | 7.5 | - | - |
| 20.0 | - | - | - | - | 7.4 | 7.4 | 7.4 | 7.4 | 7.4 | 7.4 | - | - |
| 40.0 | - | - | - | - | 7.4 | 7.4 | 7.4 | 7.4 | 7.4 | 7.4 | - | - |
| 80.0 | - | - | - | - | 7.4 | 7.4 | 7.4 | 7.4 | 7.4 | 7.4 | - | - |
| B*2 | - | - | - | - | 7.4 | 7.4 | 7.4 | 7.4 | 7.3 | 7.3 | - | - |
| *1 Surface. *2 Bottom. | ||||||||||||
- 1966-1987: 0.2.
| Lake centre, 1989 | ||||||||||||
| Depth [m] | Jan | Feb | Mar | Apr | May | Jun | Jul | Aug | Sep | Oct | Nov | Dec |
|---|---|---|---|---|---|---|---|---|---|---|---|---|
| S*1 | - | - | - | - | 13.1 | 13.1 | 10.8 | 9.4 | 10.5 | - | - | - |
| 5.0 | - | - | - | - | 13.1 | 13.2 | 10.5 | 9.3 | 10.4 | - | - | - |
| 10.0 | - | - | - | - | 13.0 | 13.0 | 10.7 | 9.2 | 10.3 | - | - | - |
| 20.0 | - | - | - | - | 13.2 | 12.5 | 11.8 | 9.2 | 11.0 | - | - | - |
| 40.0 | - | - | - | - | 13.2 | 12.8 | 12.2 | 12.5 | 11.4 | - | - | - |
| 80.0 | - | - | - | - | 13.1 | 13.1 | 12.0 | 12.6 | 11.6 | - | - | - |
| B*2 | - | - | - | - | 13.2 | 12.9 | 12.0 | 12.8 | 12.0 | - | - | - |
| *1 Surface. *2 Bottom. | ||||||||||||
- Determined by KMnO4 method: 7.1.
- Determined by K2Cr2O7 method: 14.7.
| Lake centre, 1989 | ||||||||||||
| Depth [m] | Jan | Feb | Mar | Apr | May | Jun | Jul | Aug | Sep | Oct | Nov | Dec |
|---|---|---|---|---|---|---|---|---|---|---|---|---|
| S* | - | - | - | - | 0.8 | 1.4 | 5.8 | 5.2 | - | - | - | - |
| 5.0 | - | - | - | - | - | 1.2 | 3.8 | 4.5 | - | - | - | - |
| 10.0 | - | - | - | - | - | 1.0 | 3.2 | 2.6 | - | - | - | - |
| * Surface. | ||||||||||||
- Total-N [mg l-1]
| Lake centre, 1989 | ||||||||||||
| Depth [m] | Jan | Feb | Mar | Apr | May | Jun | Jul | Aug | Sep | Oct | Nov | Dec |
|---|---|---|---|---|---|---|---|---|---|---|---|---|
| S*1 | - | - | - | - | 0.45 | 0.60 | 0.85 | 0.49 | 0.45 | - | - | - |
| 5.0 | - | - | - | - | 0.41 | 0.62 | 0.66 | 0.51 | 0.58 | - | - | - |
| 10.0 | - | - | - | - | 0.45 | 0.60 | 0.50 | 0.49 | 0.54 | - | - | - |
| 20.0 | - | - | - | - | 0.44 | 0.70 | 0.50 | 0.49 | 0.65 | - | - | - |
| 40.0 | - | - | - | - | 0.48 | 0.76 | 0.50 | 0.56 | 0.68 | - | - | - |
| 80.0 | - | - | - | - | 0.36 | 0.80 | 0.70 | 0.51 | 0.65 | - | - | - |
| B*2 | - | - | - | - | 0.31 | 0.64 | 0.50 | 0.51 | 0.60 | - | - | - |
| *1 Surface. *2 Bottom. | ||||||||||||
- Total-P [micro g l-1]
| Lake centre, 1989 | ||||||||||||
| Depth [m] | Jan | Feb | Mar | Apr | May | Jun | Jul | Aug | Sep | Oct | Nov | Dec |
|---|---|---|---|---|---|---|---|---|---|---|---|---|
| S*1 | - | - | - | - | 8 | 6 | 7 | 10 | 7 | - | - | - |
| 5.0 | - | - | - | - | 9 | 7 | 7 | 10 | 6 | - | - | - |
| 10.0 | - | - | - | - | 9 | 7 | 7 | 7 | 5 | - | - | - |
| 20.0 | - | - | - | - | 10 | 7 | 6 | 5 | 6 | - | - | - |
| 40.0 | - | - | - | - | 5 | 6 | 8 | 6 | 6 | - | - | - |
| 80.0 | - | - | - | - | 5 | 6 | 8 | 6 | 6 | - | - | - |
| B*2 | - | - | - | - | 14 | 11 | 9 | 8 | 6 | - | - | - |
| *1 Surface. *2 Bottom. | ||||||||||||
F. BIOLOGICAL FEATURES (Q)
F1 FLORA- Emerged macrophytes
- Floating macrophytes: Nuphar lutea, Polygonum amphibium.
- Submerged macrophytes
- Phytoplankton
Phragmites australis, Scirpus lacustris, Equisetum fluviatile.
Potamogeton perfoliatus, P. luceus, P. praelongus, Batrachium eradicatum, B. gilibertii.
Spring: Melosira islandica subsp. helvetica, M. italica, M. distans var. alpigena, Asterionella formosa, Tabellaria fenestrata. Summer: Dinobryon divergens, D. bavaricum, Coelosphaerium kuettzingianum, Oscillatoria tenuis, Sphaerocystis schroeteri.
- Zooplankton
- Benthos
- Fish
- Supplementary notes on the biota
Spring: Strombidium viride, Lembadion lucens, Limnocalanus macrurus, Cyclops abissorum, Eudiaptomus gracilis, Kellicottia longispina. Summer: Vorticella anabaena, Tintinnopsis cratera, Limnocalanus macrurus, Cyclops abissorum, Diaptomus gracilis, Mesocyclops oithonoids, Daphnia cristata, Bosmina obtusirostris, Kellicottia longispina, Asplanchna priodonta.
Pontoporeia affinis, Pallasea quadrispinosa, Lampodrilus isoporus, Stylodrilus heringianus, Spirosperma ferax, Procladius sp., Trissocladius parataricus, Protanypus sp., Prodiamesa bathyla, Neopisidium conventus.
Coregonus albula, C. lavaretus, Osmerus eperlanus, Lucioperca lucioperca.
There are noteworthy relict species such as Pontoporeia affinis, Pallasea quadrispinosa, Mysis oculata var. relicta, Gammarocanthus lacustris and Lampodrilus isoporus.
| Lake centre, 1989 | ||||||||||||
| Gross production | ||||||||||||
| Jan | Feb | Mar | Apr | May | jun | Jul | Aug | Sep | Oct | Nov | Dec | Ann. |
|---|---|---|---|---|---|---|---|---|---|---|---|---|
| - | - | - | - | - | 17.6 | 40.3 | 52.8 | 79.9 | - | - | - | 7.6 |
- Macrophytes [g m-2]
| 1989 | |
| Phragmites | 220 |
| Scirpus | 187 |
| Equisetum fluviatile | 100 |
| Potamogeton natans | 142 |
| P. perfoliatus | 32 |
| Polygonum amphibium | 77 |
- Phytoplankton [g (fresh wt.) m-2]
| 1989 | ||||
| Regions | Jun | Jul | Aug | Sep |
|---|---|---|---|---|
| Bolshoje Onego Gulf | 34.7 | 12.5 | 5.7 | 4.7 |
| Petrozavodsk Bay | 42.0 | 4.0 | 12.0 | 4.5 |
| Kondopoga Bay | 114.8 | 8.9 | 4.3 | 22.3 |
- Bacterioplankton [g (fresh wt.) m-2]
| 1989 | ||||
| Regions | Jun | Jul | Aug | Sep |
|---|---|---|---|---|
| Bolshoje Onego Gulf | 65.8 | 61.2 | 60.2 | 106.7 |
| Petrozavodsk Bay | 28.2 | 29.5 | 33.1 | 52.8 |
| Kondopoga Bay | 61.5 | 91.4 | 52.1 | 119.4 |
- Protozoa [g (fresh wt.) m-2]
| 1989 | |||||
| Regions of the lake | Jun | Jul | Aug | SeP | Oct |
|---|---|---|---|---|---|
| Bolshoje Onego Gulf | 0.2 | 1.0 | 0.7 | 2.9 | 2.9 |
| Petrozavodsk Bay | 0.4 | 4.7 | 1.1 | 0.2 | 2.7 |
| Kondopoga Bay | 1.4 | 3.1 | 0.2 | 0.5 | 1.4 |
- Zooplankton [g (fresh wt.) m-2]
| 1989 | |||||
| Regions of the lake | Jun | Jul | Aug | Sep | Oct |
|---|---|---|---|---|---|
| Bolshoje Onego Gulf | 3.2 | 6.5 | 12.2 | 5.6 | 4.0 |
| Petrozavodsk Bay | 4.2 | 5.9 | 8.3 | 6.0 | 1.6 |
| Kondopoga Bay | 5.2 | 13.0 | 19.3 | 5.5 | 6.2 |
- Annual fish catch [metric tons]
1990: 2,100.
G. SOCIO-ECONOMIC CONDITIONS (Q)
G1 LAND USE IN THE CATCHMENT AREA| 1988 | ||
| Area [km2]* | [%] | |
|---|---|---|
| - Natural landscape | ||
| Woody vegetation | 36,800 | 71.6 |
| Herbaceous vegetation | 400 | 0.8 |
| Swamp | 9,800 | 19.1 |
| Others | 3,700 | 7.2 |
| - Agricultural land | ||
| Crop field | 300 | 0.6 |
| Pasture land | 200 | 0.4 |
| - Residential area | 200 | 0.4 |
| - Total | 51,400 | 100.0 |
| * Approximate. | ||
- Types of important forest: Spruce, pine, birch, aspen.
- Main kinds of crops: Potato, cabbage, carrot, perennial, herbs.
- Levels of fertilizer application on crop fields: Moderate.
- Trends of change in land use in recent years
Expansion of agricultural lands; reduction of forest felling.
| 1989 | |||
| Gross product during the year [US $] | No. of engaged persons | No. of establishments | |
|---|---|---|---|
| - Primary industry | - | 8,982 | 1,371 |
| Crop production | 13,632 | - | - |
| Animal husbandry | 61,792 | - | - |
| - Secondary and Tertiary industry | |||
| Timber and wood-working | 132,236 | 21,915 | 2,698 |
| Cellulose and paper | 127,418 | 5,281 | 713 |
| Building materials | 67,607 | 9,054 | 1,382 |
| Machine production | 180,817 | 20,352 | 4,981 |
- Number of domestic animals in the catchment area
Cattle 68,000, sheep 34,000, swine 54,000, poultry 1,908,000, goat 1,700, horse 900, mink 102,000, polar fox 3,400, fox 1,000.
| 1989 | |||
| Population | Population density [km-2] | Major cities (population) | |
|---|---|---|---|
| Urban | 305,000 | - | Petrozavodsk, |
| Rural | 194,000 | - | Kondopoga |
| Total | 499,000 | 9.7 | |
H. LAKE UTILIZATION (Q)
H1 LAKE UTILIZATION- Source of water, navigation and transportation (tonnage of cargo in
1989: 10 million tons), sightseeing and tourism (no. of visitors: 300,000
per year), recreation (sport-fishing, yachting) and fisheries.
| 1988 | |
| Use rate [mill. m3 yr-1] | |
|---|---|
| - Domestic | 26.9 |
| - Irrigation | |
| Agriculture | 0.2 |
| - Industrial | 27.0 |
| - Total | 54.1 |
I. DETERIORATION OF LAKE ENVIRONMENTS AND HAZARDS (Q)
I3 EUTROPHICATION- Nitrogen and phosphorus loadings to the lake [t yr-1]
| 1989 | |
| Sources | Total |
|---|---|
| T-N | 17,800 |
| T-P | 1,040 |
- Extent of damage: Detected but not serious.
J. WASTEWATER TREATMENTS (Q)
J1 GENERATION OF POLLUTANTS IN THE CATCHMENT AREA- c) Limited pollution with wastewater treatment.
| [%] | |
|---|---|
| - Non-point sources | 10 |
| - Point sources | |
| Municipal | 10 |
| Industrial | 80 |
| Fish farming | - |
| - Total | 100 |
- Percentage of municipal population in the catchment area provided with
- Percentage of rural population with adequate sanitary facilities (on-site
- Municipal wastewater treatment systems
- Industrial wastewater treatment systems
adequate sanitary facilities (on-site treatment systems) or public sewerage: 100%.
treatment systems): 60%.
No. of secondary treatment systems: 6. No. of primary treatment systems: 0. No. of other types: 0.
No. of industrial wastewater treatment systems: 11.
K. IMPROVEMENT WORKS IN THE LAKE (Q)
- None.
M. LEGISLATIVE AND INSTITUTIONAL MEASURES FOR UPGRADING LAKE ENVIRONMENTS (Q)
M1 NATIONAL AND LOCAL LAWS CONCERNED- Names of the laws (the year of legislation)
- Principles of Water Laws for the USSR (1971)
- RSFSR Water Code (1980)
- "Measures on ensuring of protection and rational utilization of water and other natural resources in the Basin of Lakes Ladoga, Onego and Ilmen", Council of Ministers of the USSR Decision (1984)
- Responsible authorities
- Local authorities
- State sanitary inspection
- State fish inspection
- State Committee of Environmental Protection
- State Committee of Hydrometeorology
- Main items of control
- Discharge of industrial and municipal sewage
- Non-point sources of contamination control
- Karelian Centre of the Academy of Science of the USSR, Petrozavodsk
- Northern State Research Institute for Fish Industry, Petrozavodsk
N. SOURCES OF DATA
- Questionnaire filled by Dr. N. N. Filatov, Water Problem Department, Karelian Centre of the Academy of Science of the USSR, Petrozavodsk, based on the following sources.
- Kauffman, Z. S. (ed.)(1990) The Ecosystem of the Onego Lake and the Trends of Its Changes (in Russian). 263 pp. Publ. House "Nauka", Leningrad.
