LOUGH NEAGH
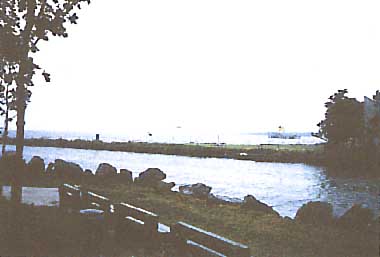
A view on the lakeshore at Antrim
Photo: A. Kurata
A. LOCATION
- Northern Ireland, UK.
- 54:36N, 6:30W; 15 m above sea level.
B. DESCRIPTION
-
The largest area of fresh water in the British Isles. Lough Neagh, is an eutrophic lake 385 km2 in area, mean depth 8.9 m, and is located centrally in the province of Northern Ireland. The lake is so shallow that the water remains always muddy due to wave and turbulent mixing by strong winds. The lake does not stratify in summer and very rarely freezes in winter. Transparency varies between 1.0-2.0 m due to the brown water and large phytoplankton crops which are dominated by blue-green algae and diatoms. It is an important eel and salmon fishery, provides the main water supply for the city of Belfast and the lake-bed is worked for sand and gravel (Q, 10).
C. PHYSICAL DIMENSIONS (Q)
| Surface area [km2] | 385 |
| Volume [km3] | 3.45 |
| Maximum depth [m] | 34 |
| Mean depth [m] | 8.9 |
| Water level | Regulated |
| Normal range of annual water level fluctuation [m] | 0.2 |
| Length of shoreline [km] | 125 |
| Residence time [yr] | 1.2 |
| Catchment area [km2] | 4,453 |
D. PHYSIOGRAPHIC FEATURES
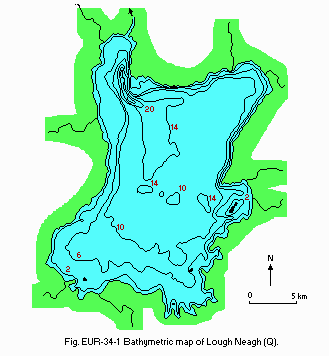
D1 GEOGRAPHICAL (1)- Bathymetric map: Fig. EUR-34-01.
- Names of main islands: None.
- Number of outflowing rivers and channels (name): 1 (Lower Bann).
- Climatic data at Aldergrove, 1975-1987
| Mean temp. [deg C] | ||||||||||||
| Jan | Feb | Mar | Apr | May | Jun | Jul | Aug | Sep | Oct | Nov | Dec | Ann. |
|---|---|---|---|---|---|---|---|---|---|---|---|---|
| 3.4 | 3.8 | 5.0 | 7.3 | 10.0 | 13.0 | 14.8 | 14.4 | 12.1 | 9.4 | 6.2 | 4.9 | 8.7 |
| Precipitation [mm] | ||||||||||||
| 91 | 51 | 76 | 46 | 56 | 59 | 59 | 76 | 94 | 91 | 77 | 87 | 863 |

Bathymetric map (Q).
- Water temperature [deg C](1)
| Centre, 1975-1987 | ||||||||||||
| Depth [m] | Jan | Feb | Mar | Apr | May | Jun | Jul | Aug | Sep | Oct | Nov | Dec |
|---|---|---|---|---|---|---|---|---|---|---|---|---|
| 0 | 3.8 | 3.5 | 4.9 | 7.5 | 11.4 | 14.7 | 16.4 | 16.6 | 14.4 | 11.3 | 7.7 | 5.6 |
| 10 | 3.8 | 3.5 | 4.9 | 7.2 | 10.8 | 13.8 | 15.9 | 16.4 | 14.3 | 11.3 | 7.7 | 5.6 |
- Freezing period: None.
- Mixing type: Unstratified.
- Notes on water mixing and thermocline formation
No stable thermocline due to shallow depth.
E. LAKE WATER QUALITY
E1 TRANSPARENCY [m](1)| Centre, 1975-1987 | ||||||||||||
| Depth [m] | Jan | Feb | Mar | Apr | May | Jun | Jul | Aug | Sep | Oct | Nov | Dec |
|---|---|---|---|---|---|---|---|---|---|---|---|---|
| 1.5 | 1.4 | 1.2 | 1.0 | 0.8 | 0.8 | 0.9 | 0.9 | 1.0 | 1.0 | 1.3 | 1.5 | |
| Centre, 1975-1987 | ||||||||||||
| Depth [m] | Jan | Feb | Mar | Apr | May | Jun | Jul | Aug | Sep | Oct | Nov | Dec |
|---|---|---|---|---|---|---|---|---|---|---|---|---|
| 0 | 8.1 | 8.1 | 8.3 | 8.7 | 8.9 | 8.8 | 8.5 | 8.2 | 8.1 | 8.1 | 8.0 | 8.0 |
| Centre, 1975-1987 | ||||||||||||
| Depth [m] | Jan | Feb | Mar | Apr | May | Jun | Jul | Aug | Sep | Oct | Nov | Dec |
|---|---|---|---|---|---|---|---|---|---|---|---|---|
| 0 | 6.05 | 6.51 | 9.72 | 11.89 | 11.64 | 11.15 | 9.39 | 7.64 | 7.60 | 6.87 | 6.10 | 5.27 |
| Centre, 1975-1987 | ||||||||||||
| Depth [m] | Jan | Feb | Mar | Apr | May | Jun | Jul | Aug | Sep | Oct | Nov | Dec |
|---|---|---|---|---|---|---|---|---|---|---|---|---|
| 0 | 12.8 | 13.1 | 13.0 | 12.9 | 11.6 | 10.8 | 9.5 | 9.1 | 10.0 | 10.2 | 11.7 | 12.1 |
| 10 | 12.8 | 13.1 | 12.8 | 12.4 | 10.6 | 9.6 | 8.4 | 8.5 | 9.8 | 10.5 | 11.7 | 21.1 |
| Centre, 1975-1987 | ||||||||||||
| Depth [m] | Jan | Feb | Mar | Apr | May | Jun | Jul | Aug | Sep | Oct | Nov | Dec |
|---|---|---|---|---|---|---|---|---|---|---|---|---|
| 0 | 23.2 | 27.3 | 49.4 | 72.7 | 76.8 | 70.6 | 54.6 | 48.4 | 50.6 | 48.5 | 34.6 | 26.6 |
- Total Kjeldahl-N+ NO3-N [mg l-1]
| Centre, 1975-1989 | ||||||||||||
| Depth [m] | Jan | Feb | Mar | Apr | May | Jun | Jul | Aug | Sep | Oct | Nov | Dec |
|---|---|---|---|---|---|---|---|---|---|---|---|---|
| 0 | 1.66 | 2.38 | 2.31 | 2.20 | 2.15 | 2.21 | 2.33 | 2.28 | 2.26 | 2.19 | 2.31 | 2.38 |
- Total-P [mg l-1]
| Centre, 1975-1987 | ||||||||||||
| Depth [m] | Jan | Feb | Mar | Apr | May | Jun | Jul | Aug | Sep | Oct | Nov | Dec |
|---|---|---|---|---|---|---|---|---|---|---|---|---|
| 0 | 0.109 | 0.107 | 0.104 | 0.092 | 0.079 | 0.077 | 0.107 | 0.130 | 0.129 | 0.123 | 0.119 | 0.116 |
F. BIOLOGICAL FEATURES
F1 FLORA- Emerged macrophytes (2)
Phragmites australis, Eleocharis palustris, Sparganium vectum, Carex rostrata, Typha latifolia, Equisetum fluviatile, Schoenoplectus lacustris, Butomus umbellatus, Sagittaria sagittifolia. - Floating macrophytes: Lemna minor, L. polyrhiza, Polygonum amphibium (2).
- Submerged macrophytes (2)
Potamogeton pusillus, P. filiformis, P. pectinatus, Zannichellia palustris, Callitriche hermaphrodirica, Myriophyllum spicatum, Chara sp., Elodea canadensis. - Phytoplankton (1)
Spring Melosira italica subarctica and Stephanodiscus astraea, then Oscillatoria redekei. Summer and autumn: Oscillatoria agardhii.
- Zooplankton
Cyclops strenuus, C. abyssorum, Diaptomus gracilis, abundant rotifers (Polyarthra dolichopteca, Keratella cochlearis )(1). - Benthos (1, 3)
0.5 m, Sticrochironomus; 0.5-3.0 m, Glyptotendipes paripes (abundant); 3.0-5.0 m, Asellus aquaticus, Gammarus; 10-20 m, Chironomus plumosus, C. anthracinus; deep water, Mysis relicta (common but a glacial relict of much interest). - Fish (4)
Anguilla anguilla*, Salmo trutta*, S. salar*, Coregonus pollan*, Perca fluviatilis*, Rutilus rutilus (recent introduction). * Economically important. - Supplementary notes on the biota (5)
Waterfowl: internationally important site for wintering wildfowl, notably Cygnus cygnus, Aythya ferina, A. fuligula, A. marila, Bucephala clangula.

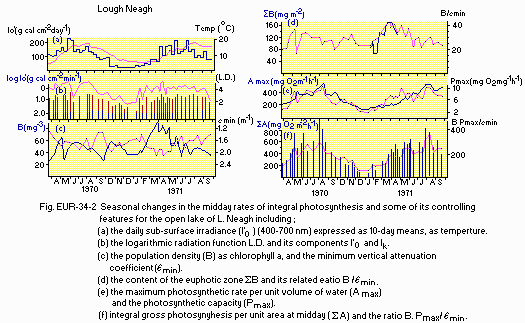
Seasonal changes in the midday rates of integral photosynthesis and some of its controlling features for the open lake of L. Neagh including;
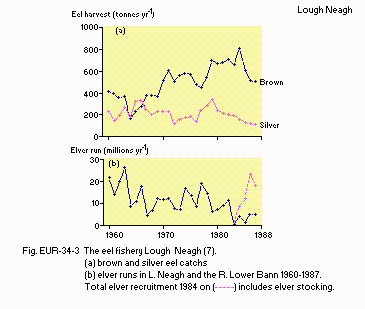
F5 FISHERY PRODUCTS (7)
- Annual fish* catch [metric tons]
1984: 900. 1987: 620. * eels (Anguilla anguilla).

The eel fishery in Lough Neagh.
F7 NOTES ON THE REMARKABLE CHANGES OF BIOTA IN THE LAKE IN RECENT YEARS
-
a) Introduction of Rutilus rutilus ca. 1976; explosive population increase,
followed by significant decline due to Ligula infestation (4, 8).
b) Overfishing of Perca fluviatilis since 1980 (4).
c) Reduction in blue-green algae following PO4 reduction (SRP has declined from 0.063 mg-1-1 in 1981 to 0.036 mg l-1 in 1987)(1, 4).
G. SOCIO-ECONOMIC CONDITIONS
G1 LAND USE IN THE CATCHMENT AREA| 1979 | ||
| Area[km2] | [%] | |
|---|---|---|
| - Natural landscape | ||
| Woody vegetation | 205 | 4.6 |
| - Agricultural land | ||
| Arable | 292 | 6.5 |
| Grassland | 3,084 | 69.3 |
| Rough grazing | 792 | 17.8 |
| - Others | 80 | 1.8 |
| - Total | 4,453 | 100 |
| Gross product per year [mill. pond] | |
|---|---|
| - Primary industry | |
| Fisheries | 4.5 |
| 1986 | |||
| Population | Population density [km-2] | Major cities (population) | |
|---|---|---|---|
| Urban | 228,197* | - | - |
| Rural | 145,013 | - | None |
| Total | 373,210 | 83.8 | - |
| * Urban = connected to major sewage works. | |||
H. LAKE UTILIZATION
H1 LAKE UTILIZATION (4)-
Source of water, recreation (yachting) and fisheries.
| Use rate [mega-litres day-1] | |
|---|---|
| Domestic | 168.1 |
| Irrigation | None |
| Industrial | None |
| Power plant | None |
I. DETERIORATION OF LAKE ENVIRONMENTS AND HAZARDS
I1 ENHANCED SILTATION (Q)- Extent of damage: None.
- Present status: None.
- Nuisance caused by eutrophication
Unusual algal bloom (dominant species of algae; Oscillatoria agardhii), disturbed filtration in cleaning beds, and depletion of oxygen near mud. - Nitrogen and phosphorus loadings to the lake [t yr-1](1)
| 1985 | |||
| Sources | Industrial & Domestic | Agricultural & Natural | Total |
|---|---|---|---|
| T-N | 800 | 6,038 | 6,838 |
| T-P | 153 | 103 | 256 |
- Supplementary notes (1)
Eutrophication accelerated since 1950 onwards. However, phosphorus reduction was implemented at nine major sewage works between 1981-1984, resulting in 70% reduction in P in their effluent, i. e. removing 80 tons P per year. SRP concentration and phytoplankton crops have declined pro rata.
- Extent of damage: None.
J. WASTEWATER TREATMENTS
J1 GENERATION OF POLLUTANTS IN THE CATCHMENT AREA-
d) Measurable pollution with limited wastewater treatment.
- Soluble reactive phosphorus
| [%] | |
|---|---|
| - Non-point sources (agricultural, natural and dispersed settlements) | 40 |
| - Point sources | |
| Municipal | 54 |
| Industrial (creameries) | 6 |
| - Total | 100 |
- Percentage of municipal population in the catchment area provided with
adequate sanitary facilities (on-site treatment systems) or public sewerage: 82%. - Percentage of rural population with adequate sanitary facilities (on-site
treatment systems): 16%. - Municipal wastewater treatment systems
No. of tertiary treatment systems: 10. No. of secondary treatment systems: 250. No. of primary treatment systems: 0. - Industrial wastewater treatment systems
No. of industrial wastewater treatment systems: 25.
K. IMPROVEMENT WORKS IN THE LAKE (Q)
-
None in the lake.
L. DEVELOPMENT PLANS (9)
-
Phosphorus reduction was installed at 10 major sewage treatment works within
the L. Neagh catchment in the early 1980's, by the Department of Environment
for Northern Ireland to reduce nutrient input to the lake and thereby combat
eutrophication. Cost of installation E233,000 (1983 prices); running costs E
270,000 (1988/89 prices).
M. LEGISLATIVE AND INSTITUTIONAL MEASURES FOR UPGRADING LAKE ENVIRONMENTS
M1 NATIONAL AND LOCAL LAWS CONCERNED (9)- Names of the laws (the year of legislation)
- Lough Neagh and Lower Bann Drainage and Navigation Act (N. I.)(1955)
- Water Act (N. I.)(1972)
- Fisheries Act (N. I.)(1966) as amended (plus byelaws and regulation made thereunder)
- Responsible authorities
- Department of Finance, (N. I.)/Department of Agriculture (N. I.)
- Department of the Environment for Northern Ireland
- Department of Agriculture (N. I.)/Fisheries Conservation Board for Northern Ireland
- Main items of control
- Drainage improvements and Lough level control
- Water management
- Conservation and protection of fish stock
- Freshwater Biological Investigation Unit, Muckamore, Northern Ireland
- University of Ulster Freshwater Laboratory, Ballyronan, Northern Ireland
- Department of the Environment for Northern Ireland, Environmental Protection Division, Belfast, Northern Ireland* * Environmental Protection Division (DOE (N. I.)) replaced the water pollution control branch of that department (established in 1973) in 1986.
- Freshwater Biological Investigation Unit, Muckamore, N. Ireland
- University of Ulster Freshwater Laboratory, Ballyronan, Londonderry
N. SOURCES OF DATA
- Questionnaire filled by Dr. P. Raven, HSO Nature Conservation, Dept. of Environment for Northern Ireland, Countryside & Wildlife Branch, Belfast, U. K.
- Information provided by Freshwater Biological Investigation Unit, Muckamore, Antrim, N. Ireland.
- Harron J (1986) Flora of Lough Neagh. 270 pp. Irish Naturalist's Journal Committee & University of Ulster, Coleraine.
- Carter, C. E. (1978) The fauna of the muddy sediments of Lough Neagh, with particular reference of eutrophication. Freshwater Biology, 8: 547 559.
- Wood, R. B. & Smith, R. V. (1986) Lough Neagh: 100 years of man's influence on the water quality of a major inland fishery. "Proceedings, Institute of Fisheries Management, 17th Annual Study Course, University of Ulster, Coleraine", pp. 111-126.
- Salmon, D. G., Prys-Jones, R. P. & Kirby, J. S. (1988) Wildfowl and Wader Counts 1987-1988; The Results of the National Wildfowl Counts and Birds of Estuaries Enquiry in the United Kingdom. 63 pp. Wildfowl Trust, Slimbridge, Glos.
- Jewson, D. J. (1976) The interaction of components controlling net phytoplankton photosynthesis in a well-mixed lake (L. Neagh, N. I.). Freshwater Biology, 6: 551-576.
- Wood, R. B. (1989) Lough Neagh: Managing to stay Resourceful. Went Memorial Lecture. Royal Dublin Society (in press).
- Tobin, C. (1986) A record of Ligula intestinalis (L.)(Cestoda) from roach (Rutilus rutilus (L.)) in Lough Neagh. Irish Naturalist Journal, 22: 78.
- Information provided by Environmental Protection Division, Department of the Environment for Northern Ireland, Belfast, U. K.
- Editor's observation.


