BODENSEE (LAKE CONSTANCE)
A westward view from the top of Mt. Pfander(1,064m)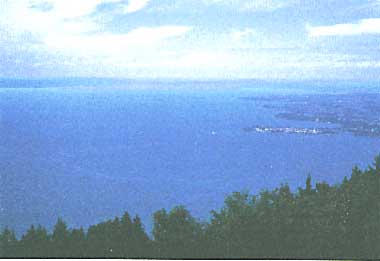
Photo: A. Kurata
A. LOCATION
- Baden-Wurttemberg and Bayern, West Germany;* Thurgau and St. Gallen,
Switzerland; and Vorarlberg, Austria. - 47:29-47:49N, 9:01-9:45E; 400 m above sea level.
* Place names are not updated.
B. DESCRIPTION
-
Lake Constance is the second largest (to Lake Geneva) European pre-alpine lake both by area and volume, and the largest lake in Germany. The lake is surrounded by the provinces of Baden.Wurttemberg and Bayern of West Germany in the northern and north-eastern coast and by the territory of Switzerland and Austria in the southern coast. The lake is divided into two parts, the deep "upper lake" and the shallow "lower lake". The Rhein River originated from the Alps flows into the lake at its southeast end and flows out from the west end of the lake. The lake plays a major role as a natural reservoir to make clear the milky turbid inflowing water derived from the glaciers.
The lake basin was formed by the erosive forces of the Rhine glacier which excavated a 500 m deep valley during its last extension, about 30,000 years before the present. At the end of this glaciation, 15,000 years ago, the lake area was more than twice its present cover, including large parts of the Rhine Valley and both Lake Walen and Lake Zurich. The catchment area is 20 times the lake area, reaching to the Alpine rift in Switzerland, Austria and Italy. The annual water budget is about 12 km3, resulting in a water residence time of 4 to 5 years. The main tributary is the Alpenrhein contributing 75% of the total inflow. Both water budget and lake level reflect the seasonality of the Alps which retain snow during the winter. The lake level is therefore maximum in early summer and minimum during the winter.
In its natural state, Lake Constance was a typical oligotrophic pre-alpine lake with low concentrations of nutrients, low densities of phytoplankton, high water transparency and high hypolimnic oxygen concentrations. With an increase in human population and fundamental changes in the economy and human social behaviour, the trophic state of the lake was changed over the past four decades. At present, the 1.5 million people living in the catchment area, local industry and agriculture together discharge sewage water equivalent to 3.2 million inhabitants. Until the early 1970's, the major part of this sewage entered the lake without any treatment, resulting in a strong increase of the P-load, additionally enhanced by increasing inputs from agricultural sources and from precipitation. At present, 75% of the sewage phosphorus is chemically precipitated in treatment plants. Further reduction of the P-load is expected after completion of the sewage purification programme in large treatment plants. Depending on the remaining P-load, new lower equilibrium concentrations will be reached in the lake. Thus, this provides an example of a successful restoration programme beyond national borders (Q, 1).
C. PHYSICAL DIMENSIONS (Q, 1)
| Basin | Lower Lake | Upper Lake | Total |
|---|---|---|---|
| Surface area [km2] | 63 | 476 | 539 |
| Volume [km3] | 0.83 | 47.7 | 48.53 |
| Maximum depth [m] | 46 | 252 | - |
| Water level | - | - | Unregulated |
| Normal range of annual water level fluctuation [m] | - | - | 2 |
| Length of shoreline [km] | 90 | 165 | 255 |
| Residence time [yr] | - | - | 4.5 |
| Catchment area [km2] | - | - | 10,900 |
D. PHYSIOGRAPHIC FEATURES
D1 GEOGRAPHICAL (Q, 1, 2)- Sketch map: Fig. EUR-33-01.
- Bathymetric map: Fig. EUR-33-02.
- Names of main islands
Reichenau (4 km2), Mainau (0.44 km2) and Lindau (0.41 km2). - Number of outflowing rivers and channels (name): 1 (Rhein R.).
- Climatic data at Friedrichshafen, 1931-1980
| Mean temp. [deg C] | ||||||||||||
| Jan | Feb | Mar | Apr | May | Jun | Jul | Aug | Sep | Oct | Nov | Dec | Ann. |
|---|---|---|---|---|---|---|---|---|---|---|---|---|
| -1.0 | 0.2 | 4.1 | 8.6 | 13.2 | 16.7 | 18.4 | 17.6 | 14.3 | 8.9 | 4.2 | 0.5 | 8.8 |
| Precipitation [mm] | ||||||||||||
| 63 | 56 | 53 | 60 | 95 | 112 | 137 | 113 | 93 | 65 | 59 | 54 | 960 |
- Number of hours of bright sunshine: 1,756 hr yr-1.
- Solar radiation: 9.86 MJ m-2 day-1.
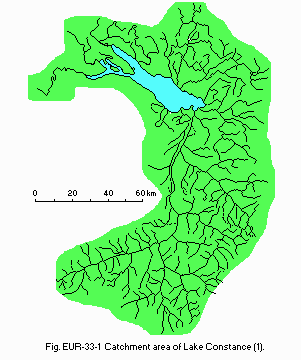
Catchment area (1).
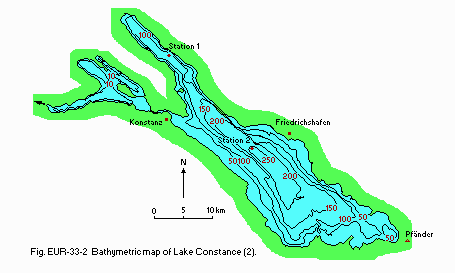
Bathymetric map (2).
- Water temperature [deg C](Q)
| Station 1, 1986 | |||||||||||||
| Depth [m] | Jan | Feb | Mar | Apr | May | Jun | Jul | Aug | Sep | Oct | Nov | Dec | Ann. |
|---|---|---|---|---|---|---|---|---|---|---|---|---|---|
| 0.4 | 4.3 | - | 3.2 | 5.0 | 14.8 | 16.1 | 19.7 | 22.0 | 16.5 | 13.4 | 9.2 | 7.4 | 12.0 |
| 10 | 4.3 | - | 3.1 | 4.6 | 8.4 | 10.1 | 11.3 | 11.5 | 14.8 | 12.1 | 9.2 | 7.4 | 8.8 |
| 50 | 4.3 | - | 3.7 | 4.1 | 4.6 | 4.6 | 4.5 | 4.4 | 4.7 | 4.6 | 5.2 | 5.6 | 4.6 |
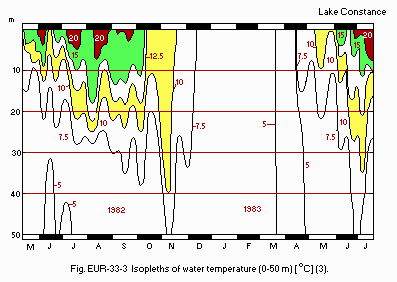
Isopleths of water temperature (0-50 m)[deg C](3).
- Freezing period: None.
- Mixing type: Warm monomictic.
- Notes on water mixing and thermocline formation
The lake is the only warm-monomictic lake of continental Europe north of the alpine chain, with its holomixis in late February or March, at a temperature of 4deg C. During the summer the maximum temperature may reach 22 to 23deg C. The water temperatures follow air temperatures with a delay of about one month.
E. LAKE WATER QUALITY
E1 TRANSPARENCY [m](Q)| Station 1, 1986 | |||||||||||||
| Depth [m] | Jan | Feb | Mar | Apr | May | Jun | Jul | Aug | Sep | Oct | Nov | Dec | Ann. |
|---|---|---|---|---|---|---|---|---|---|---|---|---|---|
| 15.2 | 11.3 | 9.7 | 9.2 | 2.8 | 8.0 | 7.1 | 3.8 | 5.1 | 8.0 | 10.8 | 12.0 | 8.6 | |
| Station 1, 1986 | |||||||||||||
| Depth [m] | Jan | Feb | Mar | Apr | May | Jun | Jul | Aug | Sep | Oct | Nov | Dec | Ann. |
|---|---|---|---|---|---|---|---|---|---|---|---|---|---|
| 0 | 8.10 | 8.10 | 7.97 | 8.14 | 8.79 | 8.37 | 8.60 | 8.41 | 8.57 | 8.43 | 8.23 | 8.19 | 8.33 |
| 10 | 8.09 | 8.10 | 8.15 | 8.24 | 8.43 | 8.27 | 8.37 | 8.22 | 8.48 | 8.33 | 8.32 | 8.21 | 8.27 |
| 50 | - | 8.12 | 8.08 | 8.24 | 8.17 | 8.11 | 8.02 | 7.77 | 7.84 | 8.07 | 8.07 | 8.06 | 8.05 |
| 100 | - | 8.08 | 8.00 | 8.20 | 8.10 | 8.07 | 7.99 | 7.70 | 7.91 | 8.06 | 8.04 | 8.02 | 8.02 |
| 140 | - | 8.02 | 7.97 | 8.16 | 8.06 | 8.01 | 7.88 | 7.64 | 7.81 | 7.98 | 7.99 | 7.90 | 7.95 |
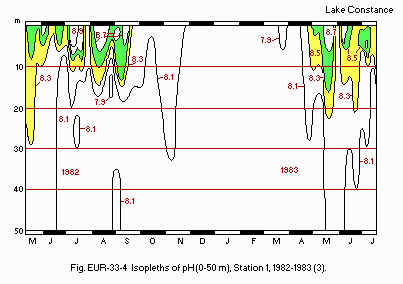
Isopleths of pH (0-50 m), Station 1, 1982-1983 (3).
E3 SS [mg l-1](Q)
| Station 1, 1986 | |||||||||||||
| Depth [m] | Jan | Feb | Mar | Apr | May | Jun | Jul | Aug | Sep | Oct | Nov | Dec | Ann. |
|---|---|---|---|---|---|---|---|---|---|---|---|---|---|
| 0 | 0.41 | 0.60 | 1.01 | 1.12 | 4.87 | 0.84 | 1.31 | 1.93 | 1.46 | 1.10 | 0.97 | - | 1.42 |
| 10 | 0.50 | 0.44 | 0.59 | 0.85 | 2.15 | 0.91 | 1.31 | 1.75 | 1.26 | 0.81 | 0.94 | - | 1.05 |
| 50 | 0.53 | 0.38 | 0.32 | 0.60 | 0.87 | 0.51 | 0.51 | 0.39 | 0.32 | 0.40 | 0.58 | - | 0.49 |
| 100 | 0.66 | 0.46 | 0.34 | 0.90 | 0.92 | 0.60 | 0.50 | 0.42 | 0.32 | 0.41 | 0.43 | - | 0.54 |
| 140 | 0.75 | 0.64 | 0.51 | 1.00 | 1.25 | 0.71 | 0.63 | 0.66 | 0.41 | 0.64 | 0.50 | - | 0.70 |
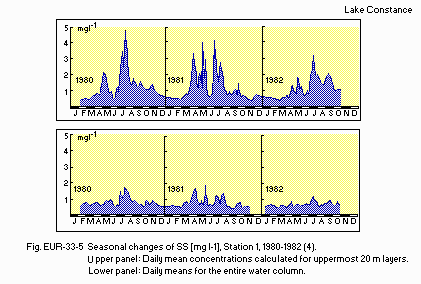
Seasonal changes of SS [mg l-1], Station 1, 1980-1982 (4). Upper panel: Daily mean concentrations calculated for the uppermost 20 m layers. Lower panel: Daily means for the entire water column.
E4 DO [mg l-1](Q)
| Station 1, 1986 | |||||||||||||
| Depth [m] | Jan | Feb | Mar | Apr | May | Jun | Jul | Aug | Sep | Oct | Nov | Dec | Ann. |
|---|---|---|---|---|---|---|---|---|---|---|---|---|---|
| 142 | - | - | - | 9.54 | 9.69 | 9.78 | 8.48 | 7.86 | 8.00 | 7.17 | 8.15 | 7.38 | 8.45 |
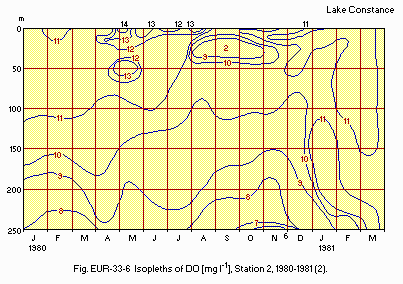
Isopleths of DO [mg l-1], Station 2, 1980-1981 (2).
E5 DOC [mg l-1](Q)
| Station 1, 1979 | ||||||||||||
| Depth [m] | Jan | Feb | Mar | Apr | May | Jun | Jul | Aug | Sep | Oct | Nov | Dec |
|---|---|---|---|---|---|---|---|---|---|---|---|---|
| 1 | 1.2 | 1.1 | 1.2 | - | 1.2 | 1.1 | 1.2 | 1.2 | 1.2 | 1.2 | 1.2 | 1.2 |
| Station 1, 1986 | |||||||||||||
| Depth [m] | Jan | Feb | Mar | Apr | May | Jun | Jul | Aug | Sep | Oct | Nov | Dec | Ann. |
|---|---|---|---|---|---|---|---|---|---|---|---|---|---|
| 0 | 0.47 | 2.94 | 3.54 | 3.64 | 24.87 | 3.16 | 4.62 | 6.74 | 8.42 | 4.03 | 4.61 | 1.64 | 5.72 |
| 10 | 0.40 | 1.83 | 3.48 | 3.22 | 11.44 | 2.50 | 8.01 | 7.81 | 5.73 | 3.35 | 4.79 | 1.74 | 4.53 |
| 50 | 0.40 | 0.24 | 0.21 | 1.34 | 1.40 | 0.41 | 0.27 | 0.33 | 0.28 | 0.11 | 0.94 | 0.52 | 0.54 |
| 100 | 0.38 | 0.24 | 0.10 | 0.89 | 1.37 | 0.57 | 0.30 | 0.29 | 0.15 | 0.07 | 0.37 | 0.17 | 0.41 |
| 140 | 0.19 | 0.28 | 0.23 | 0.86 | 1.15 | 0.69 | 0.33 | 0.21 | 0.16 | 0.07 | 0.37 | 0.21 | 0.40 |
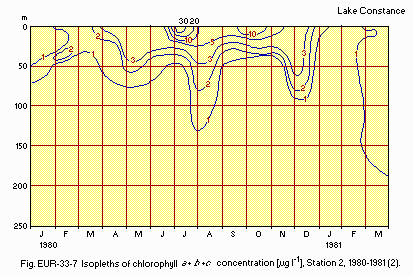
Isopleths of chlorophyll a + b + c concentration [micro g l-1], Station 2, 1980 -1981 (2).
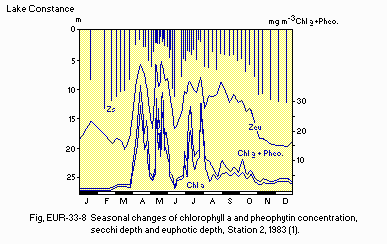
Seasonal changes of chlorophyll a and pheophytin concentration, secchi depth and euphotic depth, Station 2, 1983 (1).
E7 NITROGEN CONCENTRATION
- NH4-N: Fig. EUR-33-09.
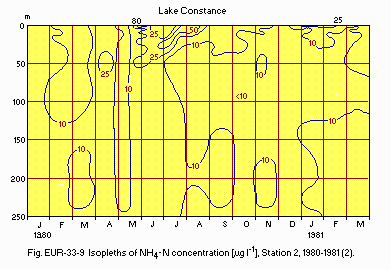
Isopleths of NH4-N concentration [micro g l-1], Station 2, 1980-1981 (2).
- NO2-N: Fig. EUR-33-10.
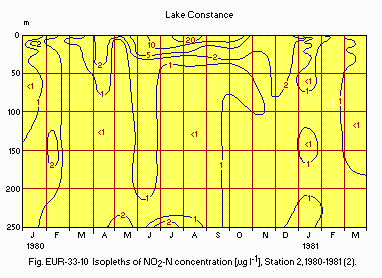
Isopleths of NO2-N concentration [micro g l-1], Station 2, 1980-1981 (2).
- NO3-N [mg l-1](Q)
| Station 1, 1986 | |||||||||||||
| Depth [m] | Jan | Feb | Mar | Apr | May | Jun | Jul | Aug | Sep | Oct | Nov | Dec | Ann. |
|---|---|---|---|---|---|---|---|---|---|---|---|---|---|
| 0 | .423 | .493 | .481 | .420 | .313 | .294 | .409 | .354 | .175 | .301 | - | - | .366 |
| 10 | .453 | .570 | .561 | .480 | .467 | .349 | .555 | .489 | .257 | .377 | - | - | .456 |
| 50 | .378 | .598 | .639 | .505 | .467 | .430 | .684 | .648 | .447 | .517 | - | - | .531 |
| 100 | .364 | .591 | .635 | .523 | .544 | .433 | .702 | .656 | .484 | .563 | - | - | .550 |
| 140 | .369 | .612 | .640 | .546 | .551 | .443 | .710 | .655 | .474 | .541 | - | - | .554 |
- PO4-P [mg l-1](Q)
| Station 1, 1986 | |||||||||||||
| Depth [m] | Jan | Feb | Mar | Apr | May | Jun | Jul | Aug | Sep | Oct | Nov | Dec | Ann. |
|---|---|---|---|---|---|---|---|---|---|---|---|---|---|
| 0 | .067 | .057 | .063 | .069 | .011 | .031 | .009 | .006 | .008 | .006 | .005 | - | .030 |
| 10 | .064 | - | .062 | .074 | .043 | .029 | .014 | .003 | .006 | .009 | .006 | - | .031 |
| 50 | .063 | .055 | .066 | .075 | .091 | .070 | .063 | .063 | .052 | .072 | .053 | - | .066 |
| 100 | .066 | .062 | .073 | .079 | .104 | .078 | .079 | .070 | .065 | .088 | .064 | - | .075 |
| 140 | .076 | .068 | .084 | .091 | .124 | .089 | .106 | .094 | .083 | .129 | .086 | - | .094 |
- Particulate-P [micro g l-1]: Fig. EUR-33-11.
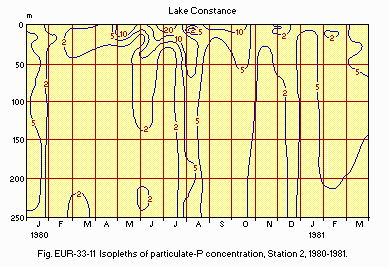
Isopleths of particulate-P concentration, Station 2, 1980-1981 (2).
E10 PAST TRENDS (2) Station 2, 1975-1980: Fig. EUR-33-12, 13 and 14.
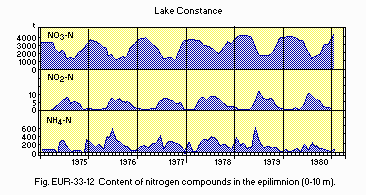
Content of nitrogen compounds in the epilimnion (0-10 m).
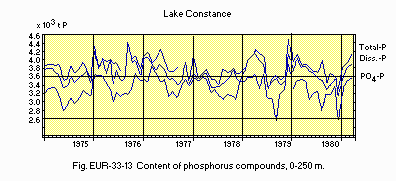
Content of phosphorus compounds, 0-250 m.
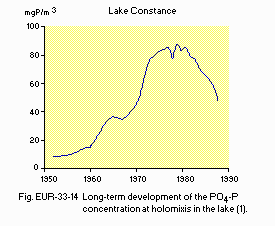
Long-term development of the PO4-P concentration at holomixis in the lake (1).
F. BIOLOGICAL FEATURES
F1 FLORA- Emerged macrophytes: Phragmites communis (Q).
- Submerged macrophytes (Q, 5)
Chara aspera, C. contraria, Zannichellia palustris, Potamogeton lucens, P. perfoliatus, P. pectinatus, P. pusillus. - Phytoplankton (Q, 1)
Cyclotella spp., Fragilaria crotonensis, Stephanodiscus hantzschii, S. astraea, S. binderanus, Asterionella formosa, Synedra sp., Tabellaria fenestrata, Rhodomonas minuta, Cryptomonas ovata, C. rostratiformis, Mougeotia thylespora, Ceratium hirundinella, Anabaena planctonica, Pandorina morum, Peridinium cinctum, Staurastrum cingulum, Aphanizomenon flos-aquae.
- Zooplankton (Q, 1)
Daphnia hyalina, D. galeata, Bosmina longispina, B. mixta kessleri, B. longirostris, Bythotrephes longimanus, Leptodora kindtii, Eudiaptomus gracilis, Acanthodiaptomus denticornis, Cyclops abyssorum, C. vicinus, Ascomorpha ecaudis, A. ovalis, Asplanchna priodonta, Conochilus unicornis, Gastropus stylifer, Kellicottia longispina, Keratella cochlearis, Lepadella patella, Notholca caudata, Pompholyx sulcata, Synchaeta pectinata, Trichocerca capucina. - Benthos (6, 7, 8)
Naididae (Vejdovskyella cf. intermedia, Amphichaeta leydigii), Tubificidae (Potamothrix moldaviensis, P. hammoniensis, Limnodrilus hoffmeisteri), Gastropoda (Potamopyragus jenkinsi). - Fish (Q, 1)
Salmo trutta, S. gairdneri, Thymallus thymallus, Salvelinus alpinus, Coregonus spp.* (lavaretus, etc.), Cyprinus carpio, Barbus barbus, Chondrostoma nasus, Phoxinus phoxinus, Leuciscus cephalus, L. leuciscus, Abramis brama, Blicca bjoerkna, Carassius carassius, Alburnus alburnus, Rutilus rutilus, Scardinius erythrophtalmus, Rhodeus sericeus, Tinca tinca, Perca fluviatilis*, Lota lota, Stizostedion lucioperca, Gobio gobio, Cottus gobio, Gasterosteus aculeatus, Anguilla anguilla, Esox lucius, Cobitis taenia, Silurus glanis. * Economically important. - Supplementary notes (1)
Species of the crustacean plankton community before and after eutrophication.
| Pre 1940s | 1950s-1980s |
|---|---|
| - Diaphanosoma brachyurum (-1957) | |
| Daphnia hyalina | Daphnia hyalina |
| D. galeata | |
| Bosmina longispina | Bosmina longispina |
| B. mixta kessleri | |
| B. longirostris | |
| Bythotrephes longimanus | Bythotrephes longimanus |
| Leptodora kindtii | Leptodora kindtii |
| - Heterocope borealis (-1963) | |
| Eudiaptomus gracilis | Eudiaptomus gracilis |
| Acanthodiaptomus denticornis | |
| Cyclops abyssorum | Cyclops abyssorum |
| C. vicinus |
| Station 1, 1982 | |||||||||||||
| Gross production | |||||||||||||
| Jan | Feb | Mar | Apr | May | Jun | Jul | Aug | Sep | Oct | Nov | Dec | Ann. | |
|---|---|---|---|---|---|---|---|---|---|---|---|---|---|
| - | .149 | .207 | .567 | 1.730 | .877 | 1.425 | 1.103 | .840 | .403 | .270 | .142 | .706 | |
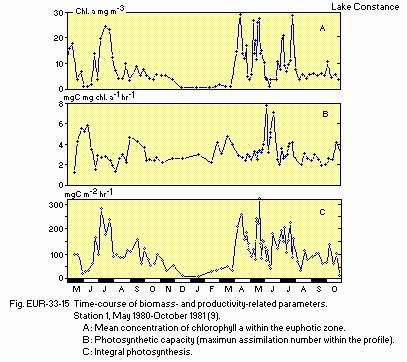
Time-course of biomass- and productivity-related parameters. Station 1, May 1980-October 1981 (9).
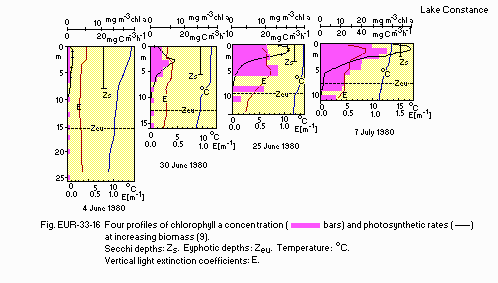
Four profiles of chlorophyll a concentration and photosynthetic rates at increasing biomass (9).
F4 BIOMASS: Fig. EUR-33-17 and 18.
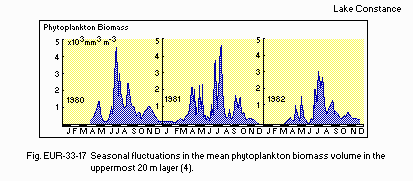
Seasonal fluctuations in the mean phytoplankton biomass volume in the uppermost 20 m layer (4).
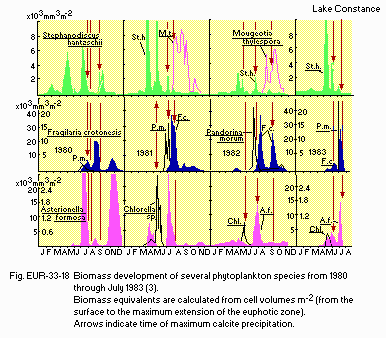
Biomass development of several phytoplankton species from 1980 through July 1983 (3).
F5 FISHERY PRODUCTS (Q)
- Annual fish catch [metric tons]
1972-1985: 1,280.
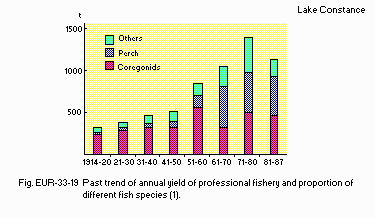
Past trend of annual yield of professional fishery and proportion of different fish species.
G. SOCIO-ECONOMIC CONDITIONS (Q)
G1 LAND USE IN THE CATCHMENT AREA 1986- Types of important forest vegetation: Deciduous broadleaf forest.
- Types of important herbaceous vegetation: Meadows.
- Main kinds of crops
Maize, wheat, barley, potato and fruits (apple, pear and grape).
- Main kinds of manufacturing
Machinery, food industries, textile, electric machinery, air-craft machinery and chemical industries.
| 1986 | |||
| Population | Population density [km-2] | Major cities (population) | |
|---|---|---|---|
| Total | ca.1,500,000 | ca. 138 | Konstanz, Rorschach, Bregenz, Lindau, Friedrichshafen |
H. LAKE UTILIZATION (Q)
H1 LAKE UTILIZATION-
Source of water, navigation and transportation, sight-seeing and tourism,
recreation (swimming, sport-fishing, yachting) and fisheries.
| 1986 | |
| Use rate [m3 sec-1] | |
|---|---|
| Domestic | 4.47 (for 4,000,000 persons) |
| Industrial | Nearly none |
I. DETERIORATION OF LAKE ENVIRONMENTS AND HAZARDS
I1 ENHANCED SILTATION (Q)- Extent of damage: Not serious.
- Nuisance caused by eutrophication: Unusual algal bloom.
- Nitrogen and phosphorus loadings to the lake (1)
| '65/'66 | '67/'68 | '71/'72 | '78/'79 | '85/'86 | |
|---|---|---|---|---|---|
| Run-off (km3) | 14.7 | 12.5 | 7.4 | 11.0 | 11.5 |
| SS in rivers (mill. t) | - | 4.7 | 1.1 | 2.6 | 2.6 |
| Phosphorus (1,000 t) | |||||
| Total | >3.1 | 3.9 | 2.1 | 3.0 | 2.3 |
| Without SS | - | ca. 1.1 | 1.3 | 1.1 | 0.6 |
| Nitrogen (1,000 t) | |||||
| Total | - | 16.6 | 12.0 | 19.2 | 21.0 |
| Without S | - | 13 | 10.4 | 14.5 | 18.0 |
- Extent of damage: None.
J. WASTEWATER TREATMENTS
J1 GENERATION OF POLLUTANTS IN THE CATCHMENT AREA (1)-
f) Measurable pollution with wastewater treatment.
| 1986 | |
| [%] | |
|---|---|
| - Non-point sources | 68 |
| Natural | |
| Agricultural | |
| - Point sources | 32 |
| Municipal | |
| Industrial | |
| - Total | 100 |
| * Regarding only phosphorus loading. | |
- Percentage of municipal population in the catchment area provided with
adequate sanitary facilities (on-site treatment systems) or public sewerage: 90%. - Percentage of rural population with adequate sanitary facilities (on-site
treatment systems): 90%. - Municipal wastewater treatment systems
No. of tertiary treatment systems: 190.
K. IMPROVEMENT WORKS IN THE LAKE (Q)
-
None.
L. DEVELOPMENT PLANS (Q)
-
None.
M. LEGISLATIVE AND INSTITUTIONAL MEASURES FOR UPGRADING LAKE ENVIRONMENTS
M2 INSTITUTIONAL MEASURES- Staatliches Institut fur Seenforschung und Seenbewirtschaftung in Langenargen
- Betriebs- und Forschungslabor Bodensee-Wasserversorgung in Uberlingen- Sussenmuhle
- Thurgauische Bodensee-Untersuchungsstelle in Romanshorn
- Limnologisches Institut der Universitat Konstanz
- Eidgenossische Anstalt fur Gewasserforschung und Gewasserschutz (EAWAG), Zurich-Dubendorf
N. SOURCES OF DATA
- Questionnaire filled by Dr. M. M. Tilzer and Dr. H.-H. Stabel, Limnological Institute, University of Constance, Constance.
- Geller, W. & Gude, H. (1989) Lake Constance - the largest German lake. "Limnology in the Federal Republic of Germany" (ed. Lampert, W. & Rothhaupt, K.- O.), pp. 9-17, Carius Druck GmbH, Kiel.
- Internationale Gewasserschutzkommission fur den Bodensee (1983) Jahresbericht uber den limnologischen Zustand des Bodensees Nr. 7, Der limnologische Zustand des Freiwassers von Januar 1980 bis Marz 1981. 34 PP. Jber. Int. Gewasserschutzkomm. Bodensee.
- Stabel, H.-H. (1986) Limnol. Oceanogr., 31: 1081-1093.
- Stabel, H.-H. (1986) Hydrobiologia, 140: 173-181.
- Melzer, A. (1989) The distribution of aquatic macrophytes. "Limnology in the Federal Republic of Germany" (ed. Lampert, W. & Rothhaupt, K.-O.), pp. 152-155, Carius Druck GmbH, Kiel.
- Frenzel, P. (1983) Arch. Hydrobiol., Suppl., 65: 106-133.
- Frenzel, P. (1983) Arch. Hydrobiol., 97: 262-280.
- Frenzel, P. (1980) Hydrobiologia, 74: 141-144.
- Tilzer, M. M. (1983) Limnol. Oceanogr., 28: 833-846.
- Sabata, T., Koga, T. and Stabel, H.-H. Personal communication.


