
LAKE MJOSA
A view from the eastern shore near Stange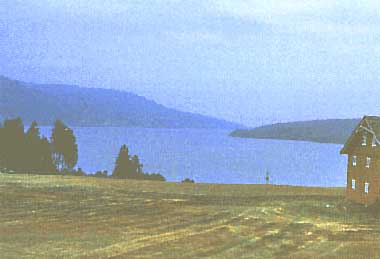 Photo: A. Kurata
A. LOCATION
- Hedmark, Oppland and Akershus, Norway.
- 60:45N, 11:15E; 121 m above sea level.
B. DESCRIPTION
- Lake Mjosa, the largest lake of Norway, is a typical
Norwegian fjord lake. It has a surface area of 365 km2, maximum depth of
449 m, mean depth of 153 m and maximum length of 117 km. Large parts of
the catchment area consist of mountainous regions with gabbroic and granitic
bedrock. Around the central zone of the lake there are sedimentary and
metamorphic rocks of cambro- silurian age and some calcareous rock types.
This district is one of Norway's best agricultural areas. The lake lies
well below the highest post-glacial marine limit which in this area is
just 200 m above the present ocean level. In the mountain regions there
are many glaciers, and the main tributary, River Gudbrandsdalslagen, carries
a heavy silt load from the glacier area during the summer. Approximately
75% of the water mass in Mjosa flow through the River Gudbrandsdalslagen
(mean annual flow 250 m3 sec-1) which drains a region dominated by high
mountains and glaciers. This tributary has been regulated for hydro-electric
power generation and the mean winter water flow of the river has thus increased
from 64 to 104 m3 sec-1 (65%), while the mean summer flow has decreased
from 509 to 451 m3 sec-1 (11%).
Melting of snow and ice in the mountains causes a high flow during summer which is especially heavy during periods of warm and rainy weather. Approximately 60% of the annual water flow takes place between June and August. Lake Mjosa is used as a reservoir for hydro-electric power generation. The regulation height is 3.61 m which is equivalent to a reservoir approximately 2.3% of the lake volume. Water is drawn from the lake during winter (November-April) and the lake is refilled during the spring flood in May/June. The vernal circulation period normally lasts from the latter half of April to the end of June, while the autumnal circulation down to approximately 200 m lasts from October to January/February. Cooling of the deep water evidently continues until the vernal circulation period begins. The deep water temperature always ranges between 3.5 and 3.7deg C. The central zones of the lake are often ice-free during the winter.
During the period from the beginning of the 1950's to the midst of the 1970's the lake has developed strongly in an eutrophic direction. However, satisfactory solutions are to be found for waste treatment in rural districts by the "Save Mjosa Campaign" including the rapid development of purification techniques and building of sewage pipelines (1).
C. PHYSICAL DIMENSIONS
| Surface area [km2] | 365 |
| Volume [km3] | 56.2 |
| Maximum depth [m] | 449 |
| Mean depth [m] | 153 |
| Water level | Regulated |
| Normal range of annual water level fluctuation [m]* | 4 |
| Residence time [yr] | 6 |
| Catchment area [km2] | 16,420 |
| *
|
|
D. PHYSIOGRAPHIC FEATURES
D1 GEOGRAPHICAL-
Bathymetric map:
Fig. EUR-32-01.
- Names of main islands: Helgoya (ca. 25 km2)(2).
- Number of outflowing rivers and channels (name): 1 (R. Vorma).
- Climatic data at Oslo, 1866-1966 (3)
| Mean temp. [deg C] | ||||||||||||
| Jan | Feb | Mar | Apr | May | Jun | Jul | Aug | Sep | Oct | Nov | Dec | Ann. |
|---|---|---|---|---|---|---|---|---|---|---|---|---|
| -4.7 | -4.0 | -0.5 | 4.8 | 10.7 | 14.7 | 17.3 | 15.9 | 11.3 | 5.9 | 1.1 | -2.0 | 5.9 |
| Precipitation [mm] | ||||||||||||
| 49 | 35 | 26 | 44 | 44 | 71 | 84 | 96 | 83 | 76 | 69 | 63 | 740 |
- Number of hours of bright sunshine (1956-1965): 1,632 hr yr-1.
- Solar radiation: 8.7 MJ m-2 day-1.
- Water temperature [deg C](4)
Lake centre, May 1977 Range: 3.30-3.70. Mean: 3.38.
Water temperature at the central zone.
- Freezing period: December-March.
- Mixing type: Dimictic (1).
The central zones of the lake are often ice-free during the winter (1).
Variation in surface water level and water flow in tributaries and outlet, 1977 (4).
E. LAKE WATER QUALITY
E1 TRANSPARENCY:
E2 pH (4)
- Central zone, May 1977: 6.9 (6.8-7.0).
- Central zone, May 1977: 11.2 (10.3-11.6).
Saturation degree [%]: 86.9 (80.3-90.1).
E6 CHLOROPHYLL CONCENTRATION [micro g l-1]:
E7 NITROGEN CONCENTRATION (4)
- NO3-N [mg l-1]
- Total-N [mg l-1]
Central zone, May 1977: 0.355 (0.340-0.390).
Central zone, May 1977: 0.455 (0.420-0.540).
- PO4-P [micro g l-1]
- Total-P [micro g l-1]
Central zone, May 1977: 2.8 (2.0-5.0).
Central zone, May 1977: 5.6 (4.0-8.0).
E10 PAST TRENDS:
- chlorophyll a concentration [micro g l-1]*
| 1976 | 1977 | 1978 | 1979 | 1980 | |
|---|---|---|---|---|---|
| Mean | 4.8 | 4.3 | 4.6 | 3.5 | 3.6 |
| Maximum | 12.5 | 6.7 | 6.8 | 8.5 | 4.1 |
| * In composite samples 0-10 m from the central zone of the lake for the period 1976-1980. | |||||
F. BIOLOGICAL FEATURES
F1 FLORA (4)- Phytoplankton
Asterionella formosa, Fragilaria crotonensis, Diatoma elongatum, Tabellaria fenestrata, Rhizosolenia eriensis, Melosira italica, Oscillatoria bornetii f. tenuis.
- Zooplankton
- Benthos
- Fish
- Supplementary notes on the biota
Calanoid (Limnocalanus macrurus, Eudiaptomus gracilis), cyclopoid (Cyclops lacustris, Mesocyclops oitbonoides), cladoceran (Daphnia galeata, D. cristata, Bosmina longispina).
Oligochaeta (Stylodrilus beringianus, Peloscolex ferox, Tubifex tubifex), chironomid (Heterotrissocladius subpilosus, Paracladophelma obscura, Micropsectra spp.)
Vendace, pike, perch, roach, bream, brown trout.
The total fish production has increased, particularly with respect to such species as vendace, pike, perch, roach and bream, while the more noble salmon species such as whitefish and brown trout have decreased.
- Primary production of phytoplankton at the central zone of the lake
for the period 1973-1980
| 1973 | 1974 | 1975 | 1976 | 1977 | 1978 | 1979 | 1980 | |
|---|---|---|---|---|---|---|---|---|
| Daily mean values [mg C m-2] | 270 | 320 | 500 | 570 | 370 | 140 | 110 | 110 |
| Daily maximum values [mg C m-2] | 643 | 651 | 1,355 | 1,425 | 750 | 362 | 279 | 218 |
| Yearly values [g C m-2] | 50 | 55 | 100 | 100 | 69 | 25 | 20 | 20 |
F5 FISHERY PRODUCTS (4)
- Annual fish catch [metric tons]
1980: 219. F6 PAST TRENDS (6) Mean values for algal biomass and percentages of blue-green algae at the central zone of the lake during the production period May-October for the period 1976-1980.
| 1976 | 1977 | 1978 | 1979 | 1980 | |
|---|---|---|---|---|---|
| Mean values [g m-3] | 1.67 | 1.42 | 1.05 | 1.01 | 0.82 |
| Blue-green algae [%] | 37.9 | 4.7 | 17.0 | 0.6 | 2.7 |
G. SOCIO-ECONOMIC CONDITIONS (6)
G2 INDUSTRIES IN THE CATCHMENT AREA AND THE LAKE 1980- Main products of agriculture
- Main kind of manufacturing
- Main kinds of manufacturing products
Wheat, potato, vegetables and dairy products.
Paper mill, cannery, brewery, metallurgical factory, mineral water factory.
Wood pulp, flour, canned food, brewing products, metal, mineral water.
| 1980 | |||
| Population | Population density [km-2] | Major cities (population) | |
|---|---|---|---|
| Total | 200,000 | 12.2 | Lillehammer, Gjovik, Hamar |
H. LAKE UTILIZATION
H1 LAKE UTILIZATION (1, 6)- Source of water, sight-seeing and tourism, recreation (sport-fishing
and yachting), fisheries and power generation.
I. DETERIORATION OF LAKE ENVIRONMENTS AND HAZARDS
I1 ENHANCED SILTATION (6)- Extent of damage: Not serious.
- Nuisance caused by eutrophication
- Nitrogen and phosphorus loadings to the lake [t yr-1](1)
Algal bloom of Oscillatoria bornetii f. tenuis caused obnoxious and abnormal taste and odour of drinking water.
| 1976 | ||||||
| Sources | Industrial | Domestic | Agricultural | Forest | Natural | Total |
|---|---|---|---|---|---|---|
| T-N | 200 | 700 | 2,200 | 2,000 | 400 | 5,500 |
| T-P | 95 | 105 | 45 | 90 | 58 | 393 |
- Supplementary notes (6)
Past trend of total loading of phosphorus [t yr-1] to the lake.
| Loadings | 1973/1975 | 1976 | 1977 | 1978 | 1979 | 1980 |
|---|---|---|---|---|---|---|
| Via tributaries | 129 | 120 | 83 | 106 | 165 | - |
| From nearby areas | 188 | 188 | 147 | 113 | 87 | - |
| Total | 317 | 308 | 230 | 219 | 252 | 225 |
I4 ACIDIFICATION (4)
- Extent of damage: Not serious.
J. WASTEWATER TREATMENTS
J1 GENERATION OF POLLUTANTS IN THE CATCHMENT AREA- d) Measurable pollution with limited wastewater treatment (6).
| 1976 | ||
| N [%] | P [%] | |
|---|---|---|
| Natural | 7.3 | 14.7 |
| Forest | 36.4 | 22.9 |
| Agricultural | 40.0 | 11.5 |
| Domestic | 12.7 | 26.7 |
| Industrial | 3.6 | 24.2 |
| Total | 100 | 100 |
- Percentage of municipal population in the catchment area provided with
- Percentage of rural population with adequate sanitary facilities (on-site
- Municipal and industrial wastewater treatment systems
adequate sanitary facilities (on-site treatment systems) and public sewerage: 90%.
treatment systems): 10%.
No. of municipal and industrial wastewater treatment systems: 42.
K. IMPROVEMENT WORKS IN THE LAKE
K1 RESTORATION (6)- When in late summer 1976 the drinking water for about 200,000 people
suffered from heavy bloom of blue-green algae, the Norwegian Parliament
adopted a new plan of action called "Mjosa Campaign" with the objective
of reducing the phosphorus load to 175 t by the end of the campaign (1979-1980).
As a result of this campaign, 42 new sewage treatment plants for retention
of phosphorus have been built and 280 km of new sewer pipe have been installed.
The purification efficiency at the new sewage treatment plans is fully
satisfactory as over 90% of phosphorus is eliminated. In the densely built-up
areas phosphorus in the sewage discharge has been reduced from about 92
to 25 t per year.
L. DEVELOPMENT PLANS (6)
- None.
M. LEGISLATIVE AND INSTITUTIONAL MEASURES FOR UPGRADING LAKE ENVIRONMENTS
M3 RESEARCH INSTITUTES ENGAGED IN THE LAKE ENVIRONMENT STUDIES (1)- The Norwegian Institute for Water Research (NIVA)
N. SOURCES OF DATA
- Holtan, H. (1979) The Lake Mjosa story. Arch. Hydrobiol. Beih. Ergebn. Limnol., 13: 242-258.
- Royal Norwegian Embassy. Personal communication.
- Johannessen, T. W. (1970) The Climate of Scandinavia. "World Survey of Climatology, Volume 5, Climates of Northern and Western Europe" (ed. Wallen, C. C.), pp. 23-79. Elsevier Scientific Publishing Company, Amsterdam-London-New York.
- Holtan, H. (1980) The case of Lake Mjosa. Prog. Wat. Tech., Vol. 12: 103-120. IAWPRC Pergamon Press, Great Britain.
- Holtan, H. (1978) Eutrophication of Lake Mjosa in relation to the pollutional load. Verh. Internat. Verein. Limnol., 20: 734-742.
- Holtan, H. (1981) Eutrophication of Lake Mjosa and its recovery. WHO Water Quality Bulletin, 6(4): 99-103, 156.
