LAKE SNIARDWY
A view on the lakeshore
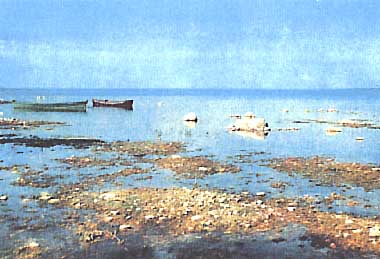
Photo: A. Hillbricht-Iikowska
A. LOCATION
- District of Great Masurian Lakes, Poland.
- 53:45N, 21:45E; 116.1 m above sea level.
B. DESCRIPTION
Lake Sniardwy is the largest lake in Poland. It receives the water from an area about 2,400 km2, i. e. two-thirds of the basin of Great Masurian Lakes, the most important lake district in Poland, which contains about 10% of all lake area in Poland and in turn is part of Baltic lakelands in Europe. Lake Sniardwy watershed belongs to the River Pisa and finally - the River Vistuala drainage basin.
The whole Lake Sniardwy region was formed during the last glaciation about 12,000 years ago as the melting product of "dead" ice block. Hilly relief is formed by moraines, ramparts and out-wash plains; sand, gravel and clay dominate substrata.
Lake Sniardwy is the central part of Masurian Landscape Protective Area formed to protect the postglacial relief, forest and swamps with boreal and subarctic vegetation, as well as many lakes and pools. In the Protective Area several reserves occur with the stands of rare plant species and old forest; there are also waterfowl reserves like Lake Luknajno biosphere reserve with the colony of mute swan. The area including Lake Sniardwy is a popular study site for botanical, zoological and ecological researches.
The Great Lakes area is one of the most important touristic centres in Poland, and Lake Sniardwy offers main sites for navigation and yachting (1).
C. PHYSICAL DIMENSIONS (Q)
| Surface area [km2] | 110 |
| Volume [km3] | 0.6509 |
| Maximum depth [m] | 23.4 |
| Mean depth [m] | 5.8 |
| Water level | Unregulated |
| Normal range of annual water level fluctuation [m] | 0.2-0.8* |
| Length of shoreline [km] | 91.3 |
| Residence time [yr] | 1.4 |
| Catchment area [km2] | 114 |
| * 1950-1970. |
D. PHYSIOGRAPHIC FEATURES
D1 GEOGRAPHICAL (Q)
- Sketch map: Fig. EUR-30-01.
- Bathymetric map: Fig. EUR-30-02.
- Names of main islands: Pajecza and Czarci Ostrow (0.429 km2 in total area).
- Number of outflowing rivers and channels (name)
2 (Jeglinski Canal and Wyszka R.).
D2 CLIMATIC (2)
- Climatic data at Mikolajki town, 1951-1975
| Mean temp. [deg C] |
| Jan | Feb | Mar | Apr | May | Jun | Jul | Aug | Sep | Oct | Nov | Dec | Ann. |
|---|
| -4.4 | -3.7 | -0.4 | 5.9 | 11.9 | 16.1 | 17.5 | 16.8 | 12.8 | 8.0 | 2.5 | -1.4 | 6.8 |
| Precipitation [mm] |
| 26 | 26 | 25 | 40 | 51 | 72 | 77 | 73 | 49 | 41 | 50 | 35 | 565 |
- Number of hours of bright sunshine: 720 hr yr-1.
- Solar radiation: 10.2 MJ m-2 day-1.
Fig. EUR-30-01
Sketch map of Great Masurian Lakes and their watershed area.
Fig. EUR-30-02
Bathymetric map [m].
- Water temperature [deg C](3, 4)
1-3 stations, July-August, 1976 and 1977
| Depth [m] | 1976 | 1977 |
|---|
| 1 | 23.5 | 20-22 |
| 10 | 15.5 | - |
| 11 | - | 19-21 |
Fig. EUR-30-03
Thermal and oxygen stratification in Lake Sniardwy, summer 1977 (after Soszka, et al., 1979).
- Freezing period: Late December-middle April (150 days).
- Mixing type: Polymictic.
- Notes on water mixing and thermocline formation
Permanently mixed till the bottom. However, after a couple of weeks of calm weather, thermocline is formed at 6-7 m depth, and surface-bottom temperature difference could be about 6-7deg C. Being large and shallow, Lake Sniardwy is almost permanently mixed and unstratified during ice-free period, middle April to middle December, except after a long-term and unusually calm and hot weather. The waves in stormy weather could reach 2 m height. The wind characteristics in the region is following (mean value for 1951-1975). Strong (velocity: >10 m sec-1): >32 days yr-1 Very strong (velocity: >15 m sec-1): >4.4 days yr-1 Average wind speed (velocity): 3.3 m sec-1 yr-1
E. LAKE WATER QUALITY
E1 TRANSPARENCY [m](2)
| Middle part, July-August* |
| Depth [m] | 1950 | 1976 | 1977 | 1978 | 1984 | 1986 |
|---|
| | 1.7 | 2.8 | 2.5 | 2.8 | 3.8 | 2.1 |
| * Summer. |
E2 pH (4)
| Middle part, 1977 |
| Depth [m] | Jan | Feb | Mar | Apr-May | Jun | Jul-Aug | Sep | Oct-Nov | Dec |
|---|
| 0-10* | - | - | - | 8.4-8.5 | - | 7.9-8.4 | - | 7.9 | - |
| * Average for water column. |
E3 SS [mg l-1](4)
| Middle part*1, 1977 |
| Depth [m] | Jan | Feb | Mar | Apr | May | Jun | Jul-Aug | Sep | Oct-Nov | Dec |
|---|
| *2 | - | 0.7 | - | 2.6 | - | - | 2.0-2.8 | - | 1.7 | - |
| *1 Range for two stations. |
| *2 0-10, average for whole water column. |
| All sestonic parts retained by the filter C, 4 micro m mesh. |
E4 DO [mg l-1](3, 4)
| Middle part*1, summer 1976 |
| Depth [m] | Aug |
|---|
| 1 | 9 |
| 10*2 | 3 |
| *1 Range for stations. *2 Above bottom. |
| Middle part, summer 1977 |
| 1 | 9.5-10.5 |
| 11*2 | 6-7 |
E6 CHLOROPHYLL CONCENTRATION [micro g l-1](2, 4)
| Middle part*, 1977 |
| Depth [m] | Jan-Feb | Mar | Apr | May | Jun-Jul | Aug | Sep-Oct | Nov | Dec |
|---|
| 1-2 | 2.27 | - | 4.67 | - | 1.3-3.7 | - | 1.07 | - | - |
| * Range for stations. |
| Middle part* |
| Depth [m] | 1973 | 1976 | 1977 | 1978 | 1984 | 1986 |
|---|
| Surface | 6.7 | 7.4 | 2.7 | 9.2 | 13.0 | 29.2-32.4 |
| layer |
E7 NITROGEN CONCENTRATION (2, 4)
Middle part*1, July-August*3
| Depth [m] | 1950 | 1965 | 1966 | 1977*2 | 1978 | 1984 | 1986 |
|---|
| 1-2 | 0.020 | 0.25 | 0.07 | 0.32 | - | - | - |
| 10* | - | - | - | - | - | 0.80 | - |
| Depth [m] | 1950 | 1965 | 1966 | 1977*2 | 1978 | 1984 | 1986 |
|---|
| 1-2 | trace | 0.05 | 0.01 | 0.02 | - | - | - |
| 10* | - | - | - | - | - | 0.72 | - |
| Depth [m] | 1950 | 1965 | 1966 | 1977*2 | 1978 | 1984 | 1986 |
|---|
| 1-2 | - | - | - | 0.78 | 0.93 | 2.96 | 2.25 |
| 10* | - | - | - | - | - | 4.16 | 2.75 |
| *1 Range for stations. *2 Four seasons. *3 Summer. *10 m above bottom. |
| 1977 |
| Depth [m] | Feb | Apr | Aug | Oct |
|---|
| 0-10 | 0.26 | 0.22-0.24 | 0.29-0.40 | 0.21-0.31 |
| 1977 |
| Depth [m] | Feb | Apr | Aug | Oct |
|---|
| * | 0.14-0.22 | 0.07-0.13 | 0.00-0.06 | - |
| * Average. |
E8 PHOSPHORUS CONCENTRATION (2)
| Middle part, July-August*1 |
| Depth [m] | 1950 | 1965 | 1966 | 1977 | 1984 | 1986 |
|---|
| 1-2 | 0.010 | 0.023 | 0.003 | 0.08-0.10 | 0.13 | 0.90 |
| 10*2 | 0.013 | 0.012 | 0.003 | - | 0.86 | 0.440 |
| *1 Summer. *2 Above bottom. |
E9 CHLORIDE CONCENTRATION [mg l-1](2, 4)
| Middle part, 1977 |
| Depth [m] | Jan | Feb | Mar | Apr | May | Jun | Jul-Aug | Sep | Oct | Nov | Dec |
|---|
| 0-10* | - | 10-11 | - | 10 | - | - | 10-11 | - | 10 | - | - |
| * Mean for water column. |
| Middle part, summer |
| Depth [m] | 1950 | 1977 | 1984 |
|---|
| S* | 10-11 | 10-11 | 15.4 |
| * Surface layer. |
F. BIOLOGICAL FEATURES
F1 FLORA
- Emerged macrophytes: Phragmites australis (3).
- Floating macrophytes
No significant importance, rather scarce due to usually strong wave action. Psammolittoral (sandy bottom with scarce vegetation) occurs in many parts of lake shore (3).
- Submerged macrophytes
Characeae, Ceratophyllum demersum, Elodea canadensis, Potamogeton pectinatus, P. perfoliatus, P. lucens (3).
- Phytoplankton
Aphanizomenon flos-aquae, Microcystis sp., Ceratium hirundinella, Melosira islandica (2).
F2 FAUNA
- Zooplankton
Daphnia eucullata, Bosmina coregoni, Diaphanosoma brachyurum, Leptodora kindtii, Eudiaptomus graciloides, Mesocyclops leuckarti, M. oithonoides, Keratella cochlearis, Bythotrephes longimanus, Hetrocope appendiculata (2).
- Benthos: Chironomidae (2).
- Supplementary notes on the biota
Aves: swans (also mute swan in Lake Luknajno connected with Lake Sniardwy), cormorants, herons and other waterfowl species. Most of them are protected. In the lake shore and bays: nesting sites of eagle (Heliaetus albicilla) and beaver (Castor fiber).
F3 PRIMARY PRODUCTION RATE [kcal m-2 day-1](5)
| Middle part, 1966 |
| Gross production |
| Jan | Feb | Mar | Apr | May | Jun | Jul | Aug | Sep | Oct | Nov | Dec | Avg*1 |
|---|
| - | - | - | - | 30.7 | 11.9 | 7.8 | 15.3 | 13.1 | 11.7 | - | - | 14.8 |
| Dark respiration*2 [%] |
| - | - | - | - | 32 | 65 | 72 | 68 | 55 | 85 | - | - | 68 |
| *1 Average for vegetation period (150 days). |
| *2 Percent of gross production. |
F4 BIOMASS (2, 3)
- Plant biomass
Emerged macrophyte-covered area (1965-1966): 757.0 ha (6.9% lake area). Mean biomass: 5.4 tons (dry wt.) ha-1, Phragmites australis: 80% of biomass of covered area. Submerged macrophyte-covered area (1965-1966): 3,028.0 ha (27.6% lake area). Mean biomass: 0.7 tons (dry wt.) ha-1, Characeae: 60% of biomass of covered area.
| Phytoplankton [mg (wet wt.) l-1], summer, layer 0-5 m |
| 1966 | 1973 | 1976 | 1984 |
|---|
| 2.5-8.2 | 8.1 | 1.7 | 0.7 |
Nannoplanktonic algae (<30 micro m) contribute 20-60% in total biomass.
| Zooplankton [mg (wet wt.) l-1], summer, layer 0-5 m |
| 1973 | 1976 | 1977 |
|---|
| 3.28 | 1.3 | 4.03 |
| Benthos [g (wet wt.) m-2], summer |
| 1976 | 1977 |
|---|
| 5.75 | 3.5 |
Chironomidae dominate (60-80% of biomass).
Sediments: Percent of organic matter in top layer (20 cm) was reported as 36%
in 1966 and 27.3% in 1977; these values are relatively high. However, the
caloric content of organic matter is rather low (12,560-15,654 J/g) probably
indicating its macrophyte origin.
| Fish [kg ha-1](3) |
| 1963-1970 | 1970-1976 |
|---|
| Roach* | 14.7 | 10.6 |
| Bream* | 3.9 | 4.7 |
| Perch* | 3.4 | 1.6 |
| Pike* | 2.2 | 1.8 |
| Eel* | 1.4 | 1.7 |
| White bream* | 0.6 | 2.7 |
| Tench* | 0.5 | 0.5 |
| Vendance* | 0.1 | 0.2 |
| (*economically important) |
F5 FISHERY PRODUCTS (Q)
- Annual fish catch [metric tons]
| 1963-1970: | 301.7. |
| 1970-1976: | 265.5. |
F7 NOTES ON THE REMARKABLE CHANGES OF BIOTA IN THE LAKE IN RECENT YEARS (Q)
No recent data are available for biota, however the recent data on
chlorophyll, T-N and T-P concentrations in over-bottom layer indicate symptoms
of eutrophication. The permanent mixing of water masses of lake is probably
the main factor mitigating the advance of eutrophication irrespective of the
high nutrient loading from the large area. The increase of chlorine
concentration could be connected with agriculture (fertilization) in the
catchment area. The lake biota structure (phyto- and zooplankton) still shows
the properties of meso- and eutrophic conditions.
G. SOCIO-ECONOMIC CONDITIONS
G1 LAND USE IN THE CATCHMENT AREA* (2)
| 1975 |
| Area [km2] | [%] |
|---|
| - Natural landscape |
| Woody vegetation | 41.8 | 36.7 |
| Swamp | 11.2 | 9.8 |
| - Agricultural land |
| Crop field | 40.9 | 35.9 |
| Pasture land meadows | 12.5 | 11.0 |
| - Residential area and roads | 3.3 | 2.9 |
| - Others | 4.1 | 3.7 |
| - Total | 113.8 | 100.0 |
| * Direct catchment area. |
- Types of important forest: Mixed and wet woods.
Dominants: Pine, spruce, birch. Others: Oak, willow, linden, hazel, elm, hornbeam.
- Types of important herbaceous vegetation
Among the species typical of coniferous woods the following rare, protected species occur: Aquilegia vulgaris, Pulsatilla sp. div., Anemone silvestris, Trifolium lupinaster, Lilium martagon, Polygonatum verticillatus, Linnaea borealis and several rare peat-bog and pond species like: Drosera sp. div., Oxycoccus microcarpus, Utricularia vulgaris, Nymphaea candida, Nuphar pumillum.
- Main kinds of crops: Rye, wheat, potato, beet, clover.
- Levels of fertilizer application on crop fields
Moderate (about 120-180 N, P, K and 120 CaO ha-1 yr-1).
- Trends of change in land use: No significant changes.
G2 INDUSTRIES IN THE CATCHMENT AREA AND THE LAKE (Q)
No data are available.
- Numbers of domestic animals in the catchment area
1980-1983 No. per 100 ha of arable land Cattle 76, horses 11, sheep 12, swine 68, poultry 300.
G3 POPULATION IN THE CATCHMENT AREA (Q)
| 1980-83 |
| Population | Population density [km-2] | Major cities (population) |
|---|
| Rural | | 10 | No cities greater than 30,000 |
| Total | - |
In the close vicinity of Lake Sniardwy several villages occur, one year-round
recreation centre and several camping places. Mean population density in the
whole Landscape Protected Area: 23 km-2.
H. LAKE UTILIZATION (Q)
H1 LAKE UTILIZATION
Navigation and transportation, sight-seeing and tourism (no. of visitors in
1982-1983: 80,000 per year), recreation (swimming, sport-fishing, yachting)
and fisheries.
H2 THE LAKE AS WATER RESOURCE (Q)
Not used. The cattle is occasionally kept in shallow shores of the lake.
I. DETERIORATION OF LAKE ENVIRONMENTS AND HAZARDS
I1 ENHANCED SILTATION (Q)
- Extent of damage : Not serious.
- Supplementary notes
Rate of sedimentation not assessed. Very strong resedimentation processes due to constant mixing of water might occasionally influence the turbidity of water.
I2 TOXIC CONTAMINATION (Q)
- Supplementary notes
No sewage with toxicants are released to the lake directly and no heavy industry is located in the region, however the pesticides are used in the catchment basin, as well as in the region, which means that the respective compounds could be transported into the lake with surface runoff and/or via air transport, together with the long- and short-distance transport of typical air pollution. The great area of the lake surface could be an effective trap for these pollutants. The quality of lake water was assessed according to the standards used in the country in 1977 and 1986. During this period a marked deterioration of lake water occurred due mainly to the increase of phytoplankton biomass and chlorophyll concentration and decrease of oxygen content. The main reason for it was the inflow of polluted waters from adjacent lakes mainly Lake Mikolajskie.
I3 EUTROPHICATION (Q)
- Nuisance caused by eutrophication
No very heavy algal blooms are reported, however the increase of chlorophyll concentration was noted.
- Nitrogen and phosphorus loadings to the lake [g m-2 yr-1]
| 1984-1985 |
| Sources | T-P |
|---|
| Sewage | 0.002 | Mainly animal farm and distillery factory |
| Tourism | 0.0018 |
| Surface run-off | 0.05 | Agriculture mainly |
| Precipitation | 0.06 |
| Tributaries | 1.14 | Mainly polluted waters from other lakes like Lake Mikolajskie |
| Total | 1.2538 |
This value is much higher than permissible (0.176) and dangerous (0.35) limits
according to Vollenweider's criteria.
I4 ACIDIFICATION (Q)
- Kinds of damage
No serious risk is expected due to the high content of calcium in water (40 mg-1-1) as in the whole lake region. However, some small dystrophic lakes in the vicinity of Lake Sniardwy could be affected by the long-distance transport of acid compounds. The assessment of the S deposits in the whole region for 1985-1986 gives the value about 2-7 kg S ha-1 yr-1.
J. WASTEWATER TREATMENTS
J1 GENERATION OF POLLUTANTS IN THE CATCHMENT AREA (Q)
d) Measurable pollution with limited wastewater treatment.
J2 APPROXIMATE PERCENTAGE DISTRIBUTION OF POLLUTANT LOADS (6)
| [%] |
|---|
| Non-point sources (agricultural, natural and dispersed settlements) | 99 |
| - Point sources |
| Municipal | 1 |
| - Total | 100 |
J3 SANITARY FACILITIES AND SEWERAGE (2)
- Percentage of municipal population in the catchment area provided with
adequate sanitary facilities (on-site treatment systems) or public sewerage: 30%.*
- Percentage of rural population with adequate sanitary facilities (on-site
treatment systems): 0%.
- Municipal wastewater treatment systems
No. of tertiary treatment systems: 0. No. of secondary treatment systems: 2.* No. of primary treatment systems: 0. (* For the municipal population in the main tributary, Lake Mikolajskie to Lake Sniardwy.)
K. IMPROVEMENT WORKS IN THE LAKE
K2 AERATION (Q)
Deep water aeration is planned for highly polluted Lake Mikolajskie which
drains directly into Lake Sniardwy in the nearest future.
L. DEVELOPMENT PLANS (Q)
The protective measures in Masurian Landscape Protected Area including Lake
Sniardwy catchment basin has recently been elaborated. It contains: ban on
further development of year-round touristic centres, control of usage of
fertilization and manure, correction of land use in the shore zone of lakes
(diversion of plowed land, afforestation), protection of marshy areas,
installation of wastewater treatment systems (with P removal) for two main
towns (situated upwards of Lake Sniardwy) and septic tanks for all camping
sites and close-to-shore farms. Also the above mentioned restoration program
for Lake Mikolajskie is planned. Since several years, the ships used in
normal navigation are equipped with septic tanks.
M. LEGISLATIVE AND INSTITUTIONAL MEASURES FOR UPGRADING LAKE ENVIRONMENTS
M1 NATIONAL AND LOCAL LAWS CONCERNED (Q)
- Names of the laws (the year of legislation)
- The Regional Government Decision edited in 1977 on formation of Masurian Landscape Protective Area (690 km2) including Lake Sniardwy and its catchment area.
- Responsible authorities
- State Regional Laboratory for Water Pollution Control
- Regional (Suwalski district) and Local (Mikolajki town) Governments Responsible for Environment Management and Spatial Planning
- Main items of control
- Water pollution control and water use
- Environment management (like land use) and spatial planning (like construction)
M2 INSTITUTIONAL MEASURES (Q)
- State Organization and Bodies
- Social Organizations 1. Social Committee for Protection of Great Masurian Lakes, founded in 1985 2. Ecological Clubs 3. Several student and youth (including sport) organizations of ecological orientation
M3 RESEARCH INSTITUTES ENGAGED IN THE LAKE ENVIRONMENT STUDIES (Q)
- Institute of Environment Protection (Ministry of Environment Protection)
- Institute of Ecology, Polish Academy of Sciences, Field Station on Lake Mikolajskie
- Institute of Inland Fisheries (Ministry of Agriculture)
- Universities and higher schools, especially Warsaw University running two field stations in Masurian Landscape Protective Area (on Lake Luknajno and Lake Ros) and Olsztyn Higher School
- Scientific Council of Masurian Landscape Protective Area (local government)
N. SOURCES OF DATA
- Questionnaire was filled by Prof. A. Hillbricht-Ilkowska, Polska Akademia Nauk Instytut Ekologii, Warszawy.
- Krajobrazowy, M. P. (1985) "Masurian Landscape Protective Area" (eds. Polakowski, B. and Strumillo, A.), Ludowa Spoldzielnia Wydawnicza (in Polish). pp. 350.
- Bajkiewicz-Grabowska (1989) "Lakes of Masurian Landscape Protective Area - ecological state, eutrophication, protection" (in Polish)(ed. A. Hillbricht-Ilkowska), Ossolineum. Warszawa-Wroclaw (in press).
- Gliwicz, Z. M., Kowalczewski, A., Ozimek, T., Pieczynska, E., Prejs, A., Prejs, K. & Rybak, J. S. (1980) The assessment of the eutrophication of Great Masurian Lakes (in Polish). Inst. Ksztalowania Srodowiska, Warszawa. p. 103.
- Soszka, H., Cydzik, D. & Kudelska, D. (1979) The assessment of water quality in Great Masurian Lakes (in Polish). Inst. Ksztaltowania Srodowiska, Warszawa. p. 66.
- Hillbricht-Ilkowska, A. & Spodniewska, I. (1969) Comparison of the primary production of phytoplankton in three lakes of different trophic type. Ekol. Pol., 17: 241-261.
- Cydzik, D., Kudelska, D. & Soszka, H. (1982) Atlas of water quality of lakes studied in 1974-1978 (in Polish). Inst. Ksztaltowania Srodowiska, Warszawa. p. 548.

