LOCH MORAR
From a view-point on western hill-top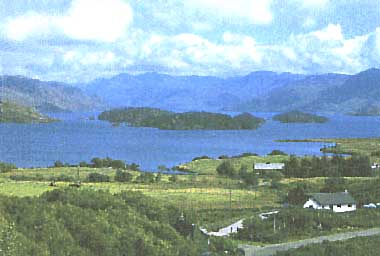 Photo: A. Kurata
A. LOCATION
- Scotland, UK.
- 56:57N, 5:45W; 10.1 m above sea level.
B. DESCRIPTION
- Of glacial origin, Loch Morar is the deepest lake
in the British isles with a maximum depth of 310.0 m and ranks seventeenth
deepest in the world. It is elongate in shape with its main axis running
in an east-west direction. It has a total length of 18.8 km, a mean depth
of 86.6 m and a volume of 2.3073 km3. Though there are two basins both
deeper than 270 m, Loch Morar is essentially a single large basin, with,
in most places, very steeply shelving sides.
Like Loch Shiel, Loch Morar has moderate watershed altitude, but very steep slope, very little arable ground and base-poor geology. But in this lake, there is much less forest around the lake than Loch Shiel.
The mild winters and cool summers experienced close to the lake are caused by the damping of seasonal fluctuations in air temperature not only by the proximity of the Atlantic Ocean but also by the heat absorption and release of the large volume of water in the lake itself. Significantly ice is limited to shallow areas, even in severe winters.
Loch Morar, with the smallest catchment among the other four Scotland lakes (Loch Ness, Loch Shiel, Loch Awe and Loch Lomond) drains relatively small area (less than one tenth of that of Loch Ness). The lake, therefore, is likely to be very nutrient poor (1, 2, 4, 10).
C. PHYSICAL DIMENSIONS (1, 2)
| Surface area [km2] | 27 |
| Volume [km3] | 2.3 |
| Maximum depth [m] | 310 |
| Mean depth [m] | 86.6 |
| Water level | Regulated |
| Length of shoreline [km] | 60.0 |
| Residence time [yr] | 6.9 |
| Catchment area [km2] | 142 |
D. PHYSIOGRAPHIC FEATURES
D1 GEOGRAPHICAL (2)-
Bathymetric map:
Fig. EUR-25-01.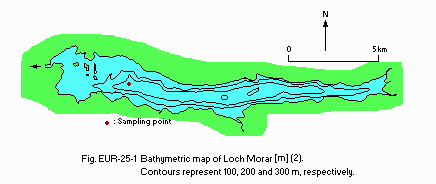
- Names of main islands: The area of island is 0.269 km2.
- Number of outflowing rivers and channels (name): 1 (R. Morar).
- Climatic data at Achnashellach (3)*
| Mean temp. [deg C] | ||||||||||||
| Jan | Feb | Mar | Apr | May | Jun | Jul | Aug | Sep | Oct | Nov | Dec | Ann. |
|---|---|---|---|---|---|---|---|---|---|---|---|---|
| 3.8 | 3.2 | 5.2 | 6.9 | 10.1 | 12.4 | 13.8 | 13.6 | 11.6 | 8.7 | 5.7 | 4.1 | 8.2 |
| Precipitation [mm] | ||||||||||||
| 232 | 177 | 127 | 156 | 93 | 114 | 148 | 150 | 189 | 234 | 196 | 242 | 2,058 |
| * 13-year mean. | ||||||||||||
- Number of hours of bright sunshine: 1,374 hr yr-1.


-
Water temperature: Fig. EUR-25-02.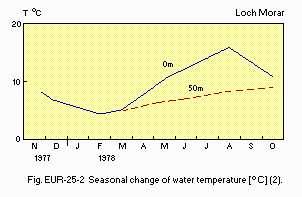


- Freezing period: Occasionally (2).
- Mixing type: Monomictic (2).
E. LAKE WATER QUALITY
E1 TRANSPARENCY [m](6)- November 1977 and October 1978: 5.75-10.20.
| 1977 | ||||||||||||
| Depth [m] | Jan | Feb | Mar | Apr | May | Jun | Jul | Aug | Sep | Oct | Nov | Dec |
|---|---|---|---|---|---|---|---|---|---|---|---|---|
| 0-10 | - | - | - | - | - | - | - | - | - | - | 6.9 | 6.7 |
| 1978 | ||||||||||||
| 0-10 | - | 6.6 | 6.7 | - | 6.7 | - | 6.5 | 6.5 | - | 6.4 | - | - |
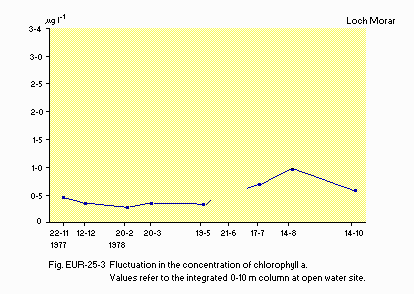


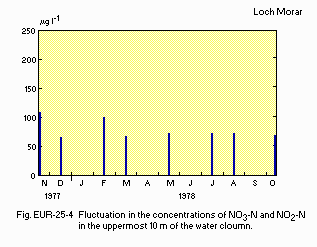


- PO4-P [micro g l-1]
November 1977-October 1978: <10.
F. BIOLOGICAL FEATURES
F1 FLORA- Submerged macrophytes: Littorella sp., Lobelia sp., Isoetes sp. (6).
- Phytoplankton (5)
Rhizosolenia longiseta, R. eriensis, Tabellaria flocculosa, Rhodomonas minuta, Gymnodinium helveticum, Staurastrum spp. Botryococcus braunii.
- Zooplankton (7)
- Benthos (Q)
- Fish (9)
Bosmina coregoni, Polyphemus pediculus, Bythotrephes longimanus, Leptodora kindti, Diaptomus gracilis, Cyclops abyssorum, Diaphanosoma brachyurum, Holopedium gibberum.
Stylaria lacustris, Ameletus inopinatus, Ecdyonurus venosus, E. dispar, Ephemerella ignita, Leuctra fusca, Chloroperla torrentium.
Salmo salar, S. trutta, Salvelinus alpinus, Anguilla anguilla, Gasterosteus aculeatus.
-
Zooplankton:
Fig. EUR-25-05.


G. SOCIO-ECONOMIC CONDITIONS (1)
G1 LAND USE IN THE CATCHMENT AREA| 1978 | ||
| Area [km2] | [%] | |
|---|---|---|
| - Natural landscape | ||
| Woody vegetation | 4.5 | 3.2 |
| Rough | 132.7 | 93.3 |
| - Agricultural land | 0.9 | 0.6 |
| - Residential area | 0.6 | 0.4 |
| - Others | 3.6 | 2.5 |
| - Total | 142.3 | 100.0 |
| 1978 | |||
| Population | Population density [km-2] | Major cities (population) | |
|---|---|---|---|
| Total | 162 | 1.0 | None |
H. LAKE UTILIZATION (3)
H1 LAKE UTILIZATION- Source of water, recreation (sightseeing, swimming, sport-fishing)
and power generation.
I. DETERIORATION OF LAKE ENVIRONMENTS AND HAZARDS (4, 10)
I1 ENHANCED SILTATION- Extent of damage: None.
- Present status: Not detected.
- Nuisance caused by eutrophication: None.
- Extent of damage: None.
J. WASTEWATER TREATMENTS (1, 10)
J1 GENERATION OF POLLUTANTS IN THE CATCHMENT AREA- b) No sources of significant pollution.
- Municipal wastewater treatment systems: None.
- Industrial wastewater treatment systems: None.
N. SOURCES OF DATA
- Maitland, P. S. (1981) Introduction and catchment analysis. The Ecology of Scotland's Largest Lochs, Lomond, Awe, Ness, Morar and Shiel (ed. Maitland, P. S.), pp. 1-27. Dr. W. Junk Publishers, The Hague.
- Smith, I. R., Lyle, A. A. & Rosie, A. J. (1981) Comparative physical limnology). Ibid., pp. 9-65.
- Muller, M. J. (1982) Selected Climatic Data for a Global Set of Standard Stations for Vegetation Science. 306 pp. Dr. W. Junk Publishers, The Hague.
- Bailley-Watts, A. E. & Duncan, P. (1981) Chemical characterisation, a one-year comparative study. The Ecology of Scotland's Largest Lochs, Lomond, Awe, Ness, Morar and Shiel (see above), pp. 67-89.
- --- (1981) The phytoplankton. Ibid., pp. 91-118.
- --- (1981) A review of macrophyte studies. Ibid., pp. 119-134.
- Maitland, P. S., Smith, B. D. & Dennis, G. M. (1981) The crustacean zooplankton. Ibid., pp. 135-154.
- Smith, B. D., Maitland, P. S., Young, M. R. & Carr, M. J. (1981) Ibid., pp. 155-203.
- Maitland, P. S., Smith, B. D. & Adair, S. M. (1981) The fish and fisheries. Ibid., pp. 223-251.
- The editor's observation.


