
LAKE PIELINEN
A view from the lakeside hill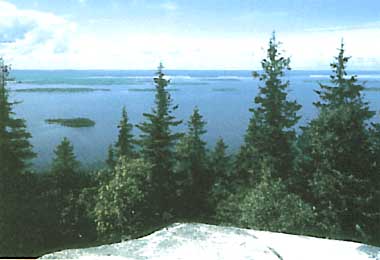
Photo: T. Kanerva
A. LOCATION
- Karjala, Finland.
- 62:54-63:33N, 29:07-30:14E; 93.7 m above sea level.
B. DESCRIPTION
-
The basin of Lake Pielinen was formed as a consequence of the post-glacial isostatic rising of the land, which affected the development of the basin and the present location of the outflowing river.
The lake is situated in eastern Finland. About half of its drainage basin is in Finland, the other half in USSR. The data presented here apply to the Finnish part of the drainage basin.
The lake receives water from four principal areas. Water from the drainage basins of the Haapajarvi-Valtimojarvi and Saramojoki watercourses is discharged into the north-western part of the lake. Water from the drainage basins of the Rivers Viekinjoki and Lieksanjoki flows into the north-eastern side and water from the small drainage basin of the River Juvanjoki into the western side. The lake water drains southwards through the River Pielisjoki.
The landscape of the lake is diverse. The shore consists partly of barren, rocky soil and partly of beaches. There are many islands. The highland area of Koli, reaching 347 m above the sea level is situated on the western shore, and has been a popular tourist resort since the beginning of this century. The lake has great potential for recreational utilization.
Lake Pielinen is part of the large Vuoksi watercourse, which has traditionally been an important route for timber floating. There is a considerable amount of water traffic on the lake.
Larger municipalities and most industries are situated in the northern and eastern parts of the drainage basin. The effects of wastewater are observed as increased eutrophication and decreased oxygen concentrations during the period of stratification in the neighbourhood of the cities of Lieksa and Nurmes. Non-point sources account for major part of the total nutrient loading of the lake.
The water quality is good and the lake is classified as mesotrophic with signs of local eutrophication. Because of the high proportion of bogs in the drainage basin the water contains humic substances and is dark in colour, a typical feature of most Finnish lakes (2, 3, 4).
C. PHYSICAL DIMENSIONS (3)
| Surface area [km2] | 867 |
| Volume [km3] | ca. 8.5 |
| Maximum depth [m] | 60 |
| Mean depth [m] | 9.9 |
| Water level | Unregulated |
| Normal range of annual water level fluctuation [m] | 1.2 |
| Length of shoreline [km] | 610 |
| Residence time [yr] | 1.9 |
| Catchment area [km2] | 12,823 |
D. PHYSIOGRAPHIC FEATURES
D1 GEOGRAPHICAL (1)- Sketch map: Fig. EUR-18-01.
- Names of main islands
Paalasmaa (27.2 km2), Kynsisaari (13.7 km2), Porosaari (10.4 km2), Toinensaari (8.2 km2), Hattusaari (6.3 km2), Koveronsaari (6.1 km2) and Retusaari (5.6 km2). - Number of outflowing rivers and channels (name): 1 (Pielisjoki R.).
- Climatic data
| Lieksa, Timitra, 1931-1960 | ||||||||||||
| Mean temp. [deg C] | ||||||||||||
| Jan | Feb | Mar | Apr | May | Jun | Jul | Aug | Sep | Oct | Nov | Dec | Ann. |
|---|---|---|---|---|---|---|---|---|---|---|---|---|
| -11.0 | -10.9 | -6.9 | 0.6 | 7.1 | 13.3 | 16.4 | 14.3 | 8.5 | 2.5 | -2.4 | -7.1 | 2.0 |
| Precipitation [mm] | ||||||||||||
| 36 | 28 | 23 | 33 | 67 | 47 | 70 | 70 | 69 | 60 | 45 | 40 | 583 |
| Juuka, 1931-1960 | ||||||||||||
| Mean temp. [deg C] | ||||||||||||
| Jan | Feb | Mar | Apr | May | Jun | Jul | Aug | Sep | Oct | Nov | Dec | Ann. |
|---|---|---|---|---|---|---|---|---|---|---|---|---|
| -10.0 | -10.8 | -6.9 | 0.8 | 7.4 | 13.2 | 16.1 | 14.2 | 8.5 | 2.8 | -2.4 | -7.1 | 2.1 |
| Precipitation [mm] | ||||||||||||
| 32 | 23 | 20 | 30 | 62 | 62 | 69 | 64 | 70 | 58 | 41 | 38 | 544 |
Sketch map.
- Water temperature [deg C]
| 1983-1987 | ||||||||
| Depth [m] | Mar*1 | Aug*1 | Mar*2 | Aug*2 | Mar*3 | Aug*3 | Mar*4 | Aug*4 |
|---|---|---|---|---|---|---|---|---|
| 1 | 0.2 | 15.4 | 0.1 | 15.2 | 0.3 | 15.4 | 0.1 | 15.6 |
| 5 | 0.7 | 15.1 | 0.6 | 15.2 | 0.6 | 15.3 | 0.4 | 15.1 |
| 10 | 0.9 | 14.4 | 1.0 | 15.1 | 0.9 | 15.1 | 1.2 | 14.7 |
| 15 | 1.2 | 14.4 | 1.2 | 14.9 | 1.2 | 13.4 | 1.5 | 14.5 |
| 20 | 1.4 | 13.4 | 1.4 | 14.0 | 1.5 | 13.0 | 1.7 | 13.0 |
| 25 | 1.5 | 12.8 | 1.4 | 13.3 | 1.8 | 11.9 | 1.7 | 11.5 |
| 30 | 1.7 | 12.5 | 1.5 | 12.2 | 1.9 | 8.9 | 1.8 | 10.2 |
| 35 | 1.8 | 12.2 | 1.7 | 11.8 | 2.0 | 7.7 | 1.8 | 9.9 |
| 40 | 1.8 | 12.2 | 1.7 | 9.5 | 2.5 | 7.4 | 1.9 | 8.8 |
| 43 | - | - | - | - | 2.2 | 8.5 | ||
| 45 | 1.9 | 12.2 | 1.8 | 7.3 | ||||
| 50 | 2.0 | 12.1 | 2.2 | 7.1 | ||||
| 55 | 2.1 | 12.1 | ||||||
| 59 | 2.1 | 11.6 | ||||||
| *1 Station 7. *2 Station 10. *3 Station 15. *4 Station 21. | ||||||||
- Freezing period (1960-1980): 21 November-14 May.
- Mixing type: Dimictic.
- Notes on water mixing and thermocline formation
Turnover occurs both in spring and autumn. Lake is thermally stratified both in winter and summer.
E. LAKE WATER QUALITY (7)
E1 TRANSPARENCY [m]| Station 7, 1983-1987 | ||
| Depth [m] | Mar | Aug |
|---|---|---|
| 2.5 | 3.2 | |
| Station 10, 1983-1987 | ||
| 2.3 | 3.2 | |
| Station 15, 1983-1987 | ||
| 2.5 | 3.0 | |
| Station 21, 1983-1987 | ||
| 2.1 | 2.6 | |
| Station 7, 1983-1987 | ||
| Depth [m] | Mar | Aug |
|---|---|---|
| 1 | 6.6 | 6.8 |
| 5 | 6.6 | 6.8 |
| 20 | - | - |
| 25 | - | - |
| 30 | 6.4 | 6.4 |
| 40 | - | - |
| 43 | - | - |
| 50 | - | - |
| 59 | 6.2 | 6.3 |
| Station 10, 1983-1987 | ||
| 1 | 6.2 | 6.7 |
| 5 | 6.2 | 6.7 |
| 20 | - | - |
| 25 | 6.3 | 6.4 |
| 30 | - | - |
| 40 | - | - |
| 43 | - | - |
| 50 | 6.0 | 6.0 |
| Station 15, 1983-1987 | ||
| 1 | 6.6 | 6.7 |
| 5 | 6.6 | 6.7 |
| 20 | 6.3 | 6.6 |
| 25 | - | - |
| 30 | - | - |
| 40 | 6.0 | 6.0 |
| Station 21, 1983-1987 | ||
| 1 | 6.0 | 6.7 |
| 5 | 6.0 | 6.6 |
| 20 | 5.9 | 6.4 |
| 25 | - | - |
| 30 | - | - |
| 40 | - | - |
| 43 | 5.8 | 6.0 |
| Station 7, 1983-1987 | ||
| Depth [m] | Mar | Aug |
|---|---|---|
| 1 | 14.1 | 9.2 |
| 5 | 13.1 | 9.1 |
| 10 | 12.7 | 9.0 |
| 15 | 12.4 | 9.1 |
| 20 | 12.1 | 8.8 |
| 25 | 11.8 | 8.7 |
| 30 | 11.3 | 8.6 |
| 35 | 11.0 | 8.6 |
| 40 | 10.8 | 8.6 |
| 43 | - | - |
| 45 | 10.5 | 8.7 |
| 50 | 10.3 | 8.6 |
| 55 | 9.8 | 8.6 |
| 59 | 9.2 | 8.4 |
| Station 10, 1983-1987 | ||
| 1 | 9.1 | 13.8 |
| 5 | 12.2 | 9.0 |
| 10 | 12.1 | 9.0 |
| 15 | 11.9 | 8.9 |
| 20 | 11.7 | 8.6 |
| 25 | 11.5 | 8.5 |
| 30 | 11.1 | 8.5 |
| 35 | 10.6 | 8.4 |
| 40 | 10.2 | 8.4 |
| 43 | - | - |
| 45 | 8.9 | 8.0 |
| 50 | 5.6 | 7.6 |
| Station 15, 1983-1987 | ||
| 1 | 13.8 | 9.1 |
| 5 | 12.9 | 9.0 |
| 10 | 12.4 | 8.9 |
| 15 | 11.8 | 8.6 |
| 20 | 11.1 | 8.5 |
| 25 | 10.4 | 8.4 |
| 30 | 9.8 | 7.8 |
| 35 | 8.6 | 7.5 |
| 40 | 4.7 | 7.1 |
| Staiton 21, 1983-1987 | ||
| 1 | 11.4 | 9.2 |
| 5 | 11.1 | 9.0 |
| 10 | 10.8 | 9.0 |
| 15 | 10.0 | 8.9 |
| 20 | 9.3 | 8.2 |
| 25 | 8.9 | 7.6 |
| 30 | 8.5 | 7.2 |
| 35 | 7.8 | 7.1 |
| 40 | 7.2 | 6.6 |
| 43 | 4.5 | 6.6 |
-
Determined by KMnO4 method.
| Station 7, 1983-1987 | ||
| Depth [m] | Mar | Aug |
|---|---|---|
| 1 | 9.0 | 8.0 |
| 5 | 8.3 | 7.7 |
| 20 | - | - |
| 25 | - | - |
| 30 | 7.8 | 7.9 |
| 40 | - | - |
| 43 | - | - |
| 50 | - | - |
| 59 | 7.5 | 7.8 |
| Station 10, 1983-1987 | ||
| 1 | 11.3 | 8.5 |
| 5 | 11.6 | 8.5 |
| 20 | - | - |
| 25 | 8.7 | 8.3 |
| 30 | - | - |
| 40 | - | - |
| 43 | 8.1 | 8.6 |
| Station 15, 1983-1987 | ||
| 1 | 9.4 | 8.8 |
| 5 | 8.9 | 8.8 |
| 20 | 9.4 | 8.8 |
| 25 | - | - |
| 30 | - | - |
| 40 | 9.1 | 9.6 |
| Station 21, 1983-1987 | ||
| 1 | 11.2 | 9.3 |
| 5 | 11.6 | 9.4 |
| 20 | 12.6 | 9.5 |
| 25 | - | - |
| 30 | - | - |
| 40 | - | - |
| 43 | 11.4 | 12.6 |
| Station 7, 1983-1987 | |
| Depth [m] | Aug |
|---|---|
| 0-2 | 3.2 |
| Station 10, 1983-1987 | |
| 0-2 | 3.3 |
| Station 15, 1983-1987 | |
| 0-2 | 3.3 |
| Station 21, 1983-1987 | |
| 0-2 | 6.0 |
- Total-N [mg l-1]
| Station 7, 1983-1987 | ||
| Depth [m] | Mar | Aug |
|---|---|---|
| 1 | 0.51 | 0.47 |
| 5 | 0.44 | 0.44 |
| 20 | - | - |
| 25 | - | - |
| 30 | 0.44 | 0.44 |
| 40 | - | - |
| 43 | - | - |
| 50 | - | - |
| 59 | 0.49 | 0.46 |
| Station 10, 1983-1987 | ||
| 1 | 0.40 | 0.44 |
| 5 | 0.38 | 0.42 |
| 20 | - | - |
| 25 | 0.39 | 0.41 |
| 30 | - | - |
| 40 | - | - |
| 43 | - | - |
| 50 | 0.44 | 0.44 |
| Station 15, 1983-1987 | ||
| 1 | 0.52 | 0.50 |
| 5 | 0.48 | 0.51 |
| 20 | 0.51 | 0.51 |
| 25 | - | - |
| 30 | - | - |
| 40 | - | - |
| 43 | - | - |
| 50 | 0.55 | 0.58 |
| Station 21, 1983-1987 | ||
| 1 | 0.38 | 0.36 |
| 5 | 0.41 | 0.37 |
| 20 | 0.41 | 0.37 |
| 25 | - | - |
| 30 | - | - |
| 40 | - | - |
| 43 | 0.43 | 0.47 |
- Total-P [mg l-1]
| Station 7, 1983-1987 | ||
| Depth [m] | Mar | Aug |
|---|---|---|
| 1 | 0.007 | 0.009 |
| 5 | 0.007 | 0.008 |
| 20 | - | - |
| 25 | - | - |
| 30 | 0.008 | 0.008 |
| 40 | - | - |
| 43 | - | - |
| 50 | - | - |
| 59 | 0.013 | 0.010 |
| Station 10, 1983-1987 | ||
| 1 | 0.008 | 0.009 |
| 5 | 0.008 | 0.008 |
| 20 | - | - |
| 25 | 0.008 | 0.008 |
| 30 | - | - |
| 40 | - | - |
| 43 | - | - |
| 50 | 0.029 | 0.015 |
| Station 15, 1983-1987 | ||
| 1 | 0.009 | 0.012 |
| 5 | 0.009 | 0.011 |
| 20 | 0.013 | 0.012 |
| 25 | - | - |
| 30 | - | - |
| 40 | 0.049 | 0.022 |
| Station 21, 1983-1987 | ||
| 1 | 0.010 | 0.012 |
| 5 | 0.009 | 0.013 |
| 20 | 0.014 | 0.013 |
| 25 | - | - |
| 30 | - | - |
| 40 | - | - |
| 43 | 0.034 | 0.020 |
Oxygen saturation degree [%] and total phosphorus concentration [micro l-1] at 2 stations.
F. BIOLOGICAL FEATURES
F1 FLORA (8)- Phytoplankton
Chlamydomonus spp., Monoraphidium confortum, M. dykowskii, Scenedesmus spp., Tabellaria flocculosa, T. fenestrata, Melosira sp., Mallomonas sp., Synura sp., Dinobryon sp., Merismopedia warmingiana, Anabaena flos-aquae, Aphanizomenon gracile.
- Benthos (8)
Insecta (Dicrotenipeds pulsus, Glyptotendipens spp., Polypedilum pullum, Chaoborus flavicans, Stictochironomus spp., Tanytarsus spp.), Oligochaeta (Limnodrilus hoffmeisteri). - Fish (9, 10)
Perca fluviatilis*, Esox lucius*, Rutilus rutilus, Coregonus albula*, C. mulesum*, C. lavaretus*, Lota lota*, Abramis brama*, Stizostedion lucioperca*, Salmo trutta lacustris*. * Economically important. - Supplementary notes on the biota
Natural spawning areas of the stocks of whitefish, salmon and brown salmon have been destroyed and these fishes are kept in the lake by introducing new populations (implantation). There was an endemic stock of salmon in the lake but it has become extinct.
- Phytoplankton [mg l-1]
Station 131, July 1986 0.5 - Benthos [g m-2]
-
Station 131, May 1986
5 m: 1.0.
15 m: 0.9.
- Annual fish catch [metric tons]
1981: 644. - Fishery products other than fish
Roe of vendace and burbot.
-
The stock of vendace varies annually. The stock was poor in the middle of the 1970's but has increased since.
G. SOCIO-ECONOMIC CONDITIONS
G1 LAND USE IN THE CATCHMENT AREA (3, 11, 12)| 1980 | |||
| Area* [km2] | [%] | ||
|---|---|---|---|
| - Natural landscape | |||
| Woody vegetation | 4,000 | 56.6 | |
| Swamp | 1,920 | 27.2 | |
| - Agricultural land | 433 | 6.1 | |
| - Residential area | ca. 250 | ca. 3.5 | |
| - Others | 387 | 5.5 | |
| - Total | 7,063 | 100 | |
| * Finnish territory only. | |||
- Main types of woody vegetation
Mainly coniferous forests (Pinus sylvestris,Picea abies), partly deciduous forests (Betula sp.). The drainage basin belongs to the northern zone of conifers. - Main types of herbaceous vegetation
In marsh areas various grasses (Poaceae), sedge (Carex sp.) and moss (Sphagnum sp.) are common. - Main kinds of crops: Barley, oat, grass, potato. Crops and grass are grown
for feeding domestic animals. - Levels of fertilizer application on crop fields: Light.
- Trends of change in land use
The area of agricultural land has steadily decreased.
| 1980 | ||
| No. of persons engaged | Main products or major industries | |
|---|---|---|
| Primary industry | 5,660 | Milk, meat, wood |
| Secondary industry | 4,510 | Cardboard, sawed goods, milk products, rubber products |
| Tertiary industry | 8,080 | |
- Numbers of domestic animals in the catchment area
Cattle 25,925, horses 462, goats 65, sheep 680, swine 6,335, poultry 21,400.
| 1984 | |||
| Population | Population density [km-2] | Major cities (population) | |
|---|---|---|---|
| Rural | 41,700 | 5.7 | Lieksa (18,700), |
| Total | 41,700 | 5.7 | Nurmes (11,500) |
H. LAKE UTILIZATION
H1 LAKE UTILIZATION (7, 9, 10, 13)-
Source of water, navigation and transportation (timber floating: 1,200,000 [tyr-1]), sightseeing and tourism, recreation (swimming, sport-fishing, yachting) and fisheries.
| 1984 | |
| Use rate [m3 day-1] | |
|---|---|
| Industrial & power plant | ca. 74,000 |
I. DETERIORATION OF LAKE ENVIRONMENTS AND HAZARDS
I1 ENHANCED SILTATION (Q)- Extent of damage: None.
- Present status: Detected but not serious.
- Main contaminants and their concentrations
| Paalasmaa, 1978-1979 | |
| Name of contaminant | Concentration [ppm (wet wt.)] |
|---|---|
| Fish | |
| Hg | 0.61 |
| Zn | 2.8 |
| Cu | 0.13 |
| Total DDT | 0.006 |
- Food safety standards or tolerance limits for toxic contaminant residue
There are safety standards for the use of fish contaminated with mercury. If the mercury concentration of the fish exceeds 1 mg kg-1, they should not be used for human consumption at all. If the concentration is between 0.5 and 1.0 mg kg-1, the rate of consumption should be less than 0.5 kg a week.
- Nitrogen and phosphorus loadings to the lake [t yr-1]
| 1983 | ||||
| Sources | Industrial | Domestic | Agricultural and natural* | Total* |
|---|---|---|---|---|
| T-N | 10 | 80 | 2,500 | 2,600 |
| T-P | 1.5 | 2.5 | 110 | 114 |
| * The estimate is based on the following values of non.point loading | ||||
| P 16 [kg km-2 yr-1], N 360 [kg km-2 yr-1]. | ||||
J. WASTEWATER TREATMENTS
J1 GENERATION OF POLLUTANTS IN THE CATCHMENT AREA (4, 7)-
c) Limited pollution with wastewater treatment.
- Percentage of municipal population in the catchment area provided with
adequate sanitary facilities (on.site treatment systems) or public sewerage: 54%. - Municipal wastewater treatment systems
No. of tertiary treatment systems: 12 (activated sludge and chemical precipitation). No. of secondary treatment systems: 10 (activated sludge, biological filter, pond and chemical precipitation). No. of other types: Exact figure not available; mainly septic tanks and closed collection wells are becoming common. - Industrial wastewater treatment systems
No. of primary treatment systems: 2.
L. DEVELOPMENT PLANS (7)
-
The lake and its neighbourhood have great potential for recreational utilization. There are plans for constructing special routes for camping and for developing water traffic on the lake.
M. LEGISLATIVE AND INSTITUTIONAL MEASURES FOR UPGRADING LAKE ENVIRONMENTS (Q)
M1 NATIONAL AND LOCAL LAWS CONCERNED- Names of the laws (the year of legislation)
- Water law (1961, revised 1987)
- Responsible authorities
- Ministry of the Environment
- Ministry of Agriculture and Forestry
- National Board of Waters and Environment
- Ministry of the Environment Ministry of Agriculture and Forestry
- National Board of Waters and Environment
N. SOURCES OF DATA
- Questionnaire filled by Messrs. J. Niemi and A. Makela, National Board of Waters and Environment, Helsinki, Finland.
- Maanmittaushallituksen Karttapaino (1976) Peruskartat 1: 20,000. Helsinki, Maanmittaushallituksen kartografinen osasto (In Finnish).
- Jarnefelt, H. (1958) Vesiemme luonnontalous. 325 pp. WSOY, Helsinki (In Finnish).
- National Board of Waters (1979) Integrated Water Resources Development Plan for the North Karelia. Publications of the National Board of Waters 27. 168 pp. Helsinki.
- Kauppi, M. (1986) Pielisen alueen vesiston tila ja siihen vaikuttaneet tekijat. Mimeographed publications of the National Board of Waters, Finland No. 398. 95 pp. Helsinki (In Finnish).
- Kuukausikatsaus Suomen Ilmastoon (1985) Ilmatieteen laitos, Helsinki (In Finnish).
- National Board of Waters, Finland (1983) Hydrological Yearbook 1980. Publications of the Water Research Institute 53. 174 pp. Helsinki.
- Data from the Water and Environment District of North Karelia, Joensuu.
- Holopainen, A.-L. & Turunen, T. (1987) Lieksanjoen ja Monninselan kuormitus, veden laatu, kasviplankton ja pohjaelaimisto vuonna 1986. University of Joensuu, Karelian Institute, Working Papers No. 3/1987. 56 pp. Joensuu (In Finnish).
- Kaijomaa, V.-M., Kokko, H., Makinen, K. & Kokko, T. (1984) Pohjois Karjalan laanin alueellinen kalataloussuunnittelu. Osa II. Saalisvarat. University of Joensuu, Publications of Karelian Institute No. 65. 63 pp. Joensuu (In Finnish).
- Kaijomaa, V.-M., Kokko, H., Makinen, K. & Kokko, T. (1985) Pohjois Karjalan laanin alueellinen kalataloussuunnittelu. Osa III. Kalatalouden nykytila. University of Joensuu, Publications of Karelian Institute, Joensuu (In Finnish).
- Pohjojs-Karjalan Seutukaavaliitto (1974) Pohjois-Karjalan luonnonymparisto. Pohjois-Karjalan seutukaavaliiton julkaisu A 10. 64 pp. Joensuu (In Finnish).
- Pohjois-Karjalan Laaninhallitus (1986) Pohjois-Karjalan laanin tilastokatsaus 1986. 38 pp. Joensuu (In Finnish).
- Pohjois-Karjalan Uittoyhdistys (1985) Pohjois-Karjalan Uittoyhdistyksen toimintakertomus v. 1984. 25 pp. Joensuu (In Finnish).
- Miettinen, V. & Verta, M. (1984) Kloorattujen hiilivetyjen ja raskasmetallien pitoisuuksista kaloissa v. 1978-1979. Alustava raportii. Vesihallituksen monistesarja 227. Helsinki.
- National Board of Waters, Finland (1986) Water Supply and Sewer Systems 31. 12. 1985. Report 279. 261 pp. Helsinki.
- National Board of Waters, Finland (1976) Application of Water Pollution Control Principles. Publications of the National Board of Waters 16. 352 pp. Helsinki.
