
LAKE INARI
A view on the lakeshore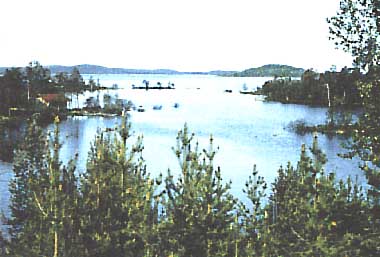
Photo: M. Varjo
A. LOCATION
- Lappi, Finland.
- 68:45-69:15N, 27:00-28:30E; 119 m above sea level.
B. DESCRIPTION
-
Lake Inari is the third largest lake in Finland as measured by surface area. The lake is situated at some distance from industrial centres. Its drainage basin is sparsely populated and is mainly used for reindeer herding. Most of the basin is still in a near-natural state. The main part of Lake Inari drainage basin is situated in the valley of the River Ivalonjoki. The River Lemmenjoki conservation area, which is the largest in Finland, is situated in the drainage basin. The forests are composed mainly of pines and are used as a source of raw material in forest industries. Forests of spruce are rare. In the northern part of the drainage basin there are some barren arctic mountains, with small clusters of arctic birch.
The lake is situated on the border of subarctic and temperate climatic zones and belongs to the sub-boreal vegetation zone and to the palaearctic zoogeographical region. The bedrock of the lake was formed during the Precambrian period and is composed of granite, gneiss and granulite. The dominant mineral soil type is moraine. The lake basin was formed as a result of tectonic movements and is surrounded by seven fault blocks. The lake was not in contact with the ancient Baltic Sea and therefore does not contain marine relics. The nearest marks of the ancient sea level have been found in the area of Saariselka, south of the lake. In ancient times the River Ivalonjoki probably drained into the Baltic Sea.
Lake Inari is the central lake in the drainage basin of the River Paatsjoki. The shoreline is very broken and there are many islands. The major part of the influent water enters the lake through the rivers Juutulanjoki and Ivalonjoki and from the drainage basins of Lake Paatari-Mutusjarvi and the Rivers Vaskojoki, Menesjoki, Lemmenjoki, Kaamasjoki, Yla-Ivalonjoki and Ala- Ivalonjoki. The water from the lake is discharged into Barents Sea through the River Paatsjoki.
The lake is oligotrophic and the quality of water is good. Even in winter under ice cover the oxygen saturation of the hypolimnion is above 80% and of the epilimnion above 90%. Effects of wastewater discharged to the lake from municipalities are observed locally. Typical features of the water quality of the lake are low concentrations of humic substances and nutrients, low values of hardness and colour, and pH close to neutral. Local and temporal differences in water quality are small.
The most important factor affecting the present state of the lake is the hydroelectric power plant constructed in the River Paatsjoki in USSR. This plant started operation in 1934 and it has regulated the water level of Lake Inari ever since. Because of the regulation, the water level of the lake is about 0.5 m higher than in its natural state. The regulation has detrimental effects on the benthic fauna and on fish. The growth and catches of some species of fish, e.g. lake trout and arctic char, have decreased since the beginning of regulation. Efforts have been made to improve the efficiency of fishing in the lake, e.g. by using new types of fishing tackle.
The drainage basin of the lake will probably always be sparsely populated and without major industry. The stress due to tourism will be limited to certain areas in order to protect the lake as a whole (Q).
C. PHYSICAL DIMENSIONS (Q)
| Surface area [km2] | 1,050 |
| Volume [km3] | 15.1 |
| Maximum depth [m] | 96 |
| Mean depth [m] | 14.4 |
| Water level | Regulated |
| Normal range of annual water level fluctuation [m] | 1.5 |
| Length of shoreline [km] | 2,776 |
| Residence time [yr] | 3.4 |
| Catchment area [km2] | ca. 13,400 |
D. PHYSIOGRAPHIC FEATURES
D1 GEOGRAPHICAL (Q)- Sketch map: Fig. EUR-17-01.
- Names of main islands
Mahlatti (21.1 km2), Kaamassaari (20.6 km2) and Levia Petajasaari (9.2 km2). - Number of outflowing rivers and channels (name): 1 (Paatsjoki R.).
- Climatic data at Ivalo, 1961-1980
| Mean temp. [deg C] | ||||||||||||
| Jan | Feb | Mar | Apr | May | Jun | Jul | Aug | Sep | Oct | Nov | Dec | Ann. |
|---|---|---|---|---|---|---|---|---|---|---|---|---|
| -13.9 | -13.6 | -8.5 | -2.5 | 4.1 | 10.9 | 13.5 | 11.2 | 5.8 | -0.8 | -7.1 | -11.6 | -1.0 |
| Precipitation [mm] | ||||||||||||
| 19.9 | 16.4 | 15.6 | 16.8 | 22.2 | 44.2 | 60.8 | 55.3 | 47.3 | 36.3 | 26.8 | 20.9 | 382 |
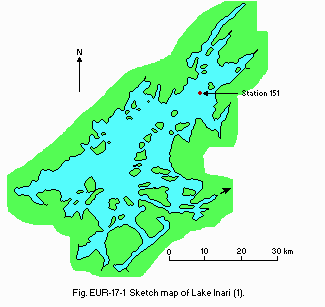
Sketch map (1).
- Water temperature [deg C]
| Inari 151, 1982-1986 | ||||||||||||
| Depth [m] | Jan | Feb | Mar | Apr | May | Jun | Jul | Aug | Sep | Oct | Nov | Dec |
|---|---|---|---|---|---|---|---|---|---|---|---|---|
| 1 | - | - | 0.1 | 0.2 | - | 6.4 | 11.3 | 12.6 | - | - | - | - |
| 5 | - | - | 0.3 | 0.7 | - | 5.5 | 10.0 | 11.6 | - | - | - | - |
| 45 | - | - | 1.3 | 1.9 | - | 4.6 | 6.0 | 7.3 | - | - | - | - |
| B* | - | - | 1.9 | 2.3 | - | 4.3 | 6.0 | 6.7 | - | - | - | - |
| * Bottom. | ||||||||||||
- Freezing period: 10 November-5 June.
- Mixing type: Dimictic.
E. LAKE WATER QUALITY (Q)
E1 TRANSPARENCY [m]| Inari 151, 1982-1986 | ||||||||||||
| Depth [m] | Jan | Feb | Mar | Apr | May | Jun | Jul | Aug | Sep | Oct | Nov | Dec |
|---|---|---|---|---|---|---|---|---|---|---|---|---|
| - | - | 6.7 | - | - | - | 7.0 | 5.6 | - | - | - | - | |
| Inari 151, 1982-1986 | ||||||||||||
| Depth [m] | Jan | Feb | Mar | Apr | May | Jun | Jul | Aug | Sep | Oct | Nov | Dec |
|---|---|---|---|---|---|---|---|---|---|---|---|---|
| 1 | - | - | 7.1 | 7.1 | - | 7.1 | 7.3 | 7.2 | - | - | - | - |
| 5 | - | - | 7.1 | 7.0 | - | 7.1 | 7.3 | 7.3 | - | - | - | - |
| 45 | - | - | 7.0 | 6.9 | - | 7.0 | 7.1 | 7.9 | - | - | - | - |
| B* | - | - | 6.6 | 6.5 | 7.1 | 7.1 | 7.0 | - | - | - | - | - |
| * Bottom. | ||||||||||||
| Inari 151, 1982-1986 | ||||||||||||
| Depth [m] | Jan | Feb | Mar | Apr | May | Jun | Jul | Aug | Sep | Oct | Nov | Dec |
|---|---|---|---|---|---|---|---|---|---|---|---|---|
| 1 | - | - | 13.0 | 14.0 | - | 12.7 | 11.3 | 10.6 | - | - | - | - |
| 5 | - | - | 12.3 | 13.6 | - | 12.8 | 11.6 | 10.6 | - | - | - | - |
| 45 | - | - | 11.6 | 11.8 | - | 12.8 | 12.2 | 11.8 | - | - | - | - |
| B* | - | - | 8.5 | 7.3 | - | 12.8 | 12.0 | 11.7 | - | - | - | - |
| * Bottom. | ||||||||||||
| Inari 151, 1982-1986 | ||||||||||||
| Depth [m] | Jan | Feb | Mar | Apr | May | Jun | Jul | Aug | Sep | Oct | Nov | Dec |
|---|---|---|---|---|---|---|---|---|---|---|---|---|
| 1 | - | - | 3.2 | 3.8 | - | 2.8 | 2.8 | 2.6 | - | - | - | - |
| 5 | - | - | 3.0 | 3.4 | - | 2.6 | 2.8 | 2.4 | - | - | - | - |
| 45 | - | - | 3.0 | 2.6 | - | 2.8 | 2.6 | 2.7 | - | - | - | - |
| B* | - | - | 2.6 | 2.4 | - | 1.3 | 3.4 | 2.3 | - | - | - | - |
| * Bottom. | ||||||||||||
| Inari 151, 1982-1986 | ||||||||||||
| Depth [m] | Jan | Feb | Mar | Apr | May | Jun | Jul | Aug | Sep | Oct | Nov | Dec |
|---|---|---|---|---|---|---|---|---|---|---|---|---|
| 0-2 | - | - | - | - | - | 0.95 | 1.33 | 1.37 | - | - | - | - |
- Total-N [mg l-1]
| Inari 151, 1982-1986 | ||||||||||||
| Depth [m] | Jan | Feb | Mar | Apr | May | Jun | Jul | Aug | Sep | Oct | Nov | Dec |
|---|---|---|---|---|---|---|---|---|---|---|---|---|
| 1 | - | - | 0.28 | 0.31 | - | 0.16 | 0.15 | 0.28 | - | - | - | - |
| 5 | - | - | 0.19 | 0.27 | - | 0.19 | 0.14 | 0.23 | - | - | - | - |
| 45 | - | - | 0.20 | 0.42 | - | 0.19 | - | 0.14 | - | - | - | - |
| B* | - | - | 0.25 | 0.56 | - | 0.21 | 0.14 | 0.20 | - | - | - | - |
| * Bottom. | ||||||||||||
- Total-P [mg l-1]
| Inari 151, 1982-1986 | ||||||||||||
| Depth [m] | Jan | Feb | Mar | Apr | May | Jun | Jul | Aug | Sep | Oct | Nov | Dec |
|---|---|---|---|---|---|---|---|---|---|---|---|---|
| 1 | - | - | 0.005 | 0.007 | - | 0.004 | 0.003 | 0.004 | - | - | - | - |
| 5 | - | - | 0.003 | 0.005 | - | 0.004 | 0.007 | 0.003 | - | - | - | - |
| 45 | - | - | 0.003 | 0.007 | - | 0.003 | 0.007 | 0.005 | - | - | - | - |
| B* | - | - | 0.007 | 0.009 | - | 0.004 | 0.003 | 0.005 | - | - | - | - |
| * Bottom. | ||||||||||||
F. BIOLOGICAL FEATURES
F1 FLORA- Emerged macrophytes (3)
Carex spp., Equisetum fluviatile, Sparganium angustfolium. - Submerged macrophytes (3)
Ranunculus reptans, Subularia aquatica, Potamogeton perfoliatus, P. gramineus, Isoetes sp., Myriophyllum alterniflorum, Nitella sp. - Phytoplankton (4)
Cyclotella glomerata, Flagellata, Dinobryon divertens, Rhizosolenia longiseta, Merismopedia tenuissima (July-August).
- Zooplankton (5)
Tintinnopsis lacustris, Conochilus unicornis, Kellicottia longispina, Keratella cochlearis, Polyarthra vulgaris, Synchaeta spp., Eubosmina longispina obtusirostris, Cyclops spp., Holopedium gibherum, Eudiaptomus spp., Daphnia cristala. - Benthos (3)
Enchytraeidae, Peloscdex ferox, Tanytarsus spp., Procladius spp., Pisidium sp., Heterotrissochadius maari, Stempellinella brevis, Sergentia sp., Gammarus lacustris, Lumbriculus variegatus, Stictoch rosenscholdi, Lymnaea sp. - Fish (3)
Salmo salar sebago*, Salmo trutta lacustris*, Salvelinus alpinus*, S. namaycush*, Thymallus thymallus, Coregonus lavaretus*, Coregonus muksun*, Coregonus albula*, Lota lota, Pygosteus pungitius, Gasterosteus aculeatus, Phoxinus phoxinus. * Economically important.
- Zooplankton [kg (wet wt.) ha-1 yr-1](5)
1977-1979 Munvaissaari: 24. Roiro: 34. Vayla: 25. - Phytoplankton [kg (wet wt.) l-1](4)
Summer 1974: 0.21.
- Annual fish catch [metric tons]
1986: 137.2.
-
Vendace (Coregonus albula) was introduced to the lake in the 1960's. It hasgrown well and is at present one of the most important species in fish catch. In addition brown trout (Salmo trutta) arctic char (Salvelinus namaycush) and whitefish (Coregonus sp.) have been introduced to the lake.
G. SOCIO-ECONOMIC CONDITIONS (Q)
G1 LAND USE IN THE CATCHMENT AREA| Area [km2] | [%] | |
|---|---|---|
| - Natural landscape | ||
| Woody vegetation | 13,592.39 | 89.1 |
| Swamp | 1,650.32 | 10.8 |
| - Agricultural land | 4.03 | 0.02 |
| - Residential area | 12.00 | 0.08 |
| - Total | 15,258.74 | 100 |
- Levels of fertilizer application on crop fields: Light.
- Trends of change in land use: Holiday cottages are increasing fast.
| No. of persons engaged | No. of establishments | Main products or major industries | |
|---|---|---|---|
| - Primary industry | |||
| Animal husbandry | 40 | 25 | Milk products, |
| Fisheries | 50-60 | meat | |
| Reindeer herding | 800 | ||
| - Secondary industry | 800 | ||
| - Tertiary industry | 2,240 |
- Numbers of domestic animals in the catchment area
Cattle 200, horse 6, sheep 104, poultry 20, semi-domestic reindeers ca. 40,000.
| Population | Population density [km-2] | Major cities (population) | |
|---|---|---|---|
| Rural | ca. 6,800 | 0.47 | None |
H. LAKE UTILIZATION
H1 LAKE UTILIZATION (7)-
Source of water, navigation and transportation (wood in 1976: 16,400 [km3]),sightseeing and tourism, recreation (sport-fishing, yachting) and fisheries.
| Use rate [m3 day-1] | |
|---|---|
| Domestic | 30 |
I. DETERIORATION OF LAKE ENVIRONMENTS AND HAZARDS (Q)
I1 ENHANCED SILTATION- Extent of damage: None.
- Present status: None.
- Extent of damage: None.
J. WASTEWATER TREATMENTS (Q)
J1 GENERATION OF POLLUTANTS IN THE CATCHMENT AREA-
b) No sources of significant pollution.
| [%] | |
|---|---|
| Non-point sources | 2 |
| Point sources | 98 |
| Total | 100 |
- Percentage of municipal population in the catchment area provided with
adequate sanitary facilities (on-site treatment systems) or public sewerage: 92%. - Percentage of rural population with adequate sanitary facilities (on-site
treatment systems): 95%. - Municipal wastewater treatment systems
No. of secondary treatment systems: 3 (activated sludge, chemical coagulation).
L. DEVELOPMENT PLANS (Q)
-
Tourism, use for recreation purposes and fishing are increasing. Especiallytrailing of Coregonus albula is becoming an important branch of professional fishing.
N. SOURCES OF DATA
- Questionnaire filled by Messrs. J. Niemi and A. Makela, National Board of Waters and Environment, Helsinki, Finland.
- John Bartholomew & Son Ltd. (1985) The Times Atlas of the World, P
