
LAKE VANERN
An aerial view of the lake in Country of Varmland
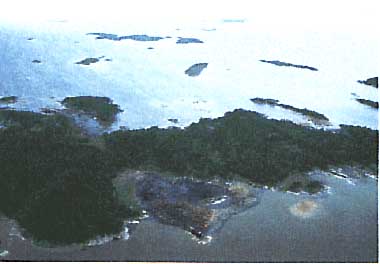
Photo: L. Furuholm
A. LOCATION
- Varmlands, Alvsborgs and Skaraborgs, Sweden.
- 58:22-59:25N, 12:19-14:10E; 44 m above sea level.
B. DESCRIPTION
Lake Vanern is the largest lake of Sweden
and the fourth largest lake of Europe. It is situated in a region
with Archaean rocks, but the deposits in the drainage area mainly
consist of moraines poor in nutrients. A rift zone of north-south
extension divides the lake into two major basins, Varmlandssjon
and Dalbosjon. The numerous small islands form a considerable
archipelago in relation to the open water areas. The good water
exchange between the archipelago zone and the open water is,
however, decisive for the generally extensive spreading of pollutants.
The main problems associated with water quality
in the lake are due to outlets from pulp mills mainly localized
on the northern shore of Varmlandssjon. Effluents from these
industries contain high concentrations of organic material with
lignin components and contribute to the brownish colour of the
water. Pollution of another kind is discharged from a chlor-alkaline
plant situated in one of the northern bays of Varmlandssjon.
This factory caused serious mercury contamination of water, sediments
and fish.
Lake Vanern is of special interest since it
is large enough for geostrophic currents to occur, and this phenomenon
has been measured in the basin of Varmlandssjon (Kvarnas, 1975).
The circulation is anticlockwise and lasts throughout the summer.
The vertical transports in the lake are of little importance.
Twice a year, however, in spring and autumn, the water masses
are totally mixed, but in the summer a thermocline is established.
In the spring the heating of water is fastest in the shallow
areas and therefore a zone with warmer water appears around the
margins of the lake. This thermal bar temporarily retards the
water exchange between the coastal zone and the open lake, resulting
in an obvious quality difference between these two areas.
There are more than one hundred tributaries,
the main one flowing into the northern part. Lake Vanern drains
into the Kattegat (the Atlantic) via the Gota River and the drainage
area of these two bodies cover 10% of the total area of Sweden.
C. PHYSICAL DIMENSIONS (Q, 2, 3)
| Surface area [km2] | 5,648 |
| Volume [km3] | 153 |
| Maximum depth [m] | 106 |
| Mean depth [m] | 27.0 |
| Water level | Regulated |
| Normal range of annual water level fluctuation [m] | 1.7 |
| Length of shoreline [km] | 1,940 |
| Residence time [yr] | 9.0 |
| Catchment area [km2] | 41,182 |
D. PHYSIOGRAPHIC FEATURES
D1 GEOGRAPHICAL (Q)
- Bathymetric map: Fig. EUR-16-01.
- Names of main islands: Djuro and Fagelo.
- Number of outflowing rivers and channels (name): 1 (Gota R.).
D2 CLIMATIC (4)
- Climatic data at Karlstad, 1931-1960
| Mean temp. [deg C] | ||||||||||||
| Jan | Feb | Mar | Apr | May | Jun | Jul | Aug | Sep | Oct | Nov | Dec | Ann. |
|---|---|---|---|---|---|---|---|---|---|---|---|---|
| -4.5 | -4.4 | -1.4 | 4.0 | 10.0 | 14.5 | 17.2 | 15.9 | 11.6 | 6.5 | 2.1 | -1.1 | 5.9 |
| Precipitation [mm] | ||||||||||||
| 40 | 25 | 22 | 39 | 35 | 48 | 60 | 78 | 68 | 62 | 67 | 50 | 594 |
- Number of hours of bright sunshine (1931-1960): 1,800-2,000 hr yr-1.
Bathymetric map [m].
- Water temperature [deg C]
| Mergrundet, 1981-1985 | ||||||||||||
| Depth [m] | Jan | Feb | Mar | Apr | May | Jun | Jul | Aug | Sep | Oct | Nov | Dec |
|---|---|---|---|---|---|---|---|---|---|---|---|---|
| 0 | - | - | - | - | 3.8 | 10.4 | 15.9 | 17.3 | 14.0 | 10.7 | - | - |
| 10 | - | - | - | - | 3.2 | 8.6 | 13.1 | 16.3 | 13.7 | 10.7 | - | - |
| 20 | - | - | - | - | 3.1 | 6.6 | 8.1 | 10.3 | 13.4 | 10.6 | - | - |
| 30 | - | - | - | - | 3.1 | 5.8 | 6.5 | 7.8 | 10.5 | 10.6 | - | - |
| 50 | - | - | - | - | 3.1 | 5.0 | 5.9 | 7.1 | 8.0 | 10.6 | - | - |
| 70 | - | - | - | - | 3.2 | 4.8 | 5.7 | 6.5 | 7.2 | 10.4 | - | - |
- Freezing period (1984-1985): None.
- Mixing type: Dimictic.
E. LAKE WATER QUALITY (Q)
E1 TRANSPARENCY [m]
| Mergrundet, 1981-1985 | ||||||||||||
| Depth [m] | Jan | Feb | Mar | Apr | May | Jun | Jul | Aug | Sep | Oct | Nov | Dec |
|---|---|---|---|---|---|---|---|---|---|---|---|---|
| - | - | - | - | 4.4 | 4.8 | 4.8 | 4.8 | 5.2 | 4.4 | - | - | |
E2 pH
| Mergrundet, 1981-1985 | ||||||||||||
| Depth [m] | Jan | Feb | Mar | Apr | May | Jun | Jul | Aug | Sep | Oct | Nov | Dec |
|---|---|---|---|---|---|---|---|---|---|---|---|---|
| 0 | - | - | - | - | 7.2 | 7.4 | 7.1 | 7.3 | 7.3 | 7.3 | - | - |
| 10 | - | - | - | - | 7.2 | 7.3 | 7.1 | 7.3 | 7.3 | 7.3 | - | - |
| 20 | - | - | - | - | 7.2 | 7.3 | 7.1 | 7.1 | 7.3 | 7.3 | - | - |
| 30 | - | - | - | - | 7.2 | 7.2 | 7.0 | 7.1 | 7.1 | 7.3 | - | - |
| 50 | - | - | - | - | 7.2 | 7.2 | 7.1 | 7.1 | 7.1 | 7.3 | - | - |
| 70 | - | - | - | - | 7.2 | 7.2 | 7.1 | 7.1 | 7.0 | 7.2 | - | - |
E3 SS [mg l-1]
| Mergrundet, 1981-1985 | ||||||||||||
| Depth [m] | Jan | Feb | Mar | Apr | May | Jun | Jul | Aug | Sep | Oct | Nov | Dec |
|---|---|---|---|---|---|---|---|---|---|---|---|---|
| 0 | - | - | - | - | 1.0 | 1.2 | 0.5 | 0.6 | 0.7 | 0.9 | - | - |
| 10 | - | - | - | - | 0.8 | - | - | - | 1.0 | 1.3 | - | - |
| 20 | - | - | - | - | 0.8 | - | - | - | 0.7 | 1.0 | - | - |
| 30 | - | - | - | - | 0.8 | - | - | - | 0.8 | 1.2 | - | - |
| 50 | - | - | - | - | 0.8 | - | - | - | 1.1 | 1.2 | - | - |
| 70 | - | - | - | - | 0.9 | - | - | - | 1.3 | 1.9 | - | - |
E4 DO [mg l-1]
| Mergrundet, 1981-1985 | ||||||||||||
| Depth [m] | Jan | Feb | Mar | Apr | May | Jun | Jul | Aug | Sep | Oct | Nov | Dec |
|---|---|---|---|---|---|---|---|---|---|---|---|---|
| 0 | - | - | - | - | 13.4 | 11.3 | 10.2 | 9.3 | 10.6 | 10.1 | - | - |
| 10 | - | - | - | - | 13.4 | 11.6 | 10.4 | 9.5 | 9.8 | 10.1 | - | - |
| 20 | - | - | - | - | 13.4 | 12.2 | 11.3 | 10.3 | 9.7 | 10.3 | - | - |
| 30 | - | - | - | - | 13.4 | 12.4 | 11.5 | 11.0 | 10.0 | 10.0 | - | - |
| 50 | - | - | - | - | 13.4 | 12.6 | 11.5 | 11.2 | 10.7 | 10.6 | - | - |
| 70 | - | - | - | - | 13.5 | 12.4 | 11.5 | 11.3 | 10.4 | 10.0 | - | - |
E5 COD [mg l-1] Determined by KMnO4 method.
| Mergrundet, 1981-1985 | ||||||||||||
| Depth [m] | Jan | Feb | Mar | Apr | May | Jun | Jul | Aug | Sep | Oct | Nov | Dec |
|---|---|---|---|---|---|---|---|---|---|---|---|---|
| 0 | - | - | - | - | 21.0 | 20.5 | 21.7 | 21.8 | 19.4 | 20.4 | - | - |
| 10 | - | - | - | - | 21.4 | 20.1 | 21.3 | 20.9 | 19.3 | 19.7 | - | - |
| 20 | - | - | - | - | 21.8 | 19.4 | 21.6 | 20.6 | 18.7 | 20.3 | - | - |
| 30 | - | - | - | - | 22.3 | 19.3 | 20.9 | 20.2 | 18.6 | 20.3 | - | - |
| 50 | - | - | - | - | 21.5 | 19.4 | 20.5 | 20.1 | 18.4 | 19.8 | - | - |
| 70 | - | - | - | - | 21.1 | 19.4 | 20.7 | 21.0 | 19.1 | 19.6 | - | - |
E6 CHLOROPHYLL CONCENTRATION [micro l-1]
| Mergrundet, 1981-1985 | ||||||||||||
| Depth [m] | Jan | Feb | Mar | Apr | May | Jun | Jul | Aug | Sep | Oct | Nov | Dec |
|---|---|---|---|---|---|---|---|---|---|---|---|---|
| 0 | - | - | - | - | 1.9 | 2.9 | 2.2 | 1.8 | 1.4 | 1.0 | - | - |
| 10 | - | - | - | - | 2.1 | 2.0 | 1.7 | 1.3 | 1.4 | 1.0 | - | - |
| 20 | - | - | - | - | 2.1 | 1.6 | 1.0 | 0.5 | 1.1 | 1.0 | - | - |
| 30 | - | - | - | - | 1.9 | 1.2 | 0.6 | 0.4 | 0.6 | 0.9 | - | - |
| 50 | - | - | - | - | - | - | - | - | - | - | - | - |
| 70 | - | - | - | - | - | - | - | - | - | - | - | - |
E7 NITROGEN CONCENTRATION
- Total-N [mg l-1]
| Mergrundet, 1981-1985 | ||||||||||||
| Depth [m] | Jan | Feb | Mar | Apr | May | Jun | Jul | Aug | Sep | Oct | Nov | Dec |
|---|---|---|---|---|---|---|---|---|---|---|---|---|
| 0 | - | - | - | - | 0.853 | 0.860 | 0.844 | 0.842 | 0.807 | 0.868 | - | - |
| 10 | - | - | - | - | 0.832 | 0.832 | 0.864 | 0.866 | 0.836 | 0.841 | - | - |
| 20 | - | - | - | - | 0.835 | 0.866 | 0.848 | 0.868 | 0.841 | 0.839 | - | - |
| 30 | - | - | - | - | 0.830 | 0.847 | 0.835 | 0.876 | 0.866 | 0.850 | - | - |
| 50 | - | - | - | - | 0.829 | 0.845 | 0.851 | 0.873 | 0.871 | 0.831 | - | - |
| 70 | - | - | - | - | 0.833 | 0.856 | 0.898 | 0.859 | 0.845 | 0.842 | - | - |
E8 PHOSPHORUS CONCENTRATION
- Total-P [mg l-1]
| Mergrundet, 1981-1985 | ||||||||||||
| Depth [m] | Jan | Feb | Mar | Apr | May | Jun | Jul | Aug | Sep | Oct | Nov | Dec |
|---|---|---|---|---|---|---|---|---|---|---|---|---|
| 0 | - | - | - | - | 0.010 | 0.010 | 0.008 | 0.009 | 0.011 | 0.009 | - | - |
| 10 | - | - | - | - | 0.010 | 0.008 | 0.008 | 0.008 | 0.009 | 0.008 | - | - |
| 20 | - | - | - | - | 0.010 | 0.008 | 0.008 | 0.008 | 0.008 | 0.008 | - | - |
| 30 | - | - | - | - | 0.010 | 0.009 | 0.009 | 0.008 | 0.008 | 0.009 | - | - |
| 50 | - | - | - | - | 0.009 | 0.008 | 0.009 | 0.009 | 0.009 | 0.008 | - | - |
| 70 | - | - | - | - | 0.011 | 0.009 | 0.010 | 0.009 | 0.009 | 0.009 | - | - |
F. BIOLOGICAL FEATURES
F1 FLORA (Q)
- Phytoplankton
Melosira islandica, Asterionella formosa, Tabellaria flocculosa v. asterionelloides, Diatoma elongatum, Rhodomonas lacustris, Cryptomonas spp., Uroglena spp., Anabaena flos-aquae, Aphanizomenon flos-aquae.
F2 FAUNA
- Zooplankton (Q)
Copepoda (Eudiaptomus gracilis, Cyclopidae spp., Eurytemora lacustris), Cladocera (Daphnia cristata, Eubosmina coregoni), Rotatoria (Polyarthra vulgaris, Synchaeta spp., Kellicottia longispina). - Benthos (Q)
Crustacea (Pontoporeia affinis), Oligochaeta (Stylodrilus heringianus, Spirosperma ferox, Limnodrilus profundicola, Tubifex tubifex), Diptera (Heterotrissocladius suspilosus, Paracladopelma obscura, Micropsectra sp., Procladius spp.), Bivalvia (Pisidium conventus). - Fish
Coregonus albula*, Esox lucius*, Lota lota*, Lucioperca lucioperca*. * Economically important. 7F3 PRIMARY PRODUCTION RATE - Gross production [g C m-2 yr-1]
Station Fallbanken, 1976: 20.
F4 BIOMASS: Fig. EUR-06-02 (1).
Seasonal dynamics of phytoplankton [mm3 l-1]
F5 FISHERY PRODUCTS (3)
- Annual fish catch [metric tons]
1975: 540.
G. SOCIO-ECONOMIC CONDITIONS
G1 LAND USE IN THE CATCHMENT AREA* (Q, 5)
| 1981 | |||
| Area [km2] | [%] | ||
|---|---|---|---|
| - Natural landscape | |||
| Woody vegetation | 21,567 | 67.9 | |
| - Agricultural land | 5,879 | 18.5 | |
| - Others | 4,317 | 13.6 | |
| - Total | 31,763 | 100.0 | |
| *The figures concern the Swedish part of the catchment area. About one fifth of the total catchment area is situated in Norway. | |||
- Main types of woody vegetation: Spruce, pine and deciduous forest.
- Main kinds of crops: Wheat, rye and barley.
- Levels of fertilizer application on crop fields: Moderate.
G2 INDUSTRIES IN THE CATCHMENT AREA AND THE LAKE (5)
| 1981 | |||
| No. of persons engaged | No. of establishments | ||
|---|---|---|---|
| - Second industry | |||
| Mines and manufacturing industry | 115,661 | 1,146 | |
| Food stuffs | 7,592 | 86 | |
| Textile | 3,106 | 88 | |
| Wood | 10,056 | 217 | |
| Pulp and paper | 13,323 | 100 | |
| Chemical | 12,295 | 71 | |
| Soil and stone | 3,103 | 65 | |
| Metal products | 9,988 | 29 | |
| Workshop | 55,503 | 466 | |
| - Others | 542 | 14 | |
- Numbers of domestic animals in the catchment area
Cattle 276,200, sheep 48,300, swine 371,900, poultry 1,764,700.
G3 POPULATION IN THE CATCHMENT AREA (5)
| 1980 | |||
| Population | Population density [km-2] | Major cities (population) | |
|---|---|---|---|
| Total | 1,354,200 | 32.9 | Karlstad, Mariestad, Skava, Skovde Vanersborg |
H. LAKE UTILIZATION (Q)
H1 LAKE UTILIZATION
Source of water, navigation and transportation, sightseeing and tourism, recreation (swimming, sport-fishing, yachting) and fisheries.
H2 THE LAKE AS WATER RESOURCE
| About 1985 | |
| Use rate [m3 sec-1] | |
|---|---|
| Domestic | 0.57 |
I. DETERIORATION OF LAKE ENVIRONMENTS AND HAZARDS
I1 ENHANCED SILTATION (Q)
- Extent of damage: None.
I2 TOXIC CONTAMINATION
- Present status (Q): Serious.
- Main contaminants, their concentrations and sources (Q)
| Concentration [ppm] | ||||
|---|---|---|---|---|
| Bottom mud (dry wt.) (before 1977) | Fish*1 (wet wt.) (1976) | Fish*2 (wet wt.) (1981) | Fish*3 (wet wt.) (1987) | |
| Hg | 1.3 | - | - | - |
| Cu | 30 | - | - | - |
| Ni | 28 | - | - | - |
| Pb | 104 | - | - | - |
| Zn | 430 | - | - | - |
| Cr | <50 | - | - | - |
| Cd | 1.4 | - | - | - |
| Total Hg | - | - | 0.6 | 0.8 |
| DDE+DDT+DDD | - | 12 | - | - |
| PCBs | - | 24 | - | - |
| *1 Liver of burbot at Station Sjotorp. | ||||
| *2 Muscle of pike at Station Kattfjorden. | ||||
| *3 Muscle of pike at Station Kilsviken. | ||||
- Food safety standards or tolerance limits for toxic contaminant
residue (Q)
For Hg in fish: 1 ppm. For DDE + DDT + DDD in fish: 5 ppm. For PCBs in liter of fish: 5 ppm. For Cs137 in freshwater fish: 1,500 Bq (1 Ci= 37,000,000,000 Bq). - Supplementary notes (Q, 8)
Number of Bq of Cs137 per kg muscle (wet wt.) of pike caught in 1986 was 15. Concentrations of dioxins were found in 1987.
I3 EUTROPHICATION
- Nuisance caused by eutrophication (Q)
Fouling of gill net: Melosira islandica. - Nitrogen and phosphorus loadings to the lake [t yr-1](3)
| 1981-1985 | |
| Sources | Total |
| T-N | 17,380 |
| T-P | 880 |
I4 ACIDIFICATION (Q)
- Extent of damage: None.
J. WASTEWATER TREATMENTS (Q)
J1 GENERATION OF POLLUTANTS IN THE CATCHMENT AREA
d) Measurable pollution with limited wastewater treatment.
J3 SANITARY FACILITIES AND SEWERAGE
- Percentage of municipal population in the catchment area
provided with
adequate sanitary facilities (on-site treatment systems) or public sewerage: 100%. - Percentage of rural population with adequate sanitary facilities
(on-site
treatment systems): >90%.
K. IMPROVEMENT WORKS IN THE LAKE (Q)
K1 RESTORATION
Weed cutting in small areas.
M. LEGISLATIVE AND INSTITUTIONAL MEASURES FOR UPGRADING LAKE ENVIRONMENTS
M1 NATIONAL AND LOCAL LAWS CONCERNED (9)
- Names of the laws (the year of legislation)
- The Nature Conservation Act (1964)
- The Nature Conservation Ordinance (1976)
- The Environment Protection Act (1969)
- The Environment Protection Ordinance (1981)
- The Act on Chemical Products (1985)
- The Ordinance on Chemical Products (1985)
- The Ordinance Relating to Hazardous Waste (1985)
- The Ordinance on Pesticides (1985)
- The Ordinance on Certain Products Hazardous to Health and to the Environment (1985)
- The Ordinance on PCB etc. (1985)
- The Marine Dumping Prohibition Act (1971)
- The Dumping Ordinance (1971)
- The Act on Measures against Water Pollution from Vessels (1980)
- The Ordinance on Measures against Water Pollution from Vessels (1980)(15) The Act on Sulphur Content in Fuel Oil (1976)
- The Ordinance on Sulphur Content in Fuel Oil (1976)
- The Ordinance on State Grants for the Liming of Lakes and Watercourses (1982)
- The Standing Instructions to the National Swedish Environmental Protection Board (1967)
- The Standing Instructions to the National Franchise Board for Environment Protection (1969)
- The Environment Protection Statutes enacted by the National Swedish Environmental Protection Board are published as from 1977 in the Code of Statutes of the National Swedish Environmental Protection Board, SNFS
- The Health Protection Act (1982)
- The Health Protection Ordinance (1983)
- The Water Act (1983)
- The Water Association Act (1976)
- The Act on Transport of Dangerous Goods (1982)
- The Ordinance on Transport of Dangerous Goods (1982)
- The Act on Fishing Rights (1950)
- The Fisheries Ordinance (1982)
- The Planning and Building Act (1987)
- The Natural Resources Act (1987)
M2 INSTITUTIONAL MEASURES (Q)
- Water Quality Monitoring of Lake Vanern by the Environment Quality Laboratory of the National Swedish Environmental Protection Board, The monitoring program started in 1978, but some stations had been investigated since 1973.
- The County Administrations and the National Swedish Environment Protection Board are responsible for control and restoration.
N. SOURCES OF DATA
- Questionnaire filled by Drs. T. Ahl, B. Karlsson, I. Marelius, H. Olsson, G. Persson, A. Tolstoy, T. Wiederholm and E. Willen, the Environment Quality Laboratory at the National Swedish. Environmental Protection Board, Stockholm, Sweden. l) Willen, E. (1984) The large lakes of Sweden: Vanern, Vattern, Malaren and Hjalmaren. "Ecosystems of the World 23, Lakes and Reservoirs" (ed. Taub, F. B.), pp. 107-134. Elsevier, Amsterdam-Oxford-New York-Tokyo.
- Hakansson, L., Karlsson, B. & Eriksson, S. (1983) Geomorfologiskt sjoregister over Sverige The National Swedish Environmental Protection Board, SNV PM 1650.
- Lundstrom, S. (ed.)(1978) Vanern, en naturresurs. The National Swedish Environmental Protection Board, Stockholm. 372 pp.
- The Swedish Meteorological and Hydrological Institute (1987) Miljostatisk arsbok 1986-1987. Naturmiljon siffror.-Arlov. 224 pp.
- The Swedish Meteorological and Hydrological Institute (1985) Statistik pa avrinningsomraden 1980-1981. Befolkning, Jordbruk oct industri.-Na 11 SM 8501.-Stockholm. 92 pp.
- Hakansson, L. (1977) Sediments as indicators of contamination. Investigations in the four largest Swedish Lakes. The National Swedish Environmental Protection Board, SNV PM 839, 159 pp.
- Andersson, O., Linder, C. E. & Vaz, R. (1984) Levels of organochlorine pesticides, PCBs and certain other organohalogen compounds in fishery products in Sweden, 1976-1982. Var Foda, 36: 1-59. The National Food Administration.
- Results obtained from the National Food Administration, Sweden.
- Names and years of national and local laws obtained from L. Karlstrom, the National Swedish Environmental Protection Board.
