LAKE VATTERN
A view of lakeshore
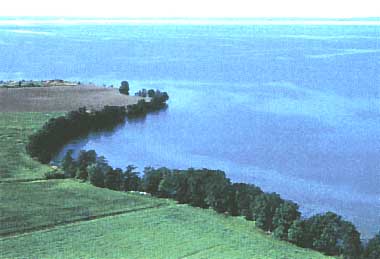
Photo: A. Srensson
A. LOCATION
- Orebro, Skaraborgs, Ostergotlands and Jonkopings, Sweden.
- 57:46-58:52N, 14:07-15:00E; 89 m above sea level.
B. DESCRIPTION
Lake Vattern has an alternately lacustrine and marine postglacial history in the gothiglacial period (12,000-6,000 B. P.) and it passed through an icedammed stage, the Vattern Ice-Lake. Later on it formed a part of the Baltic Ice-Lake, dammed up by the retreating ice-cover. This lake was drained (12,000-6,000 B. P.) and Lake Vattern was converted into a bay of the Yoldia Sea (12,000-6.000 B. P.). Ultimately, the elevation of the landlevel caused Ancient Vattern to become isolated from the sea, but during the Ancylus Period it again established contact with the Baltic. The Baltic at that time was a freshwater lake-the Ancylus Lake. Finally, the Vattern basin was elevated above the surface of the Ancylus Lake and became thus definitely separated as Lake Vattern. This may have happened about 8,000 years ago (Stalberg, 1939).
The basin of Lake Vattern is boat-shaped and is easily affected by changes in wind and atmospheric pressure which results in development of standing waves of from 20 to 25 cm amplitude. Many severe gales occur in the lake due to its shape, which makes it especially sensitive to wind influence. The seiches give rise to strong currents affecting the sedimentation. The distribution of erosion, accumulation and transportational bottoms in Lake Vattern is reflected in the concentration of metals in the sediments. The distribution of these bottom types is also of great importance for the development of bottom fauna. The spawning places of the famous Vattern char (an endemic form of Salvelinus alpinus) is indeed totally dependent on the type of bottom.
The depth, the relatively large water volume, and the transparency of Lake Vattern make it a unique body of water. The ratio of drainage area/lake area is only 2.3, which suggests a low areal loading and hence an oligotrophic status. These properties together with its central position in southern Sweden makes it an extremely good water resource for communities and industries. The lake is also a great natural asset, famous for its beauty.
There are six large and sixteen smaller tributaries to the lake and many small brooks. Lake Vattern discharges into a system of lakes connected to the Baltic via a canal.
C. PHYSICAL DIMENSIONS (Q, 2)
| Surface area [km2] | 1,856 |
| Volume [km3] | 74 |
| Maximum depth [m] | 128 |
| Mean depth [m] | 39.9 |
| Water level | Regulated |
| Length of shoreline [km] | 642 |
| Residence time [yr] | 55.9* |
| Catchment area [km2] | 4,503 |
| * 1981-1985. |
D. PHYSIOGRAPHIC FEATURES
D1 GEOGRAPHICAL (Q)
- Bathymetric map: Fig. EUR-15-01.
- Names of main islands: Visingso.
- Number of outflowing rivers and channels (name): 1 (Motala R.).
D2 CLIMATIC
- Climatic data at Stockholm, 1931-1960 (Q)
| Mean temp. [deg C] |
| Jan | Feb | Mar | Apr | May | Jun | Jul | Aug | Sep | Oct | Nov | Dec | Ann. |
| -2.9 | -3.1 | -0.7 | 4.4 | 10.1 | 14.9 | 17.8 | 16.6 | 12.2 | 7.1 | 2.8 | 0.1 | 6.6 |
| Precipitation [mm] |
| 43 | 30 | 26 | 31 | 34 | 45 | 61 | 76 | 60 | 48 | 53 | 48 | 555 |
- Number of hours of bright sunshine: 1,800-2,000 hr yr-1 (3).
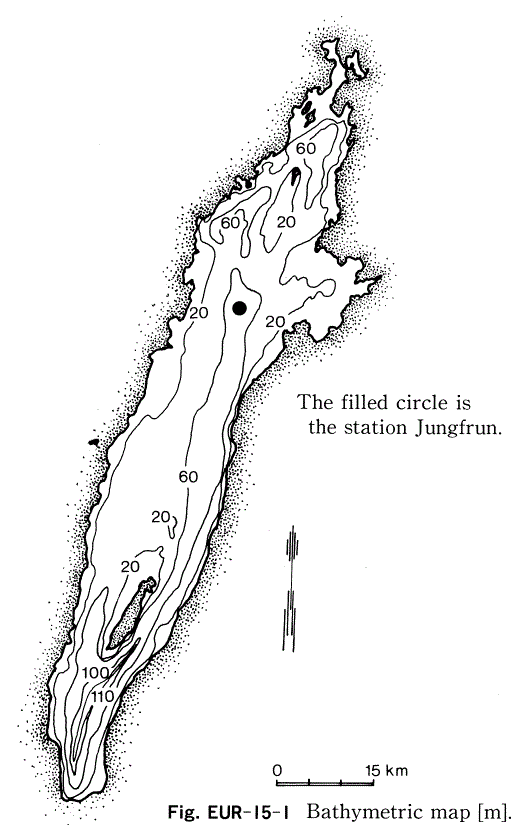
Fig. EUR-15-01
Bathymetric map [m].
- Water temperature [deg C](Q)
| Jungfrun, 1981-1985 |
| Depth [m] | Jan | Feb | Mar | Apr | May | Jun | Jul | Aug | Sep | Oct | Nov | Dec |
| 0 | - | - | - | - | 3.0 | 9.5 | 16.5 | 16.7 | 12.2 | 8.6 | - | - |
| 10 | - | - | - | - | 2.9 | 7.8 | 12.2 | 16.3 | 12.1 | 8.6 | - | - |
| 20 | - | - | - | - | 2.9 | 5.7 | 8.9 | 13.6 | 11.7 | 8.5 | - | - |
| 30 | - | - | - | - | 2.9 | 4.8 | 6.9 | 9.5 | 10.1 | 8.4 | - | - |
| 50 | - | - | - | - | 2.9 | 4.2 | 5.3 | 6.5 | 9.1 | 7.8 | - | - |
| 70 | - | - | - | - | 2.9 | 4.1 | 5.0 | 5.4 | 4.7 | 6.0 | - | - |
| 80 | - | - | - | - | 5.0 | 4.5 | - | - | - | - | - | - |
| 90 | - | - | - | - | 3.2 | 4.4 | - | - | - | - | - | - |
- Freezing period (1984-1985): 77 days (3).
- Mixing type: Dimictic (Q).
E. LAKE WATER QUALITY
E1 TRANSPARENCY [m](Q)
| Jungfrun, 1981-1985 |
| Depth [m] | Jan | Feb | Mar | Apr | May | Jun | Jul | Aug | Sep | Oct | Nov | Dec |
| - | - | - | - | 11.6 | 8.8 | - | 11.3 | 10.2 | 10.5 | 10.5 | - |
E2 pH (Q)
| Jungfrun, 1981-1985 |
| Depth [m] | Jan | Feb | Mar | Apr | May | Jun | Jul | Aug | Sep | Oct | Nov | Dec |
| 0 | - | - | - | 7.7 | 7.7 | 7.7 | 7.5 | 7.7 | 7.5 | - | - | - |
| 10 | - | - | - | 7.7 | 7.7 | 7.8 | 7.6 | 7.8 | 7.6 | - | - | - |
| 20 | - | - | - | 7.7 | 7.7 | 7.6 | 7.6 | 7.8 | 7.6 | - | - | - |
| 30 | - | - | - | 7.7 | 7.6 | 7.6 | 7.5 | 7.6 | 7.6 | - | - | - |
| 50 | - | - | - | 7.7 | 7.6 | 7.6 | 7.4 | 7.6 | 7.6 | - | - | - |
| 70 | - | - | - | 7.7 | 7.6 | 7.5 | 7.5 | 7.4 | 7.5 | - | - | - |
| 80 | - | - | - | - | 7.7 | - | 7.3 | - | - | - | - | - |
| 90 | - | - | - | 7.7 | - | - | 7.5 | - | - | - | - | - |
E4 DO [mg l-1](Q)
| Jungfrun, 1981-1985 |
| Depth [m] | Jan | Feb | Mar | Apr | May | Jun | Jul | Aug | Sep | Oct | Nov | Dec |
| 0 | - | - | - | - | 12.8 | 11.4 | 10.3 | 9.4 | 10.1 | 7.6 | - | - |
| 10 | - | - | - | - | 12.9 | 11.5 | 11.9 | 9.4 | 9.9 | 13.9 | - | - |
| 20 | - | - | - | - | 12.9 | 11.9 | 11.9 | 10.1 | 10.1 | 10.7 | - | - |
| 30 | - | - | - | - | 12.5 | 11.8 | 12.3 | 11.2 | 10.4 | 10.4 | - | - |
| 50 | - | - | - | - | 12.6 | 12.3 | 12.8 | 11.9 | 10.6 | 12.9 | - | - |
| 70 | - | - | - | - | 12.7 | 12.7 | 12.6 | 12.2 | 12.1 | 11.3 | - | - |
| 80 | - | - | - | - | - | - | - | 12.2 | 11.6 | - | - | - |
| 90 | - | - | - | - | 12.7 | - | - | 11.7 | - | - | - | - |
E5 COD [mg l-1](Q)
Determined by KMnO4 method.
| Jungfrun, 1981-1985 |
| Depth [m] | Jan | Feb | Mar | Apr | May | Jun | Jul | Aug | Sep | Oct | Nov | Dec |
| 0 | - | - | - | - | 6.7 | 8.4 | 8.1 | 7.2 | 6.9 | 7.5 | - | - |
| 10 | - | - | - | - | 6.4 | 7.3 | 7.4 | 7.6 | 6.3 | 7.3 | - | - |
| 20 | - | - | - | - | 6.3 | 6.9 | 7.8 | 7.6 | 6.8 | 8.1 | - | - |
| 30 | - | - | - | - | 6.4 | 7.4 | 6.4 | 6.7 | 7.5 | 7.1 | - | - |
| 50 | - | - | - | - | 6.3 | 7.3 | 6.3 | 6.6 | 7.0 | 7.1 | - | - |
| 70 | - | - | - | - | 6.6 | 8.5 | 6.5 | 6.9 | 7.7 | 6.7 | - | - |
| 80 | - | - | - | - | - | - | - | 6.6 | 8.4 | - | - | - |
| 90 | - | - | - | - | 6.4 | - | - | 7.2 | - | - | - | - |
E6 CHLOROPHYLL CONCENTRATION [micro l-1](Q)
| Jungfrun, 1981-1985 |
| Depth [m] | Jan | Feb | Mar | Apr | May | Jun | Jul | Aug | Sep | Oct | Nov | Dec |
| 0 | - | - | - | - | 1.0 | 1.6 | 0.7 | 1.0 | 1.0 | 0.7 | - | - |
| 10 | - | - | - | - | 1.1 | 1.8 | 1.3 | 1.0 | 1.0 | 0.7 | - | - |
| 20 | - | - | - | - | 1.1 | 1.4 | 1.2 | 0.9 | 0.8 | 0.6 | - | - |
| 50 | - | - | - | - | 1.1 | 1.2 | 0.7 | 0.8 | 0.7 | 0.6 | - | - |
| 70 | - | - | - | - | - | - | - | - | - | - | - | - |
| 80 | - | - | - | - | - | - | - | - | - | - | - | - |
| 90 | - | - | - | - | - | - | - | - | - | - | - | - |
E7 NITROGEN CONCENTRATION (Q)
| Jungfrun, 1981-1985 |
| Depth [m] | Jan | Feb | Mar | Apr | May | Jun | Jul | Aug | Sep | Oct | Nov | Dec |
| 0 | - | - | - | - | 0.650 | 0.625 | 0.638 | 0.610 | 0.674 | 0.634 | - | - |
| 10 | - | - | - | - | 0.653 | 0.645 | 0.643 | 0.616 | 0.677 | 0.640 | - | - |
| 20 | - | - | - | - | 0.660 | 0.652 | 0.632 | 0.635 | 0.680 | 0.649 | - | - |
| 30 | - | - | - | - | 0.647 | 0.626 | 0.652 | 0.662 | 0.692 | 0.634 | - | - |
| 50 | - | - | - | - | 0.646 | 0.644 | 0.673 | 0.687 | 0.713 | 0.632 | - | - |
| 70 | - | - | - | - | 0.662 | 0.678 | 0.674 | 0.665 | 0.742 | 0.672 | - | - |
| 80 | - | - | - | - | - | 0.620 | - | 0.683 | 0.735 | - | - | - |
| 90 | - | - | - | - | 0.659 | - | - | 0.792 | - | - | - | - |
E8 PHOSPHORUS CONCENTRATION (Q)
| Jungfrun, 1981-1985 |
| Depth [m] | Jan | Feb | Mar | Apr | May | Jun | Jul | Aug | Sep | Oct | Nov | Dec |
| 0 | - | - | - | - | 0.005 | 0.007 | 0.007 | 0.005 | 0.005 | 0.008 | - | - |
| 10 | - | - | - | - | 0.005 | 0.008 | 0.007 | 0.006 | 0.008 | 0.005 | - | - |
| 20 | - | - | - | - | 0.005 | 0.008 | 0.007 | 0.005 | 0.005 | 0.005 | - | - |
| 30 | - | - | - | - | 0.006 | 0.007 | 0.007 | 0.005 | 0.005 | 0.005 | - | - |
| 50 | - | - | - | - | 0.006 | 0.008 | 0.007 | 0.005 | 0.005 | 0.005 | - | - |
| 70 | - | - | - | - | 0.005 | 0.017 | 0.008 | 0.005 | 0.006 | 0.005 | - | - |
| 80 | - | - | - | - | - | 0.010 | - | 0.004 | 0.006 | - | - | - |
| 90 | - | - | - | - | 0.005 | - | - | 0.006 | - | - | - | - |
E1O PAST TRENDS (4)
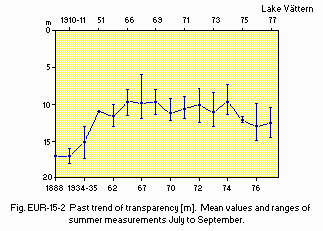
Fig. EUR-15-02
Past trend of transparency [m]. Mean values and ranges of summer measurements July to September.
F. BIOLOGICAL FEATURES
F1 FLORA (Q)
- Phytoplankton
Melosira islandica, Asterionella formosa, Diatoma elongatum, Rhodomonas lacustris, Uroglena spp., Ceratium hirundinella, Gymnodinium uberrimum, Cyclotella comensis, Pseudosphaerocystis lacustris.
F2 FAUNA
- Zooplankton (Q)
Copepoda (Eudiaptomus gracilis, Eurytemora lacustris, Cyclopidae spp.), Cladocera (Eubosmina coregoni, Daphnia cristata), Rotifera (Polyarthra vulgaris, Keratella cochlearis, Kellicottia longispina).
- Benthos (Q)
Crustacea (Pontoporeia affinis), Oligochaeta (Stylodrilus heringianus, Spirosperma forex, Limnodrilus profundicola, Tubifex tubifex), Diptera (Heterotrissocladius suspilosus, Paracladopelma obscura, Micropsectra sp.), Bivalvia (Pisidium conventus).
- Fish (5)
Salvelinus salvelinus*, Coregonus lavaretus*, Salmo salar*. * Economically important.
F3 PRIMARY PRODUCTION RATE [g C m-2 yr-1](Q)
- Gross production
Station Jungfrun, 1978: 40.
F4 BIOMASS: Fig. EUR-15-03.
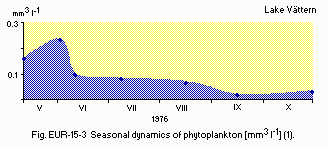
Fig. EUR-15-03
Seasonal dynamics of phytoplankton [mm3 l-1](1).
F5 FISHERY PRODUCTS (5)
- Annual fish catch [metric tons]
1986: 250.
F6 PAST TRENDS (5)
- Annual fish catch [metric tons]
| 1977 | 1978 | 1979 | 1980 | 1981 | 1982 | 1983 | 1984 | 1985 |
| 270.2 | 293.7 | 249.0 | 222.0 | 231.6 | 281.6 | 306.9 | 317.7 | 267.5 |
G. SOCIO-ECONOMIC CONDITIONS
G1 LAND USE IN THE CATCHMENT AREA (8, 6)
| 1981 |
| Area [km2] | [%] |
| - Natural landscape |
| Woody vegetation | 2,276 | 62.9 |
| - Agricultural land | 965 | 26.7 |
| - Others | 377 | 10.4 |
| - Total | 3,618 | 100.0 |
- Main types of woody vegetation: Spruce, pine and deciduous forest.
- Main kinds of crops: Wheat, rye and barley.
- Levels of fertilizer application on crop fields: Moderate.
G2 INDUSTRIES IN THE CATCHMENT AREA AND THE LAKE (6)
| 1981 |
|
| No. of persons engaged | No. of establishments |
| - Secondry industry |
| Mines and manufacturing industry | 25,018 | 319 |
| Food stuffs | 770 | 21 |
| Textile | 540 | 13 |
| Wood | 2,591 | 58 |
| Pulp and paper | 2,677 | 28 |
| Chemical | 838 | 20 |
| Soil and stone | 622 | 11 |
| Metal products | 108 | 3 |
| Workshop | 15,840 | 150 |
| - Others | 550 | 11 |
- Numbers of domestic animals in the catchment area (6)
Cattle 54,200, sheep 7,700, swine 50,500, poultry 322,700.
G3 POPULATION IN THE CATCHMENT AREA (6)
| 1980 |
|
| Population | Population density [km-2] | Major cities (population) |
| Total | 209,200 | 46.5 | Jonkoping, Huskvarna, Motala |
|
H. LAKE UTILIZATION
H1 LAKE UTILIZATION (Q)
Source of water, navigation and transportation, sightseeing and tourism,
recreation (swimming, sport-fishing, yachting) and fisheries.
H2 THE LAKE AS WATER RESOURCE (7)
| 1985 |
| Use rate [m3 sec-1] |
| Domestic | 0.71 |
I. DETERIORATION OF LAKE ENVIRONMENTS AND HAZARDS
I1 ENHANCED SILTATION (Q)
I2 TOXIC CONTAMINATION
- Present status: Serious (Q).
- Main contaminants, their concentrations and sources (Q, 8, 9, 10)
| Concentration [ppm] |
|
| Bottom mud (dry wt.) (before 1977) | Fish*1 (wet wt.) (1976) | Fish*2 (wet wt.) (1982) |
|
| Hg | 0.2 | - | - |
| Cu | 45 | - | - |
| Ni | 40 | - | - |
| Pb | 146 | - | - |
| Zn | 448 | - | - |
| Cr | <50 | - | - |
| Total Hg | - | - | 0.3 |
| DDE+DDT+DDD | - | 4.5 | 0.2 |
| PCBs | - | 7.4 | 0.4 |
| *1 Liter of burbot at Station Jungfrun. |
| *2 Muscle of char at several stations. |
- Food safety standards or tolerance limits for toxic contaminant residue (10)
For Hg in fish: 1 ppm. For DDE + DDT + DDD in fish: 5 ppm. For PCBs in liter of fish: 5 ppm. For Cs137 in freshwater fish: 1500 Bq (1 Ci = 37,000,000,000 Bq).
- Supplementary notes
Few data available. Number of Bq of Cs137 per kg muscle (wet wt.) of whitefish caught in 1986 was 17 and of pike 13. The concentration of dioxins was found in 1987.
I3 EUTROPHICATION (Q)
- Nuisance caused by eutrophication
Foul smell of tap water: Uroglena spp. Fouling of gill net: Melosira islandica.
- Nitrogen and phosphorus loadings to the lake [t yr-1]
| 1981-1985 |
| Sources | Total |
| T-N | 3,370 |
| T-P | 65 |
I4 ACIDIFICATION (Q)
J. WASTEWATER TREATMENTS (Q)
J1 GENERATION OF POLLUTANTS IN THE CATCHMENT AREA
a) pristine lake environments.
J2 APPROXIMATE PERCENTAGE DISTRIBUTION OF POLLUTANT LOADS
| 1981-1985 |
| N [%] | P [%] |
| Natural background from ground | 18 | 34 |
| Atmospheric deposition | 39 | 15 |
| Municipal and industrial sources | 15 | 28 |
| Cultivated fields and other lands minus background | 28 | 23 |
| Total | 100 | 100 |
J3 SANITARY FACILITIES AND SEWERAGE
- Percentage of municipal population in the catchment area provided with
adequate sanitary facilities (on-site treatment systems) or public sewerage: 100%.
- Percentage of rural population with adequate sanitary facilities (on-site
treatment systems): 90%.
M. LEGISLATIVE AND INSTITUTIONAL MEASURES FOR UPGRADING LAKE ENVIRONMENTS
M1 NATIONAL AND LOCAL LAWS CONCERNED (11)
- Names of the laws (the year of legislation)
- The Nature Conservation Act (1964)
- The Nature Conservation Ordinance (1976)
- The Environment Protection Act (1969)
- The Environment Protection Ordinance (1981)
- The Act on Chemical Products (1985)
- The Ordinance on Chemical Products (1985)
- The Ordinance Relating to Hazardous Waste (1985)
- The Ordinance on Pesticides (1985)
- The Ordinance on Certain Products Hazardous to Health and to the Environment (1985)
- The Ordinance on PCB etc. (1985)
- The Marine Dumping Prohibition Act (1971)
- The Dumping Ordinance (1971)
- The Act on Measures against Water Pollution from Vessels (1980)
- The Ordinance on Measures against Water Pollution from Vessels (1980)
- The Act on Sulphur Content in Fuel Oil (1976)
- The Ordinance on Sulphur Content in Fuel Oil (1976)
- The Ordinance on State Grants for the Liming of Lakes and Watercourses (1982)
- The Standing Institutions to the National Swedish Environmental Protection Board (1967)
- The Standing Instructions to the National Franchise Board for Environment Protection (1969)
- The Environment Protection Statutes enacted by the National Swedish Environmental Protection Board are published as from 1977 in the Code of Statutes of the National Swedish Environmental Protection Board, SNFS
- The Health Protection Act (1982)
- The Health Protection Ordinance (1983)
- The Water Act (1983)
- The Water Association Act (1976)
- The Act on Transport of Dangerous Goods (1982)
- The Ordinance on Transport of Dangerous Goods (1982)
- The Act on Fishing Rights (1950)
- The Fisheries Ordinance (1982)
- The Planning and Building Act (1987)
- The National Resources Act (1987)
M2 INSTITUTIONAL MEASURES (Q)
- Water Quality Monitoring of Lake Vattern by the Environment Quality Laboratory of the National Swedish Environmental Protection Board, The monitoring program started in 1978 but some stations had been investigated since 1966.
- The County Administrations and the National Swedish Environment Protection Board are responsible for control and restoration.
N. SOURCES OF DATA
- Questionnaire filled by Drs. T. Ahl, B. Karlsson, I. Marelius, H. Olsson, G. Persson, A. Tolstoy, T. Wiederholm and E. Willen, the Environment Quality Laboratory at the National Swedish Environmental Protection Board, Stockholm, Sweden.
- Willen E. (1984) The large lakes of Sweden: Vanern, Vattern, Malaren and Hjalmaren. "Ecosystems of the World 23, Lakes and Reservoirs" (ed. Taub, F. B.), pp. 107-134. Elsevier, Amsterdam-Oxford-New York-Tokyo.
- Hakansson, L., Karlsson, B. & Eriksson, S. (1983) Geomorfologiskt sjoegister over Sverige. The National Swedish Environmental Protection Board. SNV PM 1650.
- The Swedish Meteorological and Hydrological Institute (1987) Miljostatistisk arsbok 1986-1987. Naturmilijon i siffror.-Arlov. 224 pp.
- Olsen, P. & Willen, E. (1980) Arch. Hydrobiol., 89: 171-188.
- Information obtained from the Commission of Fishery in the County of Jonkoping.
- The Swedish Meteorological and Hydrological Institute (1985) Statistik pa avrinningsomraden 1980-1981. Befolkning, jordruk och industri.-Na 11 SM 8501.-Stockholm. 92 pp.
- Information obtained from the County of Jonkoping.
- Hakansson. L. (1977) Sediments as Indicators of Contamination. Investigations in the Four Largest Swedish Lakes. The National Swedish Environmental Protection Board. SNV PM 839, 159 pp.
- Andersson, O., Linder, C. E. & Vaz, R. (1984) Levels of organochlorine pesticides, PCBs and certain other organohalogen compounds in fishery products in Sweden, 1976-1982. Var Foda 36: 1-59. The National Food Administration.
- Results obtained from the National Food Administration, Sweden.
- Names and years of national and local laws obtained from L. Karlstrom, the National Swedish Environmental Protection Board.

