
LAKE HJALMAREN
A view of the lakeshore in Country of Orebro
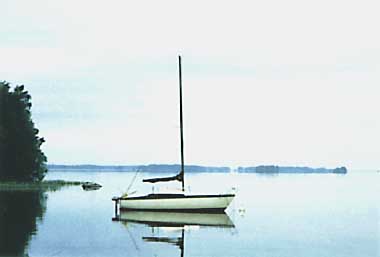
Photo: B. Wiksell
A. LOCATION
- Orebro, Vastmanlands and Sodermanlands, Sweden.
- 59:08-59:18N, 15:13-16:19E; 22.0 m above sea level.
B. DESCRIPTION
Lake Hjalmaren is situated in a region
with Archaean rocks. The deposits around the lake are dominated
by lime-rich clays which makes these areas well suited for cultivation.
Large agricultural areas surrounding the lake contribute to the
nutrient loading of the water.
Lake Hjalmaren is shallow and of eutrophic
character. It consists of four main basins, separated from each
other by islands and narrow sounds. The lake is used as a freshwater
reservoir, as a recipient of sewage water-mainly from the town
Orebro in the westernmost part - and for recreational purposes.
The accelerated eutrophication during the last thirty years has
especially affected the two basins closest to the town Orebro
due to the increased population of the town. The main inflow
runs via the town of Orebro to the westernmost basin. Lake Hjalmaren
drains via the outlet in the easternmost part to Lake Malaren.
An eighteenth-century observer noted that
the water of Lake Hjalmaren was transparent and had a good taste
but got thicker during the heavy gales that frequently occurred.
The thick water included many nutrients and seemed to be good
for the fishes, as they were generally well-fed. Water blooms
were common and lasted from mid-June to late autumn (Uggla Hillebrandsson,
1786).
C. PHYSICAL DIMENSIONS (Q, 2)
| Surface area [km2] | 478 |
| Volume [km3] | 2.9 |
| Maximum depth [m] | 22 |
| Mean depth [m] | 6.1 |
| Water level | Regulated |
| Length of shoreline [km] | 428 |
| Residence time [yr] | 3.3* |
| Catchment area [km2] | 3,575 |
| * 1981-1985. | |
D. PHYSIOGRAPHIC FEATURES
D1 GEOGRAPHICAL (Q)
- Bathymetric map: Fig. EUR-14-01.
- Names of main islands: Vinon (5 km2).
- Number of outflowing rivers and channels (name)
2 (Hyndevadsstom R. and Hjalmare Canal).
D2 CLIMATIC
- Climatic data at Stockholm, 1931-1960 (Q)
| Mean temp. [deg C] | ||||||||||||
| Jan | Feb | Mar | Apr | May | Jun | Jul | Aug | Sep | Oct | Nov | Dec | Ann. |
|---|---|---|---|---|---|---|---|---|---|---|---|---|
| -2.9 | -3.1 | -0.7 | 4.4 | 10.1 | 14.9 | 17.8 | 16.6 | 12.2 | 7.1 | 2.8 | 0.1 | 6.6 |
| Precipitation [mm] | ||||||||||||
| 43 | 30 | 26 | 31 | 34 | 45 | 61 | 76 | 60 | 48 | 53 | 48 | 555 |
- Number of hours of bright sunshine: 1,800-2,000 hr yr-1 (3).
- Solar radiation: 8.9 MJ m-2 day-1.
Bathymetric map [m].
- Water temperature [deg C](Q)
| Storhjalmaren, 1981-1985 | ||||||||||||
| Depth [m] | Jan | Feb | Mar | Apr | May | Jun | Jul | Aug | Sep | Oct | Nov | Dec |
|---|---|---|---|---|---|---|---|---|---|---|---|---|
| 0 | - | - | 0.5 | - | 6.5 | 14.5 | 19.0 | 18.4 | 14.2 | 9.7 | - | - |
| 5 | - | - | 0.8 | - | 6.8 | 15.0 | 18.3 | 19.1 | 14.9 | 9.8 | - | - |
| 10 | - | - | 1.6 | - | 6.6 | 14.7 | 18.1 | 19.0 | 14.9 | 9.6 | - | - |
| 15 | - | - | 2.4 | - | 6.6 | 14.6 | 17.9 | 18.2 | 14.9 | 9.6 | - | - |
- Freezing period (1984-1985): 139 days (3).
- Notes on water mixing and thermocline formation: Not stratifying (3).
E. LAKE WATER QUALITY
E1 TRANSPARENCY [m](Q)
| Storhjalmaren, 1981-1985 | ||||||||||||
| Depth [m] | Jan | Feb | Mar | Apr | May | Jun | Jul | Aug | Sep | Oct | Nov | Dec |
|---|---|---|---|---|---|---|---|---|---|---|---|---|
| - | - | 3.5 | - | 1.5 | 2.6 | 3.0 | 3.3 | 2.1 | 2.3 | - | - | |
E2 pH (Q)
| Storhjalmaren, 1981-1985 | ||||||||||||
| Depth [m] | Jan | Feb | Mar | Apr | May | Jun | Jul | Aug | Sep | Oct | Nov | Dec |
|---|---|---|---|---|---|---|---|---|---|---|---|---|
| 0 | - | - | 7.5 | - | 7.6 | 7.6 | 7.6 | 7.5 | 7.7 | 7.7 | - | - |
| 5 | - | - | 7.6 | - | 7.8 | 7.5 | 7.6 | 7.6 | 7.7 | 7.7 | - | - |
| 10 | - | - | 7.3 | - | 7.8 | 7.6 | 7.5 | 7.7 | 7.8 | 7.5 | - | - |
| 15 | - | - | 7.2 | - | 7.7 | 7.6 | 7.6 | 7.4 | 7.6 | 7.7 | - | - |
E4 DO [mg l-1](Q)
| Storhjalmaren, 1981-1985 | ||||||||||||
| Depth [m] | Jan | Feb | Mar | Apr | May | Jun | Jul | Aug | Sep | Oct | Nov | Dec |
|---|---|---|---|---|---|---|---|---|---|---|---|---|
| 0 | - | - | 13.3 | - | 12.3 | 9.2 | 8.2 | 8.4 | 8.9 | 9.8 | - | - |
| 5 | - | - | 13.1 | - | 12.8 | 8.2 | 8.0 | 8.0 | 9.0 | 10.4 | - | - |
| 10 | - | - | 9.4 | - | 13.4 | 8.6 | 8.2 | 8.2 | 9.0 | 10.4 | - | - |
| 15 | - | - | 7.5 | - | 13.1 | 8.2 | 7.8 | 6.7 | 8.5 | 10.4 | - | - |
E5 COD [mg l-1](Q) Determined by KMnO4 method.
| Storhjalmaren, 1981-1985 | ||||||||||||
| Depth [m] | Jan | Feb | Mar | Apr | May | Jun | Jul | Aug | Sep | Oct | Nov | Dec |
|---|---|---|---|---|---|---|---|---|---|---|---|---|
| 0 | - | - | 25.8 | - | 30.5 | 28.0 | 27.7 | 27.5 | 27.4 | 24.9 | - | - |
| 5 | - | - | 24.4 | - | 23.6 | 24.5 | 38.1 | 23.7 | 25.9 | 21.5 | - | - |
| 10 | - | - | 25.1 | - | 24.1 | 23.7 | 39.6 | 24.1 | 26.6 | 20.9 | - | - |
| 15 | - | - | 25.2 | - | 23.8 | 23.8 | 38.5 | 23.1 | 26.4 | 22.4 | - | - |
E6 CHLOROPHYLL CONCENTRATION [micro l-1](Q)
| Storhjalmaren, 1981-1985 | ||||||||||||
| Depth [m] | Jan | Feb | Mar | Apr | May | Jun | Jul | Aug | Sep | Oct | Nov | Dec |
|---|---|---|---|---|---|---|---|---|---|---|---|---|
| 0 | - | - | 2.2 | - | 19.3 | 7.7 | 7.5 | 12.1 | 18.4 | 11.2 | - | - |
| 5 | - | - | 2.2 | - | 17.5 | 5.9 | 4.7 | 7.7 | 19.9 | 12.6 | - | - |
| 10 | - | - | 2.2 | - | 16.0 | 5.1 | 3.9 | 7.3 | 18.8 | 13.4 | - | - |
| 15 | - | - | 2.1 | - | 15.6 | 4.8 | 3.4 | 4.5 | 17.2 | 13.7 | - | - |
E7 NITROGEN CONCENTRATION (Q)
- Total-N [mg l-1]
| Storhjalmaren, 1981-1985 | ||||||||||||
| Depth [m] | Jan | Feb | Mar | Apr | May | Jun | Jul | Aug | Sep | Oct | Nov | Dec |
|---|---|---|---|---|---|---|---|---|---|---|---|---|
| 0 | - | - | 0.834 | - | 1.008 | 0.874 | 0.719 | 0.628 | 0.721 | 0.621 | - | - |
| 5 | - | - | 0.742 | - | 0.883 | 0.700 | 0.625 | 0.568 | 0.757 | 0.553 | - | - |
| 10 | - | - | 0.849 | - | 1.011 | 0.612 | 0.566 | 0.587 | 0.798 | 0.525 | - | - |
| 15 | - | - | 0.830 | - | 0.922 | 0.715 | 0.545 | 0.609 | 0.804 | 0.675 | - | - |
E8 PHOSPHORUS CONCENTRATION (Q)
- Total-P [mg l-1]
| Storhjalmaren, 1981-1985 | ||||||||||||
| Depth [m] | Jan | Feb | Mar | Apr | May | Jun | Jul | Aug | Sep | Oct | Nov | Dec |
|---|---|---|---|---|---|---|---|---|---|---|---|---|
| 0 | - | - | 0.042 | - | 0.038 | 0.035 | 0.039 | 0.047 | 0.072 | 0.062 | - | - |
| 5 | - | - | 0.041 | - | 0.033 | 0.021 | 0.040 | 0.021 | 0.063 | 0.046 | - | - |
| 10 | - | - | 0.046 | - | 0.025 | 0.029 | 0.036 | 0.021 | 0.076 | 0.056 | - | - |
| 15 | - | - | 0.049 | - | 0.025 | 0.032 | 0.039 | 0.032 | 0.080 | 0.053 | - | - |
E10 PAST TRENDS (1): Fig. EUR-14-02, 03 and 04.
Concentration of chlorophyll a in various basins during the period from 1966 to 1973 (growth season mean value)[micro l-1].
Concentration of Total-N in various basins during the period from 1966 to 1973 (growth season mean value)[mg l-1].
Concentration of Total-P in various basins during the period from 1966 to 1973 (growth season mean value)[mg l-1].
F. BIOLOGICAL FEATURES
F1 FLORA
- Emerged macrophytes: Phragmites australis (4).
- Floating macrophytes: Nuphar luteum (4).
- Phytoplankton (Q)
Actinocyclus normanii f. subsalsa, Melosira islandica, M. granulata, Stephanodiscus rotula, S. hantzchii v. pusillus, Microcystis aeruginosa, Asterionella formosa, Rhodomonas lacustris, Ceratium hirundinella, Gomphosphaeria naegeliana.
F2 FAUNA
- Zooplankton (Q)
Copepoda (Cyclopidae spp., Eudiaptomus gracilis), Cladocera (Chydorus sphaericus, Daphnia cucullata), Rotatoria (Keratella cochlearis, K. quadrata, Kellicottia longispina). - Benthos (Q)
Diptera (Chironomus plumosus, Procladius spp.), Oligochaeta (Potamothrix hammoniensis, Limnodrilus hoffmeisteri), Bivalvia (Pisidium casertanum). - Fish (5)
Lucioperca lucioperca*, Esox lucius*, Anguilla anguilla*, Perca fluviatilis*. * Economically important.
F3 PRIMARY PRODUCTION RATE [g C m-2 yr-1](Q)
- Gross production
Station Storhjalmaren, 1972: 170.
F4 BIOMASS: Fig. EUR-14-05 (1).
a: Seasonal dynamics of phytoplankton in hypereutrophic basin H, 1972. b: Seasonal dynamics of phytoplankton in moderately eutrophic basin S, 1972 [mm3 l-1].
F5 FISHERY PRODUCTS (Q)
- Annual fish catch [metric tons] 1986: 180.
F6 PAST TRENDS: Fig. EUR-14-06, 07 and 08.
Past trend of phytoplankton in various basins during the period from 1966 to 1973 (growth season mean values)[mm3 l-1](1).
Phytoplankton volumes in relation to nutrient loading in different basins (growth season mean values, 1966-1973)[mm3 l-1](1).
Past trend of annual fish catch [metric tons](Q).
G. SOCIO-ECONOMIC CONDITIONS
G1 LAND USE IN THE CATCHMENT AREA (8, 6)
| Area [km2] | [%] | |
|---|---|---|
| Natural landscape Woody vegetation | 1,677 | 51.9 |
| Agricultural land | 821 | 25.4 |
| Others | 733 | 22.7 |
| Total | 3,231 | 100.0 |
- Main types of woody vegetation: Spruce, pine and deciduous forest.
- Main kinds of crops: Wheat, rye and barley.
- Levels of fertilizer application on crop fields: Moderate.
G2 INDUSTRIES IN THE CATCHMENT AREA AND THE LAKE (7)
| 1981 | |||
| No. of persons engaged | No. of establishments | ||
|---|---|---|---|
| - Secondry industry | |||
| Mines and manufacturing industry | 26,095 | 309 | |
| Food stuffs | 2,559 | 25 | |
| Textile | 683 | 20 | |
| Wood | 812 | 18 | |
| Pulp and paper | 2,602 | 37 | |
| Chemical | 592 | 17 | |
| Soil and stone | 967 | 17 | |
| Metal products | 2,117 | 12 | |
| Workshop | 15,228 | 149 | |
| - Others | 315 | 5 | |
- Numbers of domestic animals in the catchment area
Cattle 35,400, sheep 7,300, swine 36,600, poultry 121,600.
G3 POPULATION IN THE CATCHMENT AREA (7)
| 1980 | |||
| Population | Population density [km-2] | Major cities (population) | |
|---|---|---|---|
| Total | 242,200 | 67.7 | Orebro |
H. LAKE UTILIZATION
H1 LAKE UTILIZATION (Q)
Source of water, navigation and transportation, sightseeing and tourism, recreation (swimming, sport-fishing, yachting) and fisheries.
H2 THE LAKE AS WATER RESOURCE (Q)
| About 1985 | |
| Use rate [m3 sec-1] | |
|---|---|
| Domestic | 0.049 |
I. DETERIORATION OF LAKE ENVIRONMENTS AND HAZARDS
I1 ENHANCED SILTATION (Q)
- Extent of damage: Not serious.
I2 TOXIC CONTAMINATION
- Present status: Detected but not serious (Q).
- Main contaminants, their concentrations and sources (9, 10, 11)
| Concentration [ppm] | |||
|---|---|---|---|
| Bottom mud (dry wt.) (before 1977) | Fish*1 (wet wt.) (1976) | Fish*2 (wet wt.) (1985) | |
| Hg | 0.3 | - | - |
| Cu | 50 | - | - |
| Ni | 70 | - | - |
| Pb | 100 | - | - |
| Zn | 153 | - | - |
| Cr | 70 | - | - |
| Total Hg | - | - | 0.3 |
| DDE+DDT+DDD | - | 0.41 | - |
| PCBs | - | 2.6 | - |
| *1 Liver of burbot at Vinon. | |||
| *2 Muscle of pike at several stations. | |||
- Food safety standards or tolerance limits for toxic contaminant
residue (11)
For Hg in fish: 1 ppm. For DDE+DDT+DDD in fish: 5 ppm. For PCBs in liter of fish: 5 ppm. For Cs137 in freshwater fish: 1500 Bq (1 Ci= 3.7x1.0E+10 Bq). - Supplementary notes
Number of Bq of Cs137 per kg muscle (wet wt.) of pike perch caught in 1986 was 18.
I3 EUTROPHICATION
- Nuisance caused by eutrophication (Q)
Unusual algal bloom: Microcystis aeruginosa, Gomphosphaeria naegeliana. Foul smell of tap water: Synura petersenii. Fouling of gill net: Melosira spp. - Nitrogen and phosphorus loadings to the lake [t yr-1](6)
| 1981-1985 | |
|
Sources |
Total |
|---|---|
| T-N | 2,750 |
| T-P | 65 |
I4 ACIDIFICATION (Q)
- Extent of damage: None.
J. WASTEWATER TREATMENTS (Q)
J1 GENERATION OF POLLUTANTS IN THE CATCHMENT AREA
f) Extensive development of the catchment area with provision for municipal wastewater treatment.
J2 APPROXIMATE PERCENTAGE DISTRIBUTION OF POLLUTANT LOADS
| 1981-1985 | ||
| N [%] | P [%] | |
|---|---|---|
| Natural background from ground | 18 | 24 |
| Atmospheric deposition | 10 | 4 |
| Municipal and industrial sources | 11 | 19 |
| Cultured fields minus background | 57 | 49 |
| Other fields minus background | 4 | 4 |
| Total | 100 | 100 |
J3 SANITARY FACILITIES AND SEWERAGE
- Percentage of municipal population in the catchment area
provided with
adequate sanitary facilities (on.site treatment systems) or public sewerage: 100%. - Percentage of rural population with adequate sanitary facilities
(on-site
treatment systems): >90%.
K. IMPROVEMENT WORKS IN THE LAKE (Q)
K1 RESTORATION
Weed cutting in small areas.
M. LEGISLATIVE AND INSTITUTIONAL MEASURES FOR UPGRADING LAKE ENVIRONMENTS
M1 NATIONAL AND LOCAL LAWS CONCERNED (12)
- Names of the laws (the year of legislation)
- The Nature Conservation Act (1964)
- The Nature Conservation Ordinance (1976)
- The Environment Protection Act (1969)
- The Environment Protection Ordinance (1981)
- The Act on Chemical Product (1985)
- The Ordinance on Chemical Products (1985)
- The Ordinance Relating to Hazardous Waste (1985)
- The Ordinance on Pesticides (1985)
- The Ordinance on Certain Products Hazardous to Health and to the Environment (1985)
- The Ordinance on PCB etc (1985)
- The Marine Dumping Prohibition Act (1971)
- The Dumping Ordinance (1971)
- The Act on Measures against Water Pollution from Vessels (1980)
- The Ordinance on Measures against Water Pollution from Vessels (1980)
- The Act on Sulphur Content in Fuel Oil (1976)
- The Ordinance on Sulphur Content in Fuel Oil (1976)
- The Ordinance on State Grants for the Liming of Lakes and Watercourses (1982)
- The Standing Instructions to the National Swedish Environmental Protection Board (1967)
- The Standing Instructions to the National Franchise Board for Environment Protection (1969)
- The Environment Protection Statutes enacted by the National Swedish Environmental Protection Board are published as from 1977 in the Code of Statutes of the National Swedish Environmental Protection Board, SNFS
- The Health Protection Act (1982)
- The Health Protection Ordinance (1983)
- The Water Act (1983)
- The Water Association Act (1976)
- The Act on Transport of Dangerous Goods (1982)
- The Ordinance on Transport of Dangerous Goods (1982)
- The Act on Fishing Rights (1950)
- The Fisheries Ordinance (1982)
- The Planning and Building Act (1987)
- The National Resources Act (1987)
M2 INSTITUTIONAL MEASURES (Q)
- Water Quality Monitoring of Lake Hjalmaren by the Environment Quality Laboratory of the National Swedish Environmental Protection Board, The monitoring program started in 1978, but some stations had been investigated since 1966.
- The County Administrations and the National Swedish Environment Protection Board are responsible for control and restoration.
N. SOURCES OF DATA
- Questionnaire filled by Drs. T. Ahl, B. Karlsson, L. Marelius, H. Olsson, G. Persson, A. Tolstoy, T. Wiederholm and E. Willen, the Environment Quality Laboratory at the National Swedish Environmental Protection Board, Stockholm, Sweden.
- Willen, E. (1984) The large lakes of Sweden: Vanern, Vattern, Malaren and Hjalmaren. "Ecosystems of the World 23, Lakes and Reservoirs" (ed. Taub, F. B.), pp. 107-134. Elsevier, Amsterdam-Oxford-New York-Tokyo.
- Hakansson, L., Karlsson, B. & Eriksson, s. (1983) Geomorfologiskt sjoregister over Sverige. The National Swedish Environmental Protection Board, SNV PM 1650.
- The Swedish Meteorological and Hydrological Institute (1987) Miljostatistisk arsbok 1986-1987. Naturmiljon i siffror.-Arlov. 224 pp.
- Andersson, B. & Eriksson, S. (1974) Hogre vattengetation i Hjalmaren. The National Swedish Environmental Protection Board, SNV PM 461, pp. 1-56.
- Information obtained from the Commission of Fishery in the County of Vastmanland.
- Olsson, H. (1987) Hjalmarens fosfor-och kvavelastning 1966-1985. The National Swedish Environmental Protection Board, SNV Rapport 3309, 47 pp.
- The Swedish Meteorological and Hydrological Institute (1985) Statistik pa avrinningsomraden 1980-1981. Befolkning, jordruk och industri.-Na 11 SM 8501.-Stockholm. 92 pp.
- Information obtained from the County of Orebro.
- Hakansson, L. (1977) Sediments as Indicators of Contamination. Investigations in the Four Largest Swedish Lakes. The National Swedish Environmental Protection Board, SNV PM 839, 159 pp.
- Andersson, O., Linder, C. E. & Vaz, R. (1984) Levels of organochlorine pesticides, PCBs and certain other organohalogen compounds in fishery products in Sweden, 1976-1982. Var Foda, 36: 1-59 The National Food Administration.
- Results obtained from the National Food Administration, Sweden.
- Names and years of national and local laws obtained from L. Karlstrom, the National Swedish Environmental Protection Board.
