
LAKE MALAREN
On the lakeshore at Stockholm
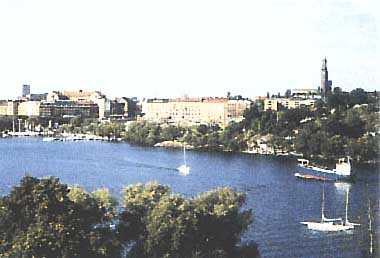
Photo: A. Kurata
A. LOCATION
- Vastmanlands lan, Sodermanlands lan, Uppsala lan and Stockholms lan, Sweden.
- 59:14-59:48N, 16:04-18:00E; 0.3 m above sea level.
B. DESCRIPTION
>Lake Malaren is situated in a region
with Archaean rocks. The deposits around the lake, especially
its northeastern and southern parts, are dominated by lime-rich
clays which make these areas well suited for cultivation. Central
Sweden is a highly cultivated area where the use of inorganic
fertilizers contributes to the nutrient loading on the lakes.
Lake Malaren is a very complicated system
of waters composed of bays of different character. On the basis
of its topography the lake can be divided into five basins each
with its own chemical and biological status.
An early description of the lake mentions
its importance as a route of communication between Stockholm,
the capital, and many inland towns, the traveller being able
to enjoy the many beautiful bays en route (Fischerstrom, 1785).
Another comment from this early period, more interesting from
a water quality point of view, says that the water usually has
a good taste and is sound enough to drink. Water-blooming algae,
Aphanizomenon flos-aquae ,were however observed in shallow creeks.
The quotient between drainage area and
lake surface is about 20 which indicates a large surrounding
area contributing to the loading on the lake. The expansion of
population and industry around the lake has been and is still
very high. Lake Malaren has become more eutrophic during the
last 30 to 40 years. Its importance as a freshwater reservoir
is steadily increasing.
Stockholm, the capital of Sweden, is situated
at the outlet of Lake Malaren into the Baltic. Seventy-five percent
of the inflow to Lake Malaren enters the western part of the
lake but the inflow into the northeastern area is also important.
This means that the water flows mainly in two directions, one
from west to east and another from northeast to south before
entering the connection with the Baltic.
C. PHYSICAL DIMENSIONS (Q, 1)
| Surface area [km2] | 1,140 |
| Volume [km3] | 13.6 |
| Maximum depth [m] | 61 |
| Mean depth [m] | 11.9 |
| Water level | Regulated |
| - Normal range of annual water | |
| level fluctuation [m] | 0.5 |
| Length of shoreline [km] | 1,410 |
| Residence time [yr] | 2.2* |
| Catchment area [km2] | 21,460 |
| * 1981-1985. | |
D. PHYSIOGRAPHIC FEATURES
D1 GEOGRAPHICAL (Q)
- Bathymetric map: Fig. EUR-13-01.
- Names of main islands: Torsteron, Selaon, Monson, Ekeron and Svartsjolandet.
- Number of outflowing rivers and channels (name): 1 (Norrstrom R.).
D2 CLIMATIC (Q, 2)
- Climatic data at Stockholm, 1931-1960
| Mean temp. [deg C] | ||||||||||||
| Jan | Feb | Mar | Apr | May | Jun | Jul | Aug | Sep | Oct | Nov | Dec | Ann. |
|---|---|---|---|---|---|---|---|---|---|---|---|---|
| -2.9 | -3.1 | -0.7 | 4.4 | 10.1 | 14.9 | 17.8 | 16.6 | 12.2 | 7.1 | 2.8 | 0.1 | 6.6 |
| Precipitation [mm] | ||||||||||||
| 43 | 30 | 26 | 31 | 34 | 45 | 61 | 76 | 60 | 48 | 53 | 48 | 555 |
- Number of hours of bright sunshine: 1,800-2,000 hr yr-1.
- Solar radiation: 8.9 MJ m-2 day-1.
Fig. EUR-13-01
Bathymetric map [m].
- Water temperature [deg C]
| Prastfjarden, 1981-1985 | ||||||||||||
| Depth [m] | Jan | Feb | Mar | Apr | May | Jun | Jul | Aug | Sep | Oct | Nov | Dec |
|---|---|---|---|---|---|---|---|---|---|---|---|---|
| 0 | - | - | 0.5 | - | 5.6 | 12.5 | 18.5 | 17.5 | 13.9 | 11.0 | - | - |
| 5 | - | - | 0.7 | - | 4.8 | 11.8 | 17.8 | 17.2 | 13.9 | 10.9 | - | - |
| 10 | - | - | 0.9 | - | 4.6 | 10.9 | 14.7 | 16.3 | 13.9 | 10.9 | - | - |
| 15 | - | - | 1.0 | - | 4.5 | 9.9 | 11.0 | 14.2 | 13.9 | 10.9 | - | - |
| 20 | - | - | 1.1 | - | 4.2 | 8.3 | 9.4 | 11.2 | 13.6 | 10.9 | - | - |
| 30 | - | - | 1.3 | - | 4.1 | 7.3 | 8.0 | 9.4 | 10.9 | 10.7 | - | - |
| 40 | - | - | 1.5 | - | 4.0 | 6.4 | 7.5 | 8.7 | 9.8 | 10.3 | - | - |
- Freezing period (1984-1985): 119 days.
- Mixing type: Dimictic.
E. LAKE WATER QUALITY
E1 TRANSPARENCY [m](Q)
| Prastfjarden, 1981-1985 | ||||||||||||
| Depth [m] | Jan | Feb | Mar | Apr | May | Jun | Jul | Aug | Sep | Oct | Nov | Dec |
|---|---|---|---|---|---|---|---|---|---|---|---|---|
| - | - | 1.8 | - | 1.9 | 2.1 | 3.0 | 3.2 | 3.4 | 2.9 | - | - | |
E2 pH (Q)
| Prastfjarden, 1981-1985 | ||||||||||||
| Depth [m] | Jan | Feb | Mar | Apr | May | Jun | Jul | Aug | SeP | Oct | Nov | Dec |
|---|---|---|---|---|---|---|---|---|---|---|---|---|
| 0 | - | - | 7.4 | - | 7.7 | 8.1 | 8.0 | 7.7 | 7.6 | 7.6 | - | - |
| 5 | - | - | 7.4 | - | 7.7 | 7.9 | 8.0 | 7.7 | 7.7 | 7.6 | - | - |
| 10 | - | - | 7.5 | - | 7.6 | 7.8 | 7.6 | 7.4 | 7.7 | 7.6 | - | - |
| 15 | - | - | 7.5 | - | 7.5 | 7.7 | 7.3 | 7.3 | 7.7 | 7.6 | - | - |
| 20 | - | - | 7.5 | - | 7.5 | 7.6 | 7.2 | 7.2 | 7.6 | 7.6 | - | - |
| 30 | - | - | 7.5 | - | 7.5 | 7.5 | 7.2 | 7.2 | 7.2 | 7.6 | - | - |
| 40 | - | - | 7.4 | - | 7.5 | 7.4 | 7.2 | 7.1 | 7.1 | 7.5 | - | - |
E3 SS [mg l-1](Q)
| Prastfjarden, 1981-1985 | ||||||||||||
| Depth [m] | Jan | Feb | Mar | Apr | May | Jun | Jul | Aug | Sep | Oct | Nov | Dec |
|---|---|---|---|---|---|---|---|---|---|---|---|---|
| 0 | - | - | 3.2 | - | 2.7 | 3.0 | 2.2 | 2.2 | 1.8 | 1.9 | - | - |
| 5 | - | - | 4.2 | - | 2.6 | 3.4 | 1.4 | 2.9 | 1.9 | 1.7 | - | - |
| 10 | - | - | 4.0 | - | 2.2 | 2.8 | 1.6 | 2.6 | 1.8 | 1.7 | - | - |
| 15 | - | - | 2.3 | - | 2.6 | 2.8 | 1.9 | 3.3 | 1.5 | 1.9 | - | - |
| 20 | - | - | 2.2 | - | 2.6 | 2.8 | 2.4 | 4.0 | 1.2 | 1.7 | - | - |
| 30 | - | - | 2.0 | - | 3.0 | 2.8 | 3.3 | 4.0 | 3.0 | 2.1 | - | - |
| 40 | - | - | 1.9 | - | 2.9 | 4.1 | 5.6 | 5.3 | 3.6 | 2.3 | - | - |
E4 DO [mg l-1](Q)
| Prastfjarden, 1981-1985 | ||||||||||||
| Depth [m] | Jan | Feb | Mar | Apr | May | Jun | Jul | Aug | Sep | Oct | Nov | Dec |
|---|---|---|---|---|---|---|---|---|---|---|---|---|
| 0 | - | - | 12.5 | - | 12.3 | 10.8 | 9.0 | 8.3 | 9.1 | 9.2 | - | - |
| 5 | - | - | 12.2 | - | 12.4 | 10.5 | 8.8 | 8.2 | 9.1 | 9.2 | - | - |
| 10 | - | - | 12.2 | - | 12.2 | 10.1 | 8.4 | 7.9 | 8.9 | 9.4 | - | - |
| 15 | - | - | 12.2 | - | 11.5 | 10.8 | 8.7 | 7.6 | 8.9 | 9.3 | - | - |
| 20 | - | - | 12.2 | - | 12.2 | 10.7 | 8.7 | 7.5 | 8.6 | 9.2 | - | - |
| 30 | - | - | 12.0 | - | 12.1 | 10.7 | 9.1 | 7.4 | 7.4 | 9.2 | - | - |
| 40 | - | - | 11.5 | - | 11.9 | 10.8 | 9.0 | 7.5 | 6.6 | 8.3 | - | - |
E5 COD [mg l-1] Determined by KMnO4 method.
| Prastfjarden, 1981-1985 | ||||||||||||
| Depth [m] | Jan | Feb | Mar | Apr | May | Jun | Jul | Aug | Sep | Oct | Nov | Dec |
|---|---|---|---|---|---|---|---|---|---|---|---|---|
| 0 | - | - | 25.5 | - | 25.1 | 26.8 | 26.5 | 25.4 | 23.6 | 22.1 | - | - |
| 5 | - | - | 24.5 | - | 24.5 | 26.1 | 25.9 | 25.3 | 23.9 | 22.9 | - | - |
| 10 | - | - | 22.4 | - | 25.8 | 24.7 | 24.3 | 24.8 | 23.1 | 23.3 | - | - |
| 15 | - | - | 21.9 | - | 25.8 | 24.1 | 24.5 | 24.5 | 23.2 | 23.1 | - | - |
| 20 | - | - | 21.0 | - | 25.5 | 23.9 | 23.8 | 24.4 | 23.0 | 22.8 | - | - |
| 30 | - | - | 21.9 | - | 25.3 | 24.0 | 24.0 | 24.2 | 23.2 | 22.4 | - | - |
| 40 | - | - | 22.1 | - | 26.1 | 24.1 | 23.9 | 24.9 | 23.3 | 22.8 | - | - |
E6 CHLOROPHYLL CONCENTRATION [micro g l-1](Q)
| Prastfjarden, 1981-1985 | ||||||||||||
| Depth [m] | Jan | Feb | Mar | Apr | May | Jun | Jul | Aug | Sep | Oct | Nov | Dec |
|---|---|---|---|---|---|---|---|---|---|---|---|---|
| 0 | - | - | 0.8 | - | 3.8 | 9.8 | 6.6 | 5.3 | 4.7 | 3.2 | - | - |
| 5 | - | - | 0.3 | - | 4.5 | 8.2 | 6.6 | 5.1 | 4.2 | 2.7 | - | - |
| 10 | - | - | 0.3 | - | 3.7 | 7.2 | 3.1 | 3.4 | 4.1 | 2.7 | - | - |
| 15 | - | - | 0.3 | 3.6 | 6.0 | 1.6 | 3.2 | 4.0 | 2.7 | - | - | |
| 20 | - | - | 0.3 | - | 3.6 | 5.1 | 0.9 | 1.1 | 3.3 | 2.7 | - | - |
| 30 | - | - | 0.3 | - | 3.1 | 5.2 | 0.9 | 0.7 | 1.6 | 2.7 | - | - |
| 40 | - | - | 0.4 | - | 2.9 | 5.6 | 1.9 | 0.8 | 1.1 | 2.5 | - | - |
E7 NITROGEN CONCENTRATION (Q)
- Total-N [mg l-1]
| Prastfjarden, 1981-1985 | ||||||||||||
| Depth [m] | Jan | Feb | Mar | Apr | May | Jun | Jul | Aug | Sep | Oct | Nov | Dec |
|---|---|---|---|---|---|---|---|---|---|---|---|---|
| 0 | - | - | 0.962 | - | 0.843 | 0.830 | 0.720 | 0.709 | 0.718 | 0.735 | - | - |
| 5 | - | - | 0.872 | - | 0.825 | 0.798 | 0.707 | 0.710 | 0.717 | 0.695 | - | - |
| 10 | - | - | 0.775 | - | 0.843 | 0.775 | 0.714 | 0.717 | 0.716 | 0.698 | - | - |
| 15 | - | - | 0.747 | - | 0.874 | 0.786 | 0.772 | 0.764 | 0.700 | 0.704 | - | - |
| 20 | - | - | 0.733 | - | 0.856 | 0.793 | 0.847 | 0.842 | 0.709 | 0.727 | - | - |
| 30 | - | - | 0.753 | - | 0.875 | 0.799 | 0.872 | 0.891 | 0.827 | 0.707 | - | - |
| 40 | - | - | 0.770 | - | 0.857 | 0.852 | 0.879 | 0.906 | 0.860 | 0.737 | - | - |
E8 PHOSPHORUS CONCENTRATION (Q)
- Total-P [mg l-1]
| Prastfjarden | ||||||||||||
| Depth [m] | Jan | Feb | Mar | Apr | May | Jun | Jul | Aug | Sep | Oct | Nov | Dec |
|---|---|---|---|---|---|---|---|---|---|---|---|---|
| 0 | - | - | 0.043 | - | 0.042 | 0.032 | 0.026 | 0.022 | 0.024 | 0.024 | - | - |
| 5 | - | - | 0.043 | - | 0.040 | 0.031 | 0.024 | 0.020 | 0.024 | 0.025 | - | - |
| 10 | - | - | 0.037 | - | 0.041 | 0.031 | 0.021 | 0.019 | 0.021 | 0.022 | - | - |
| 15 | - | - | 0.033 | - | 0.042 | 0.033 | 0.023 | 0.022 | 0.021 | 0.024 | - | - |
| 20 | - | - | 0.031 | - | 0.039 | 0.033 | 0.025 | 0.028 | 0.023 | 0.023 | - | - |
| 30 | - | - | 0.034 | - | 0.041 | 0.036 | 0.031 | 0.031 | 0.033 | 0.023 | - | - |
| 40 | - | - | 0.036 | - | 0.042 | 0.042 | 0.040 | 0.037 | 0.041 | 0.030 | - | - |
E10 PAST TRENDS (3): Fig. EUR-13-02, 03, 04 and 05.
Fig. EUR-13-02
Past trend of transparency with map of its sampling station [m].
Fig. EUR-13-03
Past trend of chlorophyll a [micro g l-1].
Fig. EUR-13-04
Past trend of NO3-N [micro g l-1].
Fig. EUR-13-05
Past trend of Total-P [micro g l-1]
F. BIOLOGICAL FEATURES
F1 FLORA
- Emerged macrophytes: Phragmites australis (4, 5).
- Floating macrophytes: Nuphar luteum, Nymphaea candida (4, 5).
- Phytoplankton (Q)
Stephanodiscus rotula, S. hantzschii v. pusillus, Cryptomonas spp., Melosira islandica, M. italica, Rhodomonas lacustris, Asterionella formosa, Aphanizomenon flos-aquae, Diatoma elongatum, Ceratium hirundinella.
F2 FAUNA
- Zooplankton (Q)
Copepoda (Cyclopidae spp., Eudiaptomus gracilis), Cladocera (Eubosmina coregoni, Daphnia cristata, D. cuculata), Rotatoria (Keratella cochlearis, Kellicottia longispina, Polyarthra vulgaris). - Benthos (Q)
Crustacea (Pontoporeia affinis, Mysis relicta), Diptera (Micropsectra insignilobus, Tanytarsus spp., Procladius spp.), Oligochaeta (Potamothrix hammoniensis, Tubifex tubifex, Limnodrilus hoffmeisteri, Spirosperma ferox), Nemertinea (Prostoma sp.), Bivalvia (Pisidium personatum). - Fish (6)
Lucioperca lucioperca*, Coregonus albula*, Anguilla anguilla*, Esox lucius*. * Economically important.
F3 PRIMARY PRODUCTION RATE (Q)
- Gross production [g C m-2 yr-1]
| Ekoln Bay | ||
| 1967 | 1968 | 1974 |
|---|---|---|
| 125 | 120 | - |
| Lilla Ullfjarden | ||
| 1967 | 1968 | 1974 |
| - | 100 | 135 |
F5 FISHERY PRODUCTS (Q)
- Annual fish catch [metric tons]
1986: 370.
F6 PAST TRENDS: Fig. EUR-13-06 and 07.
Fig. EUR-13-06
Past trend of phytoplankton biomass [mm3 l-1](3)
Fig. EUR-13-07
Past trend of annual fish catch [metric tons](6).
G. SOCIO-ECONOMIC CONDITIONS
G1 LAND USE IN THE CATCHMENT AREA (8, 7)
| 1981 | ||
| Area [km2] | [%] | |
|---|---|---|
| - Natural landscape | ||
| Woody vegetation | 11,819 | 64.5 |
| - Agricultural land | 4,647 | 25.4 |
| - Others | 1,853 | 10.1 |
| - Total | 18,319 | 100.0 |
- Main types of woody vegetation: Spruce, pine and deciduous forest.
- Main kinds of crops: Wheat, rye and barley.
- Levels of fertilizer application on crop fields: Moderate.
G2 INDUSTRIES IN THE CATCHMENT AREA AND THE LAKE (7)
| 1981 | ||
| No. of persons engaged | No. of establishments | |
|---|---|---|
| - Secondry industry | ||
| Mines and manufacturing industry | 103,225 | 990 |
| Food stuffs | 7,687 | 77 |
| Textile | 1,954 | 36 |
| Wood | 2,830 | 81 |
| Pulp and paper | 6,923 | 105 |
| Chemical | 6,575 | 63 |
| Soil and stone | 2,815 | 63 |
| Metal products | 11,825 | 31 |
| Work shop | 60,323 | 504 |
| - Others | 482 | 11 |
| All exclusive Stockholm. | ||
- Numbers of domestic animals in the catchment area
Cattle 138,550, sheep 28,600, swine 177,500, poultry 592,100.
G3 POPULATION IN THE CATCHMENT AREA (7)
| 1980 | |||
| Population | Population density [km-2] | Major cities (population) | |
|---|---|---|---|
| Total | 1,086,400 | 50.6 | Stockholm (700,000), Uppsala, Vasteras, Eskilstuna |
H. LAKE UTILIZATION (Q)
H1 LAKE UTILIZATION
Source of water, navigation and transportation, sightseeing and tourism, recreation (swimming, sport-fishing, yachting) and fisheries.
I. DETERIORATION OF LAKE ENVIRONMENTS AND HAZARDS
I1 ENHANCED SILTATION (Q)
- Extent of damage: Not serious.
I2 TOXIC CONTAMINATION
- Present status: Detected but not serious (Q).
- Main contaminants, their concentrations and sources (8, 9, 10)
| Concentration [ppm] | |||
|---|---|---|---|
| Bottom mud (dry wt.) (before 1977) | Fish*1 (wet wt.) (1977) | Fish*2 (wet wt.) (1986) | |
| Hg | 0.5 | - | - |
| Cu | 188 | - | - |
| Ni | 189 | - | - |
| Pb | 132 | - | - |
| Zn | 446 | - | - |
| Cr | 701 | - | - |
| Total Hg | - | - | 0.3 |
| DDE+DDT+DDD | - | 3.1 | - |
| PCBs | - | 23 | - |
| *1 Liver of burbot at Lambarfjarden. | |||
| *2 Muscle of pike at Kalmarviken. | |||
- Food safety standards or tolerance limits for toxic contaminant
residue (11)
For Hg in fish: 1 ppm. For DDE+DDT+DDD in fish: 5 ppm. For PCBs in liver of fish: 5 ppm. For Cs137 in freshwater fish: 1500 Bq (1 Ci= 37,000,000,000 Bq). - Supplementary notes
Number of Bq of Cs137 per kg muscle (wet wt.) of cisco caught at Station Sodra Bjorkfjarden in 1986 was 240 and of pike perch 135.
I3 EUTROPHICATION (Q)
- Nuisance caused by eutrophication
Unusual algal bloom: Aphanizomenon flos-aquae. Disturbed filtration in cleaning beds: Melosira islandica ssp. helvetica. Foul smell of tap water: Synura petersenii, Uroglena spp., Oscillatoria agardhii. Fouling of gill net: Melosira islandica ssp. helvetica. - Nitrogen and phosphorus loadings to the lake [t yr-1]
| 1981-1985 | |
|
Sources |
Total |
|---|---|
| T-N | 13,400 |
| T-P | 590 |
I4 ACIDIFICATION (Q)
- Extent of damage: None.
J. WASTEWATER TREATMENTS (Q)
J1 GENERATION OF POLLUTANTS IN THE CATCHMENT AREA
f) Extensive development of the catchment area with provision for municipal wastewater treatment.
J2 APPROXIMATE PERCENTAGE DISTRIBUTION OF POLLUTANT LOADS
| 1981-1985 | ||
| N[%] | P[%] | |
|---|---|---|
| Natural background from ground | 21 | 17 |
| Atmospheric deposition | 5 | 1 |
| Municipal and industrial sources | 30 | 24 |
| Cultured fields minus background | 38 | 48 |
| Other fields minus background | 6 | 10 |
| Total | 100 | 100 |
J3 SANITARY FACILITIES AND SEWERAGE
- Percentage of municipal population in the catchment area
provided with
adequate sanitary facilities (on-site treatment systems) or public sewerage: 100%. - Percentage of rural population with adequate sanitary facilities
(on-site
treatment systems): >90%.
K. IMPROVEMENT WORKS IN THE LAKE (Q)
K1 RESTORATION
Weed cutting in small areas.
M. LEGISLATIVE AND INSTITUTIONAL MEASURES FOR UPGRADING LAKE ENVIRONMENTS (10)
M1 NATIONAL AND LOCAL LAWS CONCERNED
- Names of the laws (the year of legislation)
- The Nature Conservation Act (1964)
- The Nature Conservation Ordinance (1976)
- The Environment Protection Act (1969)
- The Environment Protection Ordinance (1981)
- The Act on Chemical Products (1985)
- The Ordinance on Chemical Products (1985)
- The Ordinance Relating to Hazardous Waste (1985)
- The Ordinance on Pesticides (1985)
- The Ordinance on Certain Products Hazardous to Health and to the Environment (1985)
- The Ordinance on PCB etc. (1985)
- The Marine Dumping Prohibition Act (1971)
- The Bumping Ordinance (1971)
- The Act on Measures against Water Pollution from Vessels (1980)
- The Ordinance on Measures against Water Pollution from Vessels (1980)
- The Act on Sulphur Content in Fuel Oil (1976)
- The Ordinance on Sulphur Content in Fuel Oil (1976)
- The Ordinance on State Grants for the Liming of Lakes and Watercourses (1982)
- The Standing Instructions to the National Swedish Environmental Protection Board (1967)
- The Standing Instructions to the National Franchise Board for Environment Protection (1969)
- The Environment Protection Statutes enacted by the National Swedish Environmental Protection Board are published as from 1977 in the Code of Statutes of the National Swedish Environmental Protection Board, SNFS (1977)
- The Health Protection Act (1982)
- The Health Protection Ordinance (1983)
- The Water Act (1983)
- The Water Association Act (1976)
- The Act on Transport of Dangerous Goods (1982)
- The Ordinance on Transport of Dangerous Goods (1982)
- The Act on Fishing Rights (1950)
- The Fisheries Ordinance (1982)
- The Planning and Building Act (1987)
- The Natural Resources Act (1987)
M2 INSTITUTIONAL MEASURES
- Water Quality Monitoring of Lake Malaren by the Environment Quality Laboratory of the National Swedish Environmental Protection Board, The monitoring program started in 1978, but some stations had been investigated since 1965.
- The County Administrations and the National Swedish Environment Protection Board are responsible for control and restoration.
N. SOURCES OF DATA
- Questionnaire filled by Drs. T. Ahl, B. Karlsson, I. Marelius, H. Olsson, G. Persson, A. Tolstoy, T. Wiederholm and E. Willen, the Environment duality Laboratory at the National Swedish Environmental Protection Board, Stockholm, Sweden.
- Hakansson, L., Karlsson, B. & Eriksson, S. (1983) Geomorfologiskt sjoregister over Sverige. The National Swedish Environmental Protection Board, SNV PM 1650.
- The Swedish Meteorological and Hydrological Institute (1987) Miljostatistisk arsbok 1986-1987. Naturmiljon i siffror-Arlov. 224 pp.
- Willen, E. (1984) The large lakes of Sweden: Vanern, Vattern, Malaren and Hjalmaren. "Ecosystems of the World 23, Lakes and Reservoirs " (ed. Taub, F. B.), pp. 107-134. Elsevier, Amsterdam-Oxford-New York-Tokyo.
- Andersson, B. (1973) Vegetationsundersokninger i Malaren. I. Ekoln 1969 1972. The National Swedish Environmental Protection Board, SNV PM 399, pp. 1-47.
- Andersson, B. (1976) Vegetationsundersokninger i Malaren. II, 1970-1977. The National Swedish Environmental Protection Board, SNV PM 1059, pp. 1 74.
- The National Swedish Environmental Protection Board. Information obtained from the Commission of Fishery in the County of Vastmanland.
- The Swedish Meteorological and Hydrological Institute (1985) Statistik pa avrinningsomraden 1980-1981. Befolkning , jordbruk och industri-Na 11 SM 8501-Stockholm. 92 pp.
- Hakansson, L. (1977) Sediments as Indicators of Contamination. Investegations in the Four Largest Swedish Lakes. The National Swedish Environmental Protection Board, SNV PM 839, 159 pp.
- Anderson, O., Linder, C. E. & Vaz, R. (1984) Levels of organochlorine pesticides , PCBs and certain other organohalogen compounds in fishery products in Sweden,1976-1982. Var Foda, 36: 1-59. The National Food Administration.
- Names and years of national and local laws obtained from L. Karlstrom, the National Swedish Environmental Protection Board.
- Results obtained from the National Food Administration, Sweden.
