ZURICHSEE
A lakeside view
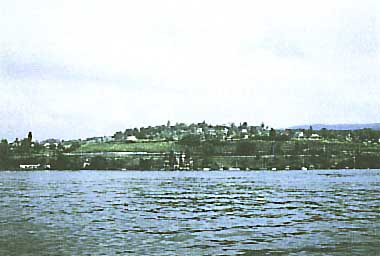
Photo: Shiga Prefecutual Government
A. LOCATION
- Zurich and Schwyz, Switzerland.
- 47:15N, 8:40E; 406 m above sea level.
B. DESCRIPTION
The Lake Zurich consists of two parts, a longer
one with a length of about 28 km and a smaller one with a length
of about 12 km. The lake lies in a valley formed by a glacier
in the last ice period. With the state capital, the city of Zurich
at the end of the lake, hilly shore areas offer favorable sites
to live. Owing to the sewage discharge from this area, the lake
became eutrophic at the beginning of this century. With the construction
of sewage treatment plants, which include mechanical, biological
and chemical steps in the form of phosphorus flocculation and
flocculation filtration for all the wastewater in the catchment
area, the loading of organic material and phosphorus compounds
has been reduced, and the trophic state has tended toward mesotrophic.
For one hundred years Lake Zurich water has been used as an important
drinking water resource for Zurich and for various villages in
its surroundings. The lake has a great importance also as a large
recreation area.
C. PHYSICAL DIMENSIONS (Q1).
| Surface area [km2] | 65 |
| Volume [km3] | 3.3 |
| Maximum depth [m] | 136.0 |
| Mean depth [m] | 51.0 |
| Water level | Regulated |
| Residence time [yr] | 1.1 |
| Catchment area [km2] | 1,740 |
D. PHYSIOGRAPHIC FEATURES
D1 GEOGRAPHICAL (Q1)
- Bathymetric map: Fig. EUR-06-01.
- Names of main islands: None.
- Number of outflowing rivers and channels (name): 1 (Limmat R.).
D2 CLIMATIC
- Climatic data at Zurich, 1931-1960 (1)
| Mean temp. [deg C] | ||||||||||||
| Jan | Feb | Mar | Apr | May | Jun | Jul | Aug | Sep | Oct | Nov | Dec | Ann. |
|---|---|---|---|---|---|---|---|---|---|---|---|---|
| -0.1 | 0.3 | 4.5 | 8.6 | 12.7 | 15.9 | 17.6 | 17.0 | 14.0 | 8.6 | 3.7 | 0.1 | 8.5 |
| Precipitation [mm] | ||||||||||||
| Jan | Feb | Mar | Apr | May | Jun | Jul | Aug | Sep | Oct | Nov | Dec | Ann. |
| 74 | 70 | 66 | 80 | 107 | 136 | 143 | 131 | 108 | 80 | 76 | 65 | 1,136 |
- Number of hours of bright sunshine: 1,963 hr yr-1 (1).
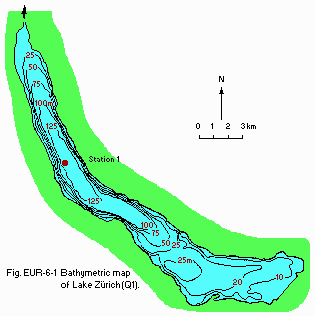
Fig. EUR-06-01
Bathymetric map (Q1).
- Water temperature: Fig. EUR-06-02.
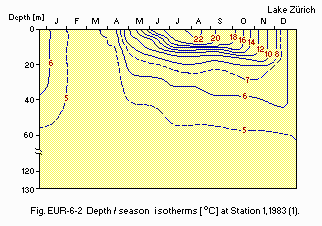
Fig. EUR-06-02
Depth/season isotherms [deg C] at Station 1, 1983 (1).
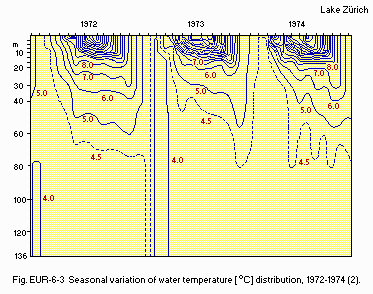
Fig. EUR-06-03
Seasonal variation of vertical water temperature [deg C] distribution,
1972-1974 (2).
- Freezing period: Seldom (1).
- Mixing type: Meromictic (1).
E. LAKE WATER QUALITY
E1 TRANSPARENCY [m](Q1)
| Station 1, 1983 | ||||||||||||
| Depth [m] | Jan | Feb | Mar | Apr | May | Jun | Jul | Aug | Sep | Oct | Nov | Dec |
|---|---|---|---|---|---|---|---|---|---|---|---|---|
| 5.9 | 8.0 | 8.0 | 4.4 | 3.4 | 5.9 | 4.3 | 2.4 | 3.3 | 4.6 | 5.5 | 5.5 | |
E2 pH (Q1)
| Station 1, 1983 | ||||||||||||
| Depth [m] | Jan | Feb | Mar | Apr | May | Jun | Jul | Aug | Sep | Oct | Nov | Dec |
|---|---|---|---|---|---|---|---|---|---|---|---|---|
| S* | 8.02 | 7.75 | 8.02 | 8.12 | 8.60 | 8.69 | 8.61 | 8.57 | 8.19 | 8.72 | 8.72 | 7.91 |
| * Surface. | ||||||||||||
E4 DO: Fig. EUR-06-04.
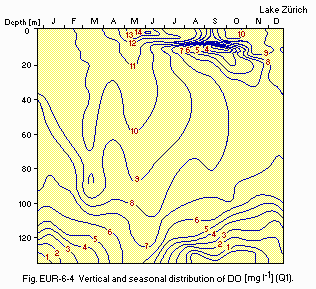
Fig. EUR-06-04
Vertical and seasonal distribution of DO [mg l-1](Q1).
E5 COD [mg l-1](Q3)
| Station 1, 1986 | |||||||||||||
| Depth [m] | Jan | Feb | Mar | Apr | May | Jun | Jul | Aug | Sep | Oct | Nov | Dec | |
|---|---|---|---|---|---|---|---|---|---|---|---|---|---|
| 0 | 1.30 | - | - | 1.35 | - | - | 1.45 | - | - | 1.45 | - | - | |
| 1 | - | - | - | - | - | - | - | - | - | 1.50 | - | - | |
| 2.5 | - | - | - | - | - | - | - | - | - | 1.50 | - | - | |
| 5 | - | - | - | 1.20 | - | - | 1.45 | - | - | 1.50 | - | - | |
| 7.5 | - | - | - | - | - | - | - | - | - | 1.45 | - | - | |
| 10 | 1.20 | - | - | 1.15 | - | - | 1.45 | - | - | 1.35 | - | - | |
| 12.5 | - | - | - | - | - | - | - | - | - | 1.30 | - | - | |
| 15 | 1.25 | - | - | 1.15 | - | - | 1.30 | - | - | 1.25 | - | - | |
| 20 | 1.20 | - | - | - | - | - | 1.25 | - | - | 1.20 | - | - | |
| 30 | 1.25 | - | - | 1.10 | - | - | 1.20 | - | - | 1.20 | - | - | |
| 40 | 1.30 | - | - | 1.40 | - | - | 1.20 | - | - | 1.15 | - | - | |
| 60 | 1.30 | - | - | 1.35 | - | - | 1.20 | - | - | 1.15 | - | - | |
| 80 | 1.15 | - | - | 1.30 | - | - | 1.20 | - | - | 1.20 | - | - | |
| 90 | 1.15 | - | - | 1.35 | - | - | - | - | - | 1.10 | - | - | |
| 100 | 1.10 | - | - | 1.30 | - | - | 1.20 | - | - | 1.15 | - | - | |
| 110 | 1.20 | - | - | 1.30 | - | - | - | - | - | 1.15 | - | - | |
| 120 | 1.25 | - | - | 1.25 | - | - | 1.15 | - | - | 1.20 | - | - | |
| 130 | 1.25 | - | - | 1.30 | - | - | 1.15 | - | - | 1.30 | - | - | |
| 135 | 1.40 | - | - | 1.30 | - | - | 1.25 | - | - | 1.35 | - | - | |
E6 CHLOROPHYLL CONCENTRATION [micro g l-1](Q1)
| Station 1, 1983 | ||||||||||||
| Depth [m] | Jan | Feb | Mar | Apr | May | Jun | Jul | Aug | Sep | Oct | Nov | Dec |
|---|---|---|---|---|---|---|---|---|---|---|---|---|
| 0 | 0.54 | 1.04 | 1.70 | 3.74 | 11.54 | 1.78 | 1.82 | 3.83 | 2.17 | 3.68 | 1.30 | 0.40 |
| 10 | 0.39 | 1.12 | 1.61 | 2.22 | 5.72 | 1.62 | 2.59 | 2.89 | 2.02 | 1.89 | 1.26 | 0.42 |
| 20 | 0.32 | 1.12 | 0.58 | 0.58 | 1.16 | 0.31 | 0.35 | 0.38 | 0.42 | 0.62 | 0.36 | 0.36 |
| 30 | 0.36 | 1.06 | 0.35 | 0.40 | 0.71 | 0.22 | 0.12 | 0.16 | 0.27 | 0.16 | 0.13 | 0.38 |
| 40 | 0.28 | 1.04 | 0.47 | 0.35 | 0.56 | 0.15 | 0.11 | 0.11 | 0.29 | 0.14 | 0.10 | 0.07 |
| 80 | 0.04 | 0.32 | 0.53 | 0.29 | 0.22 | 0.11 | 0.08 | 0.10 | 0.17 | 0.06 | 0.05 | 0.04 |
| 120 | 0.02 | 0.13 | 0.15 | 0.19 | 0.16 | 0.10 | 0.04 | 0.06 | 0.10 | 0.25 | 0.05 | 0.05 |
| 135 | 0.02 | 0.07 | 0.08 | 0.21 | 1.52 | 0.11 | 0.06 | 0.08 | 0.16 | 0.25 | 0.02 | 0.03 |
E7 NITROGEN CONCENTRATION (Q3)
- NH4-N [mg l-1]
| Station 1, 1986 | ||||||||||||
| Depth [m] | Jan | Feb | Mar | Apr | May | Jun | Jul | Aug | Sep | Oct | Nov | Dec |
|---|---|---|---|---|---|---|---|---|---|---|---|---|
| 0 | .025 | .005 | <.005 | .005 | .010 | .070 | .025 | .010 | .020 | .010 | .010 | .015 |
| 1 | .025 | .005 | <.005 | .005 | .015 | .070 | .025 | .010 | .015 | .010 | .015 | .015 |
| 2.5 | .025 | .005 | <.005 | .005 | .015 | .070 | .025 | .010 | .015 | .010 | .010 | .015 |
| 5 | .025 | .005 | <.005 | .005 | .020 | .075 | .025 | .015 | .015 | .010 | .010 | .015 |
| 7.5 | .025 | .005 | <.005 | .010 | .045 | .075 | .040 | .030 | .015 | .015 | .010 | .015 |
| 10 | .025 | .005 | <.005 | .010 | .035 | .005 | .020 | .035 | .010 | .010 | .010 | .015 |
| 12.5 | .025 | .005 | <.005 | .010 | .035 | .005 | .005 | .005 | .005 | .005 | .010 | .015 |
| 15 | .025 | .005 | <.005 | .010 | .035 | .005 | .005 | .005 | .005 | .005 | .010 | .015 |
| 20 | .030 | .005 | .005 | .005 | .005 | .005 | <.005 | .005 | .005 | <.005 | <.005 | .005 |
| 30 | .030 | .005 | .005 | .005 | .005 | .005 | <.005 | .005 | .005 | <.005 | <.005 | .005 |
| 40 | .030 | .005 | .005 | .005 | .005 | .005 | <.005 | .005 | .005 | <.005 | <.005 | .005 |
| 60 | .005 | .010 | .005 | .005 | .005 | .005 | <.005 | .005 | .005 | <.005 | <.005 | .005 |
| 80 | .005 | .005 | .005 | .005 | .005 | .005 | <.005 | <.005 | .005 | <.005 | <.005 | .005 |
| 90 | .005 | .005 | <.005 | .005 | .005 | .005 | <.005 | <.005 | <.005 | <.005 | <.005 | .005 |
| 100 | .005 | .005 | <.005 | .005 | .005 | .005 | <.005 | .005 | .005 | <.005 | <.005 | .005 |
| 110 | .005 | .005 | <.005 | <.005 | .005 | .005 | .005 | .005 | .005 | <.005 | <.005 | .005 |
| 120 | .005 | .005 | <.005 | <.005 | .005 | .005 | .005 | .005 | .005 | <.005 | .005 | .005 |
| 130 | .040 | .005 | <.005 | .005 | .005 | .005 | .005 | .005 | .005 | .200 | .180 | .200 |
| 135 | .300 | .010 | .005 | .010 | .005 | .005 | .005 | .090 | .135 | .300 | .320 | .370 |
- NO3-N [mg l-1]
| Station 1, 1986 | ||||||||||||
| Depth [m] | Jan | Feb | Mar | Apr | May | Jun | Jul | Aug | Sep | Oct | Nov | Dec |
|---|---|---|---|---|---|---|---|---|---|---|---|---|
| 0 | .690 | .735 | .760 | .770 | .615 | .655 | .530 | .375 | .385 | .370 | .515 | .555 |
| 1 | .705 | .745 | .750 | .770 | .625 | .660 | .530 | .385 | .365 | .365 | .520 | .555 |
| 2.5 | .685 | .740 | .750 | .775 | .615 | .650 | .530 | .375 | .365 | .365 | .515 | .555 |
| 5 | .690 | .735 | .750 | .775 | .615 | .665 | .540 | .420 | .370 | .370 | .520 | .555 |
| 7.5 | .680 | .710 | .755 | .775 | .695 | .690 | .660 | .490 | .380 | .380 | .515 | .550 |
| 10 | .695 | .735 | .760 | .785 | .740 | .780 | .775 | .760 | .765 | .640 | .515 | .555 |
| 12.5 | .695 | .730 | .765 | .795 | .755 | .775 | .860 | .865 | .865 | .845 | .515 | .550 |
| 15 | .705 | .715 | .760 | .790 | .760 | .775 | .865 | .860 | .870 | .855 | .515 | .545 |
| 20 | .695 | .730 | .755 | .780 | .775 | .770 | .860 | .905 | .875 | .845 | .780 | .800 |
| 30 | .700 | .735 | .760 | .785 | .775 | .770 | .850 | .860 | .855 | .840 | .800 | .830 |
| 40 | .715 | .760 | .750 | .785 | .780 | .770 | .835 | .845 | .855 | .825 | .810 | .840 |
| 60 | .855 | .745 | .775 | .790 | .785 | .770 | .835 | .845 | .845 | .820 | .805 | .830 |
| 80 | .845 | .755 | .775 | .790 | .775 | .770 | .845 | .840 | .850 | .820 | .800 | .825 |
| 90 | .840 | .745 | .800 | .785 | .780 | .765 | .845 | .850 | .855 | .825 | .805 | .830 |
| 100 | .850 | .785 | .810 | .790 | .785 | .770 | .855 | .845 | .855 | .825 | .815 | .830 |
| 110 | .845 | .780 | .815 | .800 | .785 | .775 | .860 | .850 | .865 | .855 | .815 | .835 |
| 120 | .865 | .780 | .815 | .800 | .785 | .785 | .845 | .865 | .880 | .650 | .815 | .855 |
| 130 | .805 | .790 | .815 | .805 | .785 | .795 | .870 | .925 | .830 | .580 | .670 | .635 |
| 135 | .575 | .780 | .800 | .790 | .785 | .805 | .895 | .755 | .595 | .480 | .535 | .500 |
E8 PHOSPHORUS CONCENTRATION
- PO4-P [micro g l-1]
| Station 1, 1986 (03) | ||||||||||||
| Depth [m] | Jan | Feb | Mar | Apr | May | Jun | Jul | Aug | Sep | Oct | Nov | Dec |
|---|---|---|---|---|---|---|---|---|---|---|---|---|
| 0 | 27 | 42 | 35 | 48 | 2 | 10 | 4 | 5 | 2 | 1 | <1 | 1 |
| 1 | 26 | 44 | 37 | 48 | 2 | 11 | 3 | 3 | 2 | 1 | <1 | 1 |
| 2.5 | 27 | 45 | 37 | 50 | 2 | 9 | 8 | 2 | 2 | <1 | <1 | 1 |
| 5 | 27 | 45 | 37 | 50 | 1 | 11 | 2 | 3 | 2 | <1 | <1 | 1 |
| 7.5 | 28 | 45 | 39 | 47 | 2 | 17 | 7 | 2 | 2 | <1 | <1 | 1 |
| 10 | 28 | 46 | 43 | 48 | 13 | 12 | 5 | 2 | 2 | <1 | <1 | 1 |
| 12.5 | 29 | 46 | 44 | 47 | 23 | 27 | 2 | 3 | 3 | <1 | <1 | 1 |
| 15 | 27 | 46 | 45 | 46 | 28 | 37 | 12 | 2 | 2 | <1 | <1 | <1 |
| 20 | 26 | 48 | 45 | 49 | 37 | 47 | 34 | 8 | 9 | 17 | 17 | 25 |
| 30 | 27 | 49 | 45 | 53 | 42 | 49 | 51 | 47 | 44 | 33 | 30 | 37 |
| 40 | 28 | 49 | 44 | 54 | 43 | 49 | 52 | 53 | 52 | 47 | 47 | 47 |
| 60 | 63 | 48 | 49 | 54 | 44 | 48 | 50 | 54 | 55 | 54 | 52 | 56 |
| 80 | 69 | 61 | 60 | 54 | 45 | 53 | 56 | 57 | 60 | 59 | 55 | 63 |
| 90 | 73 | 63 | 71 | 56 | 52 | 59 | 58 | 63 | 66 | 66 | 60 | 68 |
| 100 | 81 | 90 | 77 | 57 | 51 | 66 | 65 | 65 | 79 | 73 | 67 | 72 |
| 110 | 92 | 92 | 87 | 71 | 58 | 70 | 72 | 79 | 91 | 86 | 74 | 88 |
| 120 | 126 | 118 | 101 | 79 | 45 | 73 | 89 | 96 | 115 | 130 | 114 | 125 |
| 130 | 180 | 136 | 119 | 89 | 58 | 91 | 123 | 160 | 209 | 237 | 193 | 211 |
| 135 | 259 | 142 | 133 | 96 | 60 | 126 | 160 | 223 | 301 | 267 | 252 | 268 |
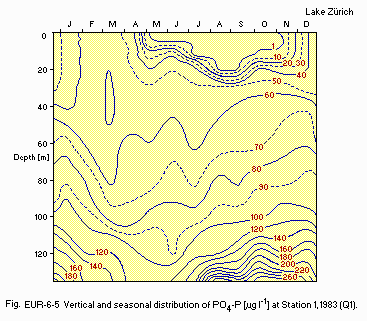
Fig. EUR-06-05
Vertical and seasonal distribution of PO4-P [micro g l-1] at
Station 1, 1983 (Q1).
- Total-P [micro g l-1](Q3)
| Station 1, 1986 | ||||||||||||
| Depth [m] | Jan | Feb | Mar | Apr | May | Jun | Jul | Aug | Sep | Oct | Nov | Dec |
|---|---|---|---|---|---|---|---|---|---|---|---|---|
| 0 | 31 | 46 | 41 | 53 | 10 | 18 | 5 | 4 | 4 | <1 | 3 | 1 |
| 1 | 31 | 49 | 43 | 50 | 12 | 15 | 4 | 2 | 4 | <1 | 4 | 2 |
| 2.5 | 32 | 49 | 45 | 54 | 12 | 15 | 10 | 1 | 6 | 1 | 4 | 1 |
| 5 | 37 | 49 | 44 | 52 | 10 | 19 | 9 | 5 | 8 | 1 | 7 | 1 |
| 7.5 | 31 | 50 | 46 | 48 | 8 | 18 | 14 | 2 | 5 | <1 | 4 | 1 |
| 10 | 31 | 50 | 54 | 49 | 22 | 17 | 10 | 5 | 7 | <1 | 4 | 1 |
| 12.5 | 32 | 50 | 50 | 49 | 30 | 32 | 7 | 6 | 7 | <1 | 4 | 1 |
| 15 | 32 | 50 | 51 | 49 | 37 | 43 | 20 | 4 | 5 | <1 | 4 | <1 |
| 20 | 32 | 51 | 50 | 52 | 45 | 50 | 42 | 9 | 15 | 17 | 24 | 25 |
| 30 | 32 | 52 | 52 | 53 | 52 | 59 | 60 | 48 | 47 | 34 | 40 | 37 |
| 40 | 32 | 53 | 51 | 56 | 50 | 54 | 60 | 53 | 53 | 49 | 51 | 47 |
| 60 | 66 | 52 | 55 | 55 | 51 | 54 | 55 | 54 | 56 | 56 | 54 | 57 |
| 80 | 71 | 64 | 65 | 55 | 55 | 58 | 64 | 55 | 61 | 61 | 58 | 67 |
| 90 | 74 | 65 | 76 | 58 | 60 | 61 | 64 | 62 | 68 | 68 | 64 | 70 |
| 100 | 83 | 92 | 82 | 58 | 58 | 71 | 73 | 65 | 79 | 76 | 71 | 74 |
| 110 | 94 | 90 | 90 | 74 | 64 | 75 | 77 | 78 | 92 | 91 | 82 | 89 |
| 120 | 130 | 119 | 101 | 79 | 66 | 80 | 94 | 95 | 118 | 140 | 117 | 142 |
| 130 | 191 | 136 | 121 | 89 | 76 | 103 | 130 | 160 | 209 | 254 | 197 | 218 |
| 135 | 263 | 142 | 135 | 96 | 78 | 128 | 165 | 223 | 305 | 291 | 260 | 282 |
E9 CHLORIDE CONCENTRATION [mg l-1](Q3)
| Station 1, 1986 | ||||||||||||
| Depth [m] | Jan | Feb | Mar | Apr | May | Jun | Jul | Aug | Sep | Oct | Nov | Dec |
|---|---|---|---|---|---|---|---|---|---|---|---|---|
| 0 | 4.2 | 4.2 | 4.0 | 4.4 | 4.2 | 3.5 | 3.4 | 2.7 | 3.1 | 3.0 | 3.7 | 4.0 |
| 1 | 4.2 | 4.2 | 4.0 | 4.4 | 4.2 | 3.5 | 3.4 | 2.7 | 3.0 | 3.0 | 3.7 | 3.0 |
| 2.5 | 4.2 | 4.2 | 4.0 | 4.4 | 4.2 | 3.5 | 3.4 | 2.6 | 3.0 | 3.0 | 3.7 | 3.0 |
| 5 | 4.2 | 4.2 | 4.1 | 4.4 | 4.2 | 3.6 | 3.4 | 2.8 | 3.0 | 3.0 | 3.7 | 3.0 |
| 7.5 | 4.2 | 4.2 | 4.1 | 4.4 | 4.5 | 4.2 | 3.4 | 2.4 | 3.0 | 3.1 | 3.7 | 3.0 |
| 10 | 4.2 | 4.2 | 4.2 | 4.4 | 4.5 | 4.4 | 3.5 | 3.5 | 3.5 | 3.5 | 3.7 | 3.0 |
| 12.5 | 4.2 | 4.2 | 4.2 | 4.4 | 4.6 | 4.4 | 4.1 | 4.1 | 4.0 | 4.0 | 3.7 | 3.0 |
| 15 | 4.2 | 4.2 | 4.2 | 4.4 | 4.6 | 4.4 | 4.3 | 4.2 | 4.2 | 4.3 | 3.7 | 3.0 |
| 20 | 4.2 | 4.2 | 4.3 | 4.4 | 4.5 | 4.4 | 4.4 | 5.4 | 4.4 | 4.4 | 4.3 | 4.0 |
| 30 | 4.2 | 4.3 | 4.3 | 4.4 | 4.5 | 4.4 | 4.5 | 4.4 | 4.5 | 4.4 | 4.4 | 4.0 |
| 40 | 4.4 | 4.3 | 4.3 | 4.4 | 4.5 | 4.4 | 4.5 | 4.4 | 4.5 | 4.4 | 4.5 | 4.0 |
| 60 | 4.4 | 4.3 | 4.3 | 4.4 | 4.5 | 4.4 | 4.5 | 4.4 | 4.5 | 4.4 | 4.5 | 4.0 |
| 80 | 4.4 | 4.3 | 4.4 | 4.4 | 4.5 | 4.4 | 4.5 | 4.4 | 4.5 | 4.5 | 4.5 | 4.0 |
| 90 | 4.4 | 4.2 | 4.4 | 4.4 | 4.5 | 4.5 | 4.5 | 4.5 | 4.5 | 4.5 | 4.5 | 4.0 |
| 100 | 4.4 | 4.3 | 4.4 | 4.4 | 4.5 | 4.5 | 4.5 | 4.5 | 4.5 | 4.5 | 4.5 | 4.0 |
| 110 | 4.4 | 4.3 | 4.3 | 4.4 | 4.5 | 4.5 | 4.6 | 4.4 | 4.6 | 4.5 | 4.5 | 4.0 |
| 120 | 4.4 | 4.5 | 4.2 | 4.4 | 4.5 | 4.5 | 4.5 | 4.4 | 4.6 | 4.5 | 4.5 | 4.0 |
| 130 | 4.4 | 4.4 | 4.2 | 4.4 | 4.5 | 4.5 | 4.5 | 4.4 | 4.5 | 4.5 | 4.6 | 4.0 |
| 135 | 4.4 | 4.4 | 4.1 | 4.4 | 4.5 | 4.5 | 4.5 | 4.4 | 4.5 | 4.5 | 4.5 | 4.0 |
E10 PAST TRENDS: Fig. EUR-06-06, 07, 08, 09 and 10.
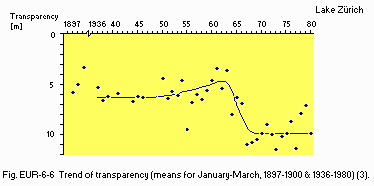
Fig. EUR-06-06
Trend of transparency (means for January-March, 1897-1900 & 1936-1980)(3).
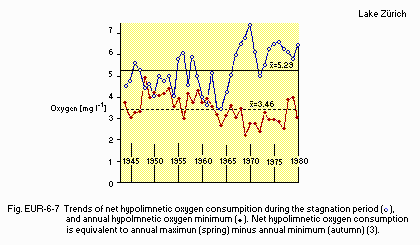
Fig. EUR-06-07
Trends of net hypolimnetic oxygen consumption during the stagnation
period, and annual hypolimnetic oxygen minimum. Net hypolimnetic
oxygen consumption is equivalent to annual maximum (spring) minus
annual minimum (autumn)(3).
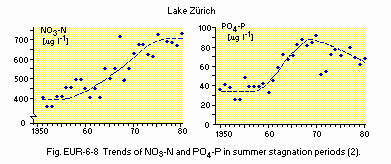
Fig. EUR-06-08
Trends of NO3-N and PO4-P in summer stagnation periods (2).
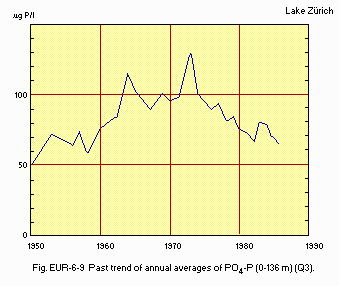
Fig. EUR-06-09
Past trend of annual averages of PO4-P (0-136 m)(Q3).
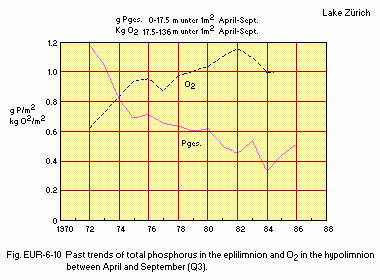
Fig. EUR-06-10
Past trends of total phosphorus in the eplilimnion and O2 in
the hypolimnion between April and September (Q3).
F. BIOLOGICAL FEATURES (Q1)
F1 FLORA
- Emerged macrophytes
Phragmites communis, Phalaris arundinacea, Schoenoplectus lacustris. - Floating macrophytes
Nymphaea alba, Nuphar luteum (several places but mostly planted by inhabitants). - Submerged macrophytes
Potamogeton pectinatus, P. perfoliatus, P. lucens, P. crispus, Elodea canadensis, Zannichellia palustris. - Phytoplankton
Anabaena flos-aquae, A. planctonica, Oscillatoria rubescens, Aphanizomenon flos-aquae, Pandorina morum, Sphaerocystis schroeteri, Mougeotia sp., Dinobryon divergens, Ceratium hirundinella, Cryptomonas ovata, Rhodomonas sp., Melosira granulata, Cyclotella comta, Stephanodiscus hantzschii, Tabellaria fenestrata, Fragilaria crotonensis, Asterionella formosa, Synedra acus.
F2 FAUNA
- Zooplankton
Nassula aurea, Tintinnopsis lacustris, Epistylis rotans, Polyarthra platyptera, Keratella cochlearis, Keratella quadrata, Notholca longispina, Asplanchna priodonta, Synchaeta pectinata, Leptodora sp., Daphnia longispina, Bosmina longirostris, Diaptomous gracilis, Cyclops strenuus, Chaoborus crystallinus. - Benthos
Dugesia polychroa, Herpobdella octoculata, Helobdella stagnalis, Limnodrilus hoffmeisteri, Tubifex ignotus, Psammocryctes barbatus, Stylaria lacustris, Planaria sp., Bithynia tentaculata, Gyraulus albus, Lymnaea auricularia, L. peregra, Pisidium subruncatum, P. moitessierianum, P. nitidum, Dreissena polymorpha, Eucyclops serratulus, Paracyclops fimbriatus, Canthocamptus staphilinus, Caenis moesta, Polypedilum nubeculosum, Microtendipes sp., Limnochironomus pulsus, Eukjefferiella sp., Polycentropus flavomaculatus, Tinodes sp. - Fish
Anguilla vulgaris, Esox lucius, Salmo salvelinus, S. variabilis, Coregonus wartmanni, C. schinzi, Leucisus rutilus, Abramis brama, Barbus fluviatilis, Tinca vulgaris, Cyprinus carpio, Lota vulgaris, Perca fluviatilis.
F3 PRIMARY PRODUCTION RATE
- Net primary production rate [mg C m-2 day-1]
| Station 1, 1981 | ||||||||||||
| Jan | Feb | Mar | Apr | May | Jun | Jul | Aug | Sep | Oct | Nov | Dec | Ann. |
|---|---|---|---|---|---|---|---|---|---|---|---|---|
| 67 | 8 | 710 | 2,050 | 370 | 1,180 | 1,470 | 910 | 1,130 | 940 | 603 | 560 | 833 |
| Station 1, 1982 | ||||||||||||
| 390 | 420 | 210 | 760 | 460 | 1,450 | 2,430 | 1,070 | 1,070 | 380 | 610 | 140 | 783 |
F5 FISHERY PRODUCTS
- Annual fish catch [metric tons]: 189.4.
F6 PAST TRENDS (Q1)
- Trends of net primary production rate and phytoplankton biomass
| 0-14 m | |||||||||
| 1974 | 1975 | 1976 | 1977 | 1978 | 1979 | 1980 | 1981 | 1982 | |
|---|---|---|---|---|---|---|---|---|---|
| Primary production rate | 350 | 230 | 390 | 230 | 250 | 280 | 180 | 305 | 290 |
| [g C m-2 yr-1] | |||||||||
| Phytoplankton biomass | - | - | 2.56 | 2.23 | 2.05 | 3.34 | 2.48 | 1.35 | 2.87 |
| [mg l-1] | |||||||||
G. SOCIO-ECONOMIC CONDITIONS
G1 LAND USE IN THE CATCHMENT AREA (Q2)
| 1980 | ||
| Area [km2] | [%] | |
|---|---|---|
| - Natural landscape | ||
| Woody vegetation | 40.2 | 23 |
| Others | 243.6 | 14 |
| - Agricultural land | 922.3 | 53 |
| - Residential area | 88.0 | 5 |
| - Others | 104.4 | 6 |
| - Total | 1,758.5 | 100 |
- Main types of woody vegetation (Q1)
Picea abies, Abies alba, Fagus silvatica, Quercus robur, Pinus silvestris, Larix decidua. - Main types of herbaceous vegetation (Q1)
Fertilized meadow land (Agrostis, Bromus, Poa, Festuca, Lolium, Avena). - Levels of fertilizer application on crop fields: Moderate.
G2 INDUSTRIES IN THE CATCHMENT AREA AND THE LAKE (Q1)
- Main products of agriculture: Wheat, grape, vegetables and dairy products.
- Main kinds of manufacturing products: Textile, machinery and metal.
G3 POPULATION IN THE CATCHMENT AREA (Q1)
| 1984 | |||
| Population | Population density [km-2] | Major cities (population) | |
|---|---|---|---|
| Total | ca. 500,000 | ca. 217 | Zurich* (423,000), Stafa, Thalwil, Horgen, Wadenswil, Kusnacht, Meilen. |
| * Not all the city area is included in the catchment area. | |||
H. LAKE UTILIZATION
H1 LAKE UTILIZATION (Q1, Q2)
- Source of water, fisheries, navigation, tourism and recreation (swimming, sport-fishing, yachting).
H2 THE LAKE AS WATER RESOURCE (Q1)
| 1983 | |
| Use rate [m3 sec-1] | |
|---|---|
| Domestic* | 2.2 |
| Industrial | 0.07 |
I. DETERIORATION OF LAKE ENVIRONMENTS AND HAZARDS
I1 ENHANCED SILTATION (Q3)
- Extent of damage: Not serious.
I2 TOXIC CONTAMINATION (Q3)
- Present status: Detected but not serious.
- Main contaminants, their concentrations and sources
Station 1, 1986
| Name of contaminants | Concentrations [ppb] Water | Main sources |
|---|---|---|
| 1, 1, 1-Trichloroethane | 0.01 | Industrial |
| Trichloroethylene | 0.01 | Industrial |
| Tetrachloroethylene | 0.02 | Industrial |
| Afrazin | 0.06 | Different pollution sources |
I3 EUTROPHICATION (Q3)
- Nuisance caused by eutrophication
Unusual algal bloom (Aphanizomenon flos-aquae and Stephanodiscus hantzschii). - Nitrogen and phosphorus loadings to the lake [ton yr-1]
| 1984 | ||||||
| Sources | Rivers | Treated sewage | Stormwater tank | Untreated sewage | Precipitate | Total |
|---|---|---|---|---|---|---|
| T-P | 78 | 38 | 4 | 3 | 5 | 128 |
I4 ACIDIFICATION (Q3)
- Extent of damage: None.
J. WASTEWATER TREATMENTS (Q1, Q3)
J1 GENERATION OF POLLUTANTS IN THE CATCHMENT AREA
f) Extensive coverage of pollution sources by treatment systems.
J3 SANITARY FACILITIES AND SEWERAGE
- Percentage of municipal population in the catchment area
provided with
adequate sanitary facilities (on-site treatment systems) or public sewerage: 90%. - Municipal wastewater treatment systems (rate of treatment:
130,000 m3 day-1)
No. of quarternary treatment systems: 2. No. of tertiary treatment systems: 15 (activated sludge, with chemical precipitation of phosphorus). - Supplementary notes
About 90% of sewage is treated in existing wastewater treatment systems. All of the 17 treatment plants will have a flocculation filtration process at the end.
M. LEGISLATIVE AND INSTITUTIONAL MEASURES FOR UPGRADING LAKE ENVIRONMENTS
M1 NATIONAL AND LOCAL LAWS CONCERNED (Q1, Q2)
- Names of the laws (the year of legislation)
- Law of Water Rights, Canton of Zurich (1901)(similar for Canton of Schwyz)
- Federal Law on Water Pollution Control, Federal Government (1971)
- Law on the Introduction of the Federal Law of Water Pollution Control, Canton of Zurich (1974)(similar for Canton of Schwyz)
- Ordinance on Waste Water Disposal, Federal Government (1975)
- Law on Fisheries, Canton of Zurich (1976)
- Responsible authorities
Governments of Cts. of Zurich and Schwyz (Directorates of Hydraulic Constructions, Water Pollution Control, Fisheries, and Sanitation). - Main items of control
Supervision of planning, maintenance and efficiency of water and waste treatment plants, and analysis of public waters (Cantonal Laboratories Zurich and Schwyz; City Water Supply Zurich).
M2 INSTITUTIONAL MEASURES
- Water Supply Zurich, Quality Control
M3 RESEARCH INSTITUTES ENGAGED IN THE LAKE ENVIRONMENT STUDIES
- Eidgenossische Anstalt fur Wasserversorgung, Abwasserreinigung und Gewasserschutz (EAWAG, part of the Swiss Federal Institute of Technology), Dubendorf
- Limnological Station at Kilchberg, University of Zurich
N. SOURCES OF DATA
- Questionnaire filled by Prof. K. Wuhrman, Institut fur Gewasserschutz und Wassertechnologie, Dubendorf.
- Questionnaire filled by Dr. P. Liechti, Bundesamt fur Umweltschutz, Zurich.
- Questionnaire filled by Dr. U. Zimmermann, Wasserversorgung Zurich, Zurich.
- Muller, M. J. (1982) Selected Climatic Data for a Global Set of Standard Stations for Vegetation Science. 306 pp. Dr. W. Junk Publishers, The Hague.
- Zimmermann, U. (1975) Gas-Wasser-Abwasser, 55(9): 473-480.
- Schanz, F. & Thomas, E. A. (1981) Reversal of eutrophication in Lake Zurich. Water Quality Bulletin, 6(4): 108-112 & 156.


