LAGO MAGGIORE (LAKE MAGGIORE)
Central part of the lake seen rom the cableway of Laveno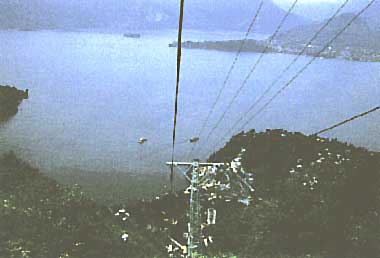
Photo: A. Kurata
A. LOCATION
- Novara and Varese, Italy; and Ticino, Switzerland
- 45:43-46:11N, 8:28-8:52E; 193.9 m above sea level.
B. DESCRIPTION
B. DESCRIPTION
-
Lake Maggiore is the second largest of Italian lakes, but may rank first in beauty. It is an internationally famous resort of Europe, with its picturesque and spectacular landscape, mild climate and luxuriant vegetation. The climate favors a beautiful botanic garden on the lake shore, with exotic and rare plants including even those from the subtropical zone. The lake has many islands and some of them are famous for their lovely parks and pretty villas.
L. Maggiore is 65 km long, 2-4.5 km wide and 370 m deep in its maximum depth. Recently, eutrophication has proceeded in part of the littoral zones, and inflowing waste water is now completely treated. More advanced plants with tertiary treatment are under construction. The concentration of inorganic nitrogen in the lake water has increased gradually since 1960. Those of reactive and total phosphorus also increased until 1977, but have since been decreasing. During the past ten years, the biomass and composition of phytoplankton, chlorophyll concentration and primary productivity have been quite stable, most probably as the result of the control of waste water discharge from the drainage basin.
C. PHYSICAL DIMENSIONS
| Surface area [km2] | 213 |
| Volume [km3] | 37.5 |
| Maximum depth [m] | 370 |
| Mean depth [m] | 176.5 |
| Water level | Unregulated |
| Length of shoreline [km] | 170 |
| Residence time [yr] | 4 |
| Catchment area [km2] | 6,387 |
D. PHYSIOGRAPHIC FEATURES
D1 GEOGRAPHICAL- Bathymetric map: Fig. EUR-05-01.
- Names of main islands: Brissago, Madre, Pescatori and Bella (1).
- Number of outflowing rivers and channels (name): 1 (Ticino R.)(Q).
- Climatic data at Pallanza, 1951-1980 (Q)
| Mean temp. [deg C] | |||||||||||||||||||||||||
| Jan | Feb | Mar | Apr | May | Jun | Jul | Aug | Sep | Oct | Nov | Dec | Ann. | |||||||||||||
|---|---|---|---|---|---|---|---|---|---|---|---|---|---|---|---|---|---|---|---|---|---|---|---|---|---|
| 2.6 | 4.3 | 7.6 | 11.5 | 15.5 | 19.2 | 21.9 | 21.1 | 17.8 | 12.6 | 7.2 | 3.7 | 12.1 | |||||||||||||
| Precipitation [mm] | |||||||||||||||||||||||||
| 73 | 94 | 119 | 168 | 161 | 189 | 130 | 165 | 171 | 215 | 170 | 86 | 1,744 | |||||||||||||
- Number of hours of bright sunshine (1982): 1985 hr yr-1 (Q).
- Solar radiation (1982): 12.27 MJ m-2 day-1 (Q).
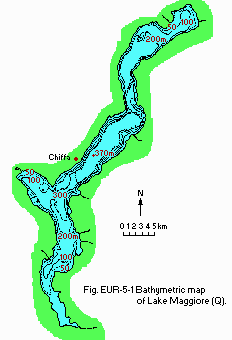
Bathymetric map (Q).
- Water temperature: Fig. EUR-05-03 and 04.
- Freezing period: None (Q).
- Mixing type: Oligomictic.
- Notes on water mixing and thermocline formation
Due to the large maximum and mean depth of the lake, as well as to the peculiar climatic conditions of the area, a complete overturn of the waters of Lake Maggiore does not occur every year. According to Piontelli and Tonolli (1964) and Vollenweider (1964), the layer usually involved in the winter overturn is 100 to 150 m deep, whereas a complete mixing occurs only every five to seven years (2).
E. LAKE WATER QUALITY
E1 TRANSPARENCY: Fig. EUR-05-02.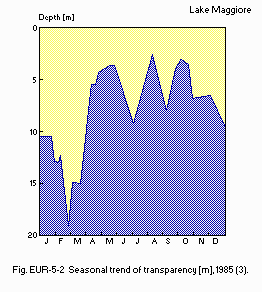
Seasonal trend of transparency [m], 1985 (3).
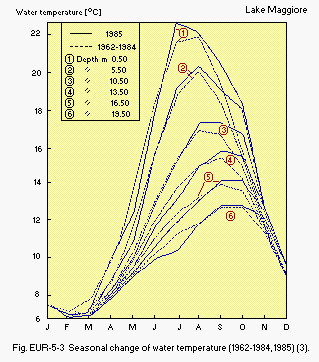
Seasonal change of water temperature, 1962-1984 and 1985 (3).
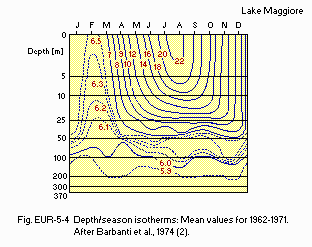
Depth/season isotherms: Mean values for 1962-1971. After Barbanti et al., 1974 (2).
E2 pH: Fig. EUR-05-05.
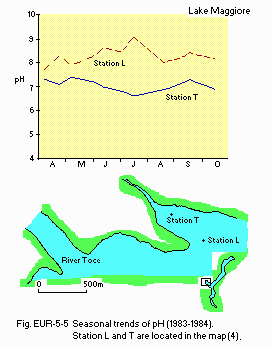
Seasonal trends of pH, 1983-1984. Stations L and T are located in the map below (4).
E3 SS: Fig. EUR-05-06.
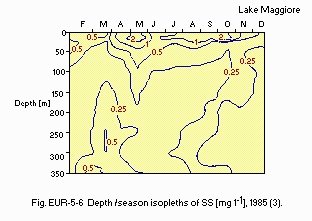
Depth/season isopleths of SS [mg l-1], 1985 (3).
E4 DO: Fig. EUR-05-07.
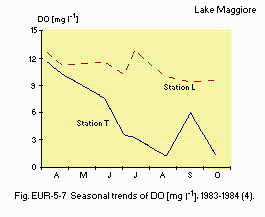
Seasonal trends of DO [mg l-1], 1983-1984 (4).
E6 CHLOROPHYLL CONCENTRATION: Fig. EUR-05-08.
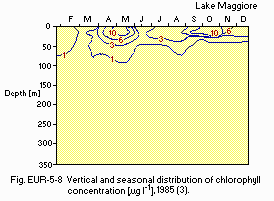
Vertical and seasonal distribution of chlorophyll concentration [micro g l-1], 1985.
E7 NITROGEN CONCENTRATION
- NH4-N: Fig. EUR-05-09.
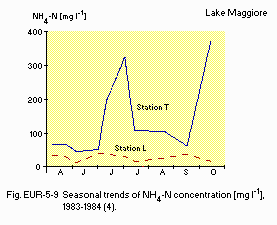
Seasonal trends of NH4-N concentration [mg l-1], 1983-1984 (4).
- NO3-N: Fig. EUR-05-10.
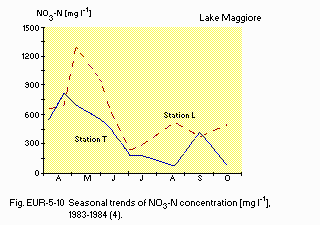
Seasonal trends of NO3-N concentration [mg l-1], 1983-1984 (4).
- PON: Fig. EUR-05-11.
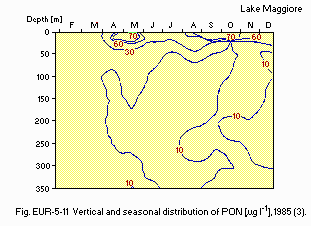
Vertical and seasonal distribution of PON [micro g l-1], 1985 (3).
E8 PHOSPHORUS CONCENTRATION
- PO4-P: Fig. EUR-05-12.
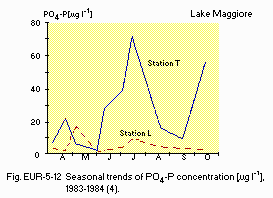
Seasonal trends of PO4-P concentration [micro g l-1], 1983-1984 (4).
- Total-P: Fig. EUR-05-13.
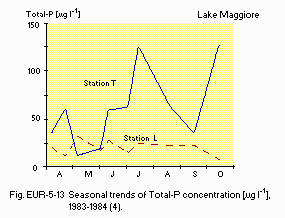
Seasonal trends of Total-P concentration [micro g l-1], 1983-1984 (4).
E10 PAST TRENDS: Fig. EUR-05-14, 15 and 16.
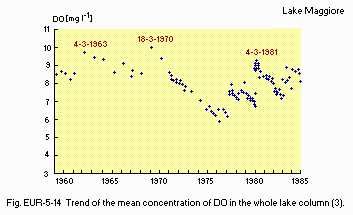
Trend of the mean concentration of DO in the whole lake column (3).
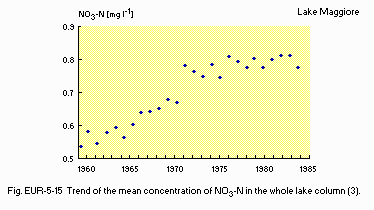
Trend of the mean concentration of NO3-N in the whole lake column (3).
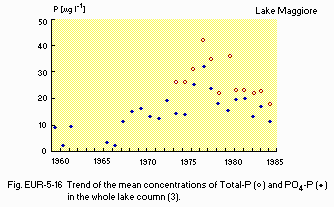
Trend of the mean concentrations of Total-P and PO4-P in the whole lake column (3).
F. BIOLOGICAL FEATURES
F1 FLORA (Q)- Emerged macrophytes
Phragmites australis, Schoenoplectus lacustris, Typha latifolia. - Floating macrophytes: Trapa natans var. verbanensis.
- Submerged macrophytes
Lagarosiphon major, Elodea densa, Myriophyllum spicatum, Ceratophyllum demersum, Potamogeton perfoliatus. - Phytoplankton
Oscillatoria rubescens, Microcystis aeruginosa, Asterionella formosa, Fragilaria crotonensis, Melosira islandica, M. varians, Cyclotella comensis, Synedra acus, Rhodomonas minuta, R. lacustris, Cryptomonas ovata, Ceratium hirundinella, Mougeotia sp.
- Zooplankton
Copepoda (Cyclops abyssorum, Mesocyclops leuckarti, Megacyclops viridis, Mixodiaptomus laciniatus, Eudiaptomus padanus), Cladocera (Daphnia hyalina, Diaphanosoma brachyurum, Bosmina coregoni, Leptodora kindtii, Bythotrephes longimanus), Rotifera (Asplanchna priodonta, Keratella cochlearis, Synchaeta pectinata, S./ oblonga. Polyarthra dolichopteravulgaris, Conochilus unicornis, Pompholyx sulcata). - Benthos
Uncinais uncinata, Stylaria lacustris, Dero digitata, Nais elinguis, Branchiura sowerbyi, Potamothrix hammoniensis, Ilyodrilus templetoni, Limnodrilus hoffmeisteri, Spirosperma ferox, Psammoryctides barbatus, Tubifex tubifex, T. ignotus, Bothrioneurum vejdovskianum.
| Lake centre, 1981 | |||||||||||
| Jan | Feb | Mar | Apr | May | Jun | Jul | Aug | Sep | Oct | Nov | Dec |
|---|---|---|---|---|---|---|---|---|---|---|---|
| 0.07 | - | 1.88 | 1.15 | 0.97 | 0.98 | 1.37 | 0.88 | - | 0.83 | - | - |
- Trapa natans var. verbanensis [g (dry wt.) m-2]
August 1983: 620*. * Maximum biomass Fig. EUR-05-17
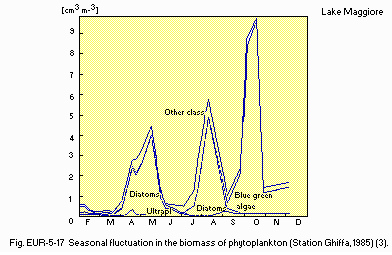
Seasonal fluctuation in the biomass of phytoplankton (Station Ghiffa, 1985)(3).
- Fish biomass [t (dry wt.)](Q)
| 1981 | 1982 | |
|---|---|---|
| Coregonus sp. | 69.1 | 103.2 |
| Alburnus alburnus alborella | 42.7 | 85.0 |
| Perca fluviatilis | 2.3 | 3.5 |
| Salmo trutta | 1.7 | 1.3 |
| Leuciscus cephalus | 0.8 | - |
| Esox Iucius | 0.1 | - |
- Annual fish catch [metric tons]
1981-1982: 155.1.
- Past trend of phytoplankton community
The structure and biomass of phytoplankton community, chlorophyll a concentration and primary productivity have been fairly stable during the last 10-15 years. The production rate has remained more or less the same at ca. 300 g C m-2 yr-1 (14C technique) during 1970-1981.
- Two submerged plant species, Isoetes lacustris and I. echinospora, which once
grew in the lake are now absent.
The copepod, Heterocope saliens, and the cladocera, Sida cristallina, which
lived in open water communities, have disappeared. In the same period, a
cladoceran species, Chydorus spahaericus, colonized open waters occasionally
during summers.
The benthic amphipod, Niphargus foreli, formerly abundant in the 100-370 m
depth zone, is now completely missing. Among Oligochaeta, Tubifex tubifex,
Potamothrix hammoniensis and Stylodrilus heringianus are new settlers, while
Spirosperma ferox and Bythonomus lemani have badly declined.
Though copepods are still the major component of pelagical plankton community,
cladocerans are gradually becoming more and more important.
* During the last 30 years.
G. SOCIO-ECONOMIC CONDITIONS (Q)
G1 LAND USE IN THE DRAINAGE BASIN| Area [km2] | [%] | |
|---|---|---|
| - Natural landscape | ||
| Woody vegetation | 1,301 | 19.8 |
| Rocky outcrops and debris | 1,334 | 20.3 |
| Permanent snow and glacier | 99 | 1.5 |
| Lakes | 312 | 4.8 |
| - Others | 3,516 | 53.6 |
| - Total | 6,562 | 100.0 |
- Main types of woody vegetation (lake level to 2,000 m in altitude)
Deciduous broadleaf forest (Abies, Pinus, Picea, Larix). - Main types of herbaceous vegetation
Meadow (Arrhenatheretum elatioris and Trisetetum florescentis); grazing ground. - Types of the other important vegetation: Shallow freshwater marsh; peat bog.
- Main kinds of crops: Wheat, maize, barley, oat, potato.
- Agriculture
Number of persons engaged (excluding seasonal laborers) 11,542; number of establishments 30,424. - Mining: Number of persons engaged 139,903.
| 1971 | |||
| Population | Population density [km-2] | Major cities (population) | |
|---|---|---|---|
| Total | 669,900 | 101.5 | Locarno, Arona, Stresa, Pallanza, Intra |
H. LAKE UTILIZATION (Q)
H1 LAKE UTILIZATION
-
Source of water, fisheries, navigation, tourism and recreation (swimming,
sport-fishing, yachting).
- Use rates [m3 sec-1]
10 for domestic use, and 112 for industrial use.
I. DETERIORATION OF LAKE ENVIRONMENTS AND HAZARDS (Q)
I3 EUTROPHICATION- Nitrogen and phosphorus loadings to the lake [t yr-1]
T-N: 11,000. T-P: 550.
- Nitrogen and phosphorus loadings from main inflowing rivers [t yr-1](3)
| River | T-N | T-P |
|---|---|---|
| Maggia | 1,400 | 17 |
| Verzasca | 370 | 3.8 |
| Strona | 870 | 9.8 |
| Giona | 78 | 1.2 |
| Ticino immissaric 1,800 | 31 | |
| Cannobino | 140 | 2.1 |
| S. Bernardino | 260 | 3.8 |
| S. Giovanni | 160 | 2.3 |
| Toce (Ossola) | 1,900 | 62 |
| Erno | 60 | 0.7 |
| Vevera | 81 | 6.4 |
| Bardello | 390 | 48 |
| Boesio | 180 | 9.0 |
| Tresa | 1,400 | 65 |
| Total | 9,100 | 261 |
J. WASTEWATER TREATMENTS (Q)
J1 GENERATION OF POLLUTANTS IN THE CATCHMENT AREA-
d) Measurable pollution with limited wastewater treatment.
- Municipal and industrial wastewater treatment systems
14 major plants (treating 45% of total sewage activated sludge plus P and N removal) with several small plants without P and N removal. - Supplementary notes
A system of treatment plants with tertiary treatment is under construction and will be completed presumably in a few years. This will purify all discharge waters from the western side of the lake and from Swiss part of the drainage basin. For the eastern side, the construction of treatment plants is expected to take longer time.
M. LEGISLATIVE AND INSTITUTIONAL MEASURES FOR UPGRADING LAKE ENVIRONMENTS (Q)
M1 NATIONAL AND LOCAL LAWS CONCERNED- Names of the laws (the year of legislation)
- National law Nr 319 (1976)
- National law Nr 650
- Responsible authorities
Regional government and municipalities
N. SOURCES OF DATA
- Questionnaire filled by Dr. R. de Bernardi, Istituto Italiano di Idrobiologia, Pallanza.
- John Bartholomew & Son Ltd. (1985) The Times Atlas of the World, Plate 78. Times Books Ltd., London.
- de Bernardi, R., Giussani, G. & Grimaldi, E. (1984) Lago Maggiore. "Ecosystems of the World 23; Lakes and Reservoirs" (ed. Taub, F. B.), pp. 247-277. Elsevier Science Publishers, Amsterdam.
- Commissione Internazionale per la protezione delle acque italosvizzere (1987) Ricerche sull' evoluzione del Lago Maggiore, Aspetti limnologici Programma quinquennale 1983-1987, Canpagna 1985, pp. 144, Consiglio Nazionale delle Ricerche Istituto Italiano di Idrobiologia (Water Quality Protection Committee of Italy and Switzerland: Report of the limnological survey of Lake Maggiore, Five-year project for 1983-1987. Italian Science and Technology Agency, Italian Institute of Hydrobiology), pp. 144. Pallanza.*
- Commissione Internazionale per la protezione delle acque italosvizzere (P. Guilizzoni e G. Galanti)(l987) Rapporto finale Biomassa, produzione e ciclo dei nutrienti nella zono umida di Fondotoce (Bacino delle Isoke Borromee-Lago Maggiore). Programma triennale 1983-1985. (Water Quality Protection Committee of Italy and Switzerland: Final report on biomass, primary production and nutrient circulation at Fondotoce area (Lake Maggiore, Borromee Island Region), Three-year project for 1983-1985. Italian Science and Technology Agency, Italian Institute of Hydrobiology), pp. 86. Pallanza.*
* The Italian titles are tentatively translated into English in parentheses.


