
TJEUKEMEER
A view at the lake shore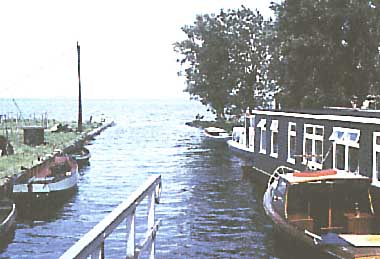
Photo: H. L. Golterman
A. LOCATION
- Frieslands, the Netherlands.
- 52:54N, 5:48E; -1 m above sea level.
B. DESCRIPTION
B. DESCRIPTION
-
Tjeukemeer, a man-made lake, is located at a beeline distance of about 80 km northeast from Amsterdam, beyond Ijsselmeer. Like many other lakes in the Netherlands, this freshwater lake has been built on polder or the land reclaimed from the sea, where sandy soil prevails and the landscape is strangely deficient in vegetation. The lake has a mean depth of 1.8 m, a maximum depth of 5 m, and the water surface lies 1 m below sea level. The surface, however, covers 21 km2, displaying a great achievement in reclamation work which has gathered worldwide reputation.
The residence time of the lake water is fairly short (ca. 0.17 year) because of its shallow depth and small volume. Thermocline does not form throughout the year, and the lake may be frozen for two months during some winters. Transparency ranges from 0.5 m to 1.0 m, and the pH value is always above 8.0, often approaching 9.0. The phytoplankton biomass fluctuates from year to year, but tends to be elevated from May to September and may reach 400-500 mg l-1. Blue-green and green algae predominate the phytoplankton community; about 80% are blue-green from April to July and a similar dominance of green algae is observed from September to December. Eels are an important fishery product of this lake (Q).
C. PHYSICAL DIMENSIONS
| Surface area [km2] | 21 |
| Volume [km3] | 0.042 |
| Maximum depth [m] | 5 |
| Mean depth [m] | 2 |
| Water level | Regulated |
| Length of shoreline [km] | ca. 25 |
| Residence time [yr] | ca. 0.2 |
D. PHYSIOGRAPHIC FEATURES
D1 GEOGRAPHICAL- Sketch map: Fig. EUR-01-01.
- Climatic data at Den Helder*, 1931-1961 (2)
| Mean temp. [deg C] | ||||||||||||
| Jan | Feb | Mar | Apr | May | Jun | Jul | Aug | Sep | Oct | Nov | Dec | Ann. |
|---|---|---|---|---|---|---|---|---|---|---|---|---|
| 2.5 | 2.4 | 4.4 | 7.6 | 11.3 | 14.5 | 16.7 | 17.1 | 15.2 | 11.2 | 7.2 | 4.3 | 9.5 |
| Precipitation [mm] | ||||||||||||
| 65 | 46 | 39 | 40 | 38 | 37 | 64 | 71 | 75 | 90 | 83 | 65 | 714 |
- Number of hours of bright sunshine: 1,665 hr yr-1.
Sketch map of the lake (Q).
- Water temperature [deg C],1970(Q)
| Depth [m] | Jan | Feb | Mar | Apr | May | Jun | Jul | Aug | Sep | Oct | Nov | Dec |
|---|---|---|---|---|---|---|---|---|---|---|---|---|
| 1 | 4.5 | 4 | 5.5 | 8.5 | 13 | 17 | 19.5 | 17 | 14 | 12 | 3 | 5 |
- Freezing period: 0-2 months (not freeze in some years at all).
- Mixing type: Water always mixed.
- Notes on water mixing and thermocline formation
The thermocline formation is none.
E. LAKE WATER QUALITY
E1 TRANSPARENCY [m]: Fig. EUR-01-02.
Annual change of transparency, 1977 (3).
E2 pH: Fig. EUR-01-03.
Annual change of pH value (3).
E4 DO [mg l-1],1971(Q)
| Depth [m] | Jan | Feb | Mar | Apr | May | Jun | Jul | Aug | Sep | Oct | Nov | Dec |
|---|---|---|---|---|---|---|---|---|---|---|---|---|
| 1 | 11.3 | 12.5 | 12.4 | 12.3 | 9 | 9 | 8.7 | 10.5 | 9.5 | 9.8 | 10 | 12 |
| Depth [m] | Jan | Feb | Mar | Apr | May | Jun | Jul | Aug | Sep | Oct | Nov | Dec |
|---|---|---|---|---|---|---|---|---|---|---|---|---|
| 1 | 20 | 18 | 30 | 15 | 17 | 13 | 15 | 13 | 11 | 14 | 20 | 23 |
Past trend of chlorophyll concentration [micro g l-1](4).
E7 NITROGEN CONCENTRATION
- Particulate-N: Fig. EUR-01-05.
Annual change of particulate nitrogen concentration [mg l-1], 1977 (3).
E8 PHOSPHORUS CONCENTRATION
- Particulate-P: Fig. EUR-01-06.
Annual change of particulate phosphorus concentration [mg l-1], 1977 (3).
E9 CHLORIDE CONCENTRATION [mg l-1](Q)
| Depth [m] | Jan-Feb | Mar | Apr | May | Jun-Jul | Aug | Sep | Oct | Nov | Dec |
|---|---|---|---|---|---|---|---|---|---|---|
| 1 | 35-40 | - | - | - | 100-150 | - | - | - | 35-40 | - |
-
No remarkable change.
F. BIOLOGICAL FEATURES
F1 FLORA- Emerged macrophytes: Phragmites sp.
- Submerged macrophytes: Potamogeton sp.
- Phytoplankton (4)
Diatoma elongatum, Asterionella formosa, Senedesmus, Pediastrum, Microcystis aeruginosa, Anabaena, Lyngbya, Merismopedium, Chroococcus, Melosira spp., Chroomonas sp., Oscillatoria sp.
- Zooplankton (5, 6)
Daphnia hyalina, D. cucullata, Acanthocyclops robustus, Mesocyclops leuckarti. - Benthos (7)
Chironomus plumosus, C. anthracinus, Cladotanytarsus mancus, Glyptotendipes pallens, Polypedilum scalaenum, P. unberculosum, Stictochironomus histrio. - Fish (8, 9)
Anguilla anguilla, Abramis brama, Rutilus rutilus, Blicca bjorkna. - Supplementary notes on the biota: Fig. EUR-01-07.
Percent contribution of various algal groups to the total algal volume, 1977.
F4 BIOMASS (5, 6)
- Zooplankton (organic dry wt.)
| Mean Biomass [mg m-2] | Production [mg m-2 yr-1] | |||||
|---|---|---|---|---|---|---|
| 1969 | 1970 | 1971 | 1969 | 1970 | 1971 | |
| D. hyalina | 61.3 | 135.8 | 133.3 | 2,987.0 | 6,136.2 | 6,275.4 |
| D. cucullata | 9.8 | 8.8 | 15.6 | 389.3 | 222.2 | 570.4 |
| A. robustus | 31.0 | 43.6 | 48.0 | 2,892.5 | 3,967.0 | 3,911.6 |
| M. leuckarti | 6.4 | 8.7 | 16.4 | 380.3 | 506.0 | 876.0 |
Biomass (dry wt.) and density of Chironomus plumosus (A) and Glyptotendipes pallens 4th instar larvae (B) in the mud of the inshore zone (8).
F6 PAST TRENDS: Fig. EUR-01-09 (3).
Trend of population density of some important algal species.
F7 NOTES ON THE REMARKABLE CHANGES OF BIOTA IN THE LAKE: Not recorded (Q).
G. SOCIO-ECONOMIC CONDITIONS (Q)
G1 LAND USE IN THE CATCHMENT AREA| Area [km2] | [%] | |
|---|---|---|
| Agricultural land | ||
| Meadows | - | 95 |
| Residential area | - | 5 |
| Total | - | 100 |
- Main kinds of crops: Grass.
- Levels of fertilizer application on crop fields: Moderate.
- Trends of change in land use in recent years: No changes.
-
Agriculture only.
| Population | Population density [km-2] | Major cities (population) | |
|---|---|---|---|
| Total | N.A. | 50-100 |
H. LAKE UTILIZATION (Q)
H1 LAKE UTILIZATION-
Sightseeing and tourism (a few thousand visitors per year), recreation
(yachting), fisheries, control polder water regime (storage in winter).
I. DETERIORATION OF LAKE ENVIRONMENTS AND HAZARDS (Q)
I1 ENHANCED SILTATION- Extent of damage: Not serious.
- Present status: Detected but not serious.
- Nitrogen and phosphorus loadings to the lake [g m-2 yr-1]
| Sources | Industrial | Domestic | Agricultural and natural(gross; measured together) | Year |
| T-N | - | - | 2.73 | 1973 |
| 3.69 | 1974 | |||
| 1.77 | 1975 |
- Extent of damage: None; the lake is well buffered.
J. WASTEWATER TREATMENTS (Q)
J1 GENERATION OF POLLUTANTS IN THE CATCHMENT AREA-
c) Limited pollution with wastewater treatment.
| [%] | |
| Non-point sources | 100 |
| Point sources | 0 |
| Total | 100 |
- Percentage of municipal population in the catchment area provided with adequate sanitary facilities (on-site treatment system) or public sewerage: 95%.
- Municipal wastewater treatment systems: No sewage water entering the lake.
- Industrial wastewater treatment systems: No industry.
K. IMPROVEMENT WORKS IN THE LAKE (Q)
-
None.
L. DEVELOPMENT PLANS (Q)
-
None.
M. LEGISLATIVE AND INSTITUTIONAL MEASURES FOR UPGRADING LAKE ENVIRONMENTS (Q)
M1 NATIONAL AND LOCAL LAWS CONCERNED- Names of the laws (the year of legislation)
- Provincial Water Quality Criteria revised every 5 years.
- Responsible authorities
- Provincial Government
- Provincial Government "Friese Prov. Waterstaat", Leeuwarden
N. SOURCES OF DATA
- Questionnaire filled by Dr. H. L. Golterman, Station Biologique de la Tour du Valat, Arles.
- Leenen, J. D. (1982) Hydrology of Tjeukemeer. "Studies on Lake Vechten and Tjeukemeer, the Netherlands" (ed. Gulati, R. D. & Parma, S.), pp. 199- 203. Dr. W. Junk Publishers, The Hague.
- Muller, M. J. (1982) Selected Climatic Data for a Global Set of Standard Stations for Vegetation Science. 306 pp. Dr. W. Junk Publishers, The Hague.
- de Haan, H. (1982) Physico-chemical environment in Tjeukemeer with special reference to speciation of algal nutrients. "Studies on Lake Vechten and Tjeukemeer, the Netherlands" (see above), pp. 205-223.
- Moed, J. R. & Hoogveld, H. L. (1982) The algal periodicity in Tjeukemeer during 1968-1978. Ibid., pp. 223-234.
- Vijverberg, J. & Richter, A. F. (1982) Population dynamics and production of Daphnia hyalina Leydig and Daphnia cucullata (Sars) in Tjeukemeer. Ibid., pp. 235-260.
- Vijverberg, J. & Richter, A. F. (1982) Population dynamics and production of Acanthocyclops robustus (Sars) and Mesocyclops leuckarti (Claus) in Tjeukemeer. Ibid., pp. 261-274.
- Beauttie, D. M. (1982) Distribution and production of the larval chironomid populations in Tjeukemeer. Ibid., pp. 275-286.
- de Nie, H. W. (1982) A note on the significance of larger bivalve molluscas (Anodonta spp. and Dreissena sp.) in the food of the eel (Anguilla anguilla) in Tjeukemeer. Ibid., pp. 287-306.
- Lammens, E. H. R. R. (1982) Growth, condition and gonad development of bream (Abramis brama) in relation to its feeding conditions in Tjeukemeer. Ibid., pp. 307-310.
- Golterman, H. L., Voerman, S. & de Nie, H. W. (1980) Fosfaat balans van let Tjeukemeer. H2O, 6: 116-122.
