
LAGO XOLOTLAN
A view from an eminence of Managua City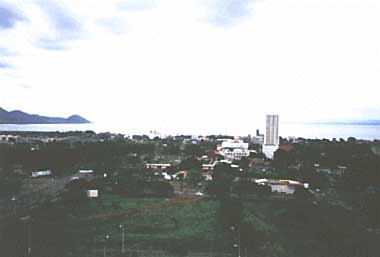
Photo: A.Kurata
A. LOCATION
- Leon and Managua, Nicaragua.
- 12:30N, 86:45W; 37.8 m above sea level.
B. DESCRIPTION
-
Lago Xolotlan, also known as Lake Managua, is situated in the Nicaraguan hydrographic depression or Nicaraguan rift valley, which is separated from the Pacific Ocean by a strip of lowlands, to the northwest of Lake Nicaragua, the largest lake in Central America. The two lakes put together cover almost 10% of the country's total area.
The depression is probably a graben structure formed in the late Tertiary or Quaternary period, though the origin of these two lakes is often described as tectonic or volcanic. There is considerable volcanic activity along the rift valley, and part of it is employed for geo-thermal energy generation.
Lake Managua is endorheic, or a closed lake system in which evaporation approximately equals inflow, and its water level is controlled primarily by evaporation. According to the Nicaraguan Institute of Natural Resources and Environment (IRENA), there are stratigraphic evidences that the lake water level was once higher than the present level by 10 15 m. The lake would then have formed a single great inland water body together with L. Nicaragua. A broad river had connected the two lakes until the 16th century. The remnant of this connection, the Rio Tipitapa was a free-flowing stream as late as in 1840, but ceased to function as a regular outflow by 1850 and now serves as only an occasional overflow mechanism. The total inputs of water are so closely balanced with the average evaporation (2,270 mm yr-1) that the overflow across the threshold of the Rio Tipitapa of 40.75 m has occurred only three times (1933, 1955 and 1982) in recent history.
The lake's mean depth is 7.8 m and the deepest point (26 m) is found in a pit near the volcanic Momotombito Island. A greater part of the drainage basin is located to the north of the lake and drained by three major tributary rivers, Rio Viejo, Rio Sinecapa and Rio Pacora. The total inputs of water varies widely within the drainage basin, geographically, annually and seasonally.
The "dirty dozen" of pesticides from agricultural and pasture lands contaminate the lake. Untreated sewage of one million population of Managua City on the southern shore is also poured into the lake. About 300 small industries discharge their effluents containing mercury, lead other heavy metals and pollutants. Inflowing sediments are mostly fine particles and rich in organic matter. Furthermore, wastes of geothermal energy plants as well as hot spring water containing rich arsenic salts, boron and other substances enter the lake (1, 2).
C. PHYSICAL DIMENSIONS
| Surface area [km2] | 1,016 |
| Volume [km3] | 7.97 |
| Maximum depth [m] | 26 |
| Mean depth [m] | 7.8 |
| Length of shoreline [km] 200 | |
| Residence time [yr] | Endorheic |
| Catchment area [km2] | 6,668 |
D. PHYSIOGRAPHIC FEATURES
D1 GEOGRAPHICAL- Sketch map
- Bathymetric map
- Number of main islands (name and area): Momotombito.
- Number of outflowing rivers and channels: None (endorheic).
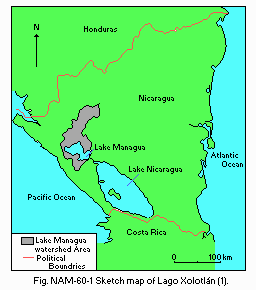
Sketch map of the lake (1).
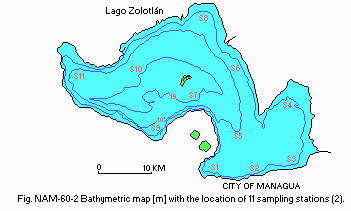
Bathymetric map [m] with the location of 11 sampling stations (2).
D2 CLIMATIC
- Climatic data at Managua, 1951 1960 (3)
| Jan | Feb | Mar | Apr | May | Jun | Jul | Aug | Sep | Oct | Nov | Dec | Ann. | |
|---|---|---|---|---|---|---|---|---|---|---|---|---|---|
| Mean temp. [deg C] | 26.3 | 27.2 | 28.6 | 29.3 | 29.4 | 27.2 | 26.9 | 27.2 | 26.9 | 26.5 | 26.3 | 26.1 | 27.1 |
| Precipitation [mm] | 4 | 1 | 5 | 6 | 76 | 296 | 134 | 130 | 182 | 243 | 59 | 6 | 1,142 |
- Number of hours of bright sunshine: 2,310 hr yr-1.
- Water temperature [deg C]
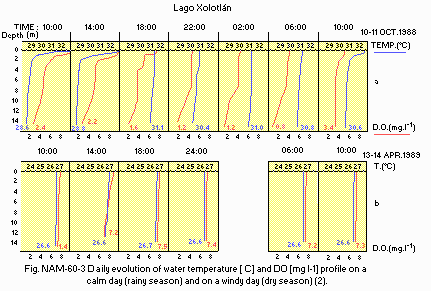
Daily evolution of water temperature [deg C] and DO [mg l-1] profile on a calm day (rainy reason) and on a windy day (dry season)(2).
- Freezing period: None.
- Mixing type: Polymictic.
- Notes on water mixing and thermocline formation
The lake water overturns at least once a day even on calm days and mixing frequency increases when wind force grows.
E. LAKE WATER QUALITY (2)
E1 TRANSPARENCY [m]- Mean for 11 stations, surface, 1988
Rainy season (July August): 0.2.
Dry season (April May): 0.37.
- Mean for 11 stations, surface, 1988
Rainy season (July August): 9.26.
Dry season (April May): 9.18.
- NO3-N [mg l-1]
Mean for 11 stations, surface, 1988
Rainy season (July August): 4.64.
Dry season (April May): 1.60.
- NO2-N [mg l-1]
Mean for 11 stations, surface, 1988
Rainy season (July August): 0.21.
Dry season (April May): 0.05.
F. BIOLOGICAL FEATURES
F1 FLORA- Phytoplankton
Lyngbya contorta, Oocystis spp., Cyclotella spp., Nitzschia acicularis (4).
- Zooplankton
- Fish
Cichlasoma rostratum, C. managuensis, C. citrinellum, Lapisosteus tropicus (1).
Rotifers (Epiphanes macrorous, Brachionus havanaensis, B. angularis, B. caudatus, B. quadridentatus f. brevispinus, B. plicatilis plicatilis, Keratella americana, Lecane bulla bulla, Filinia longiseta var. limnetica, F. pejleri, Asplanchna sieboldi, Hexarthra sp.) Cladocera (Diaphanosoma fluviatile, Moina micrura), Copepoda (Arctodiaptomus dorsalis, Thermocyclops inversus, Mesocyclops nicaraguensis, M. brasilianus).
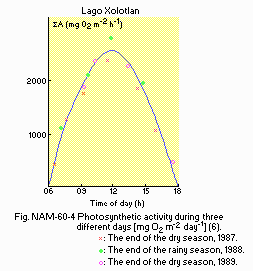
Photosynthetic activity during three different days [mg O2 m-2 day 1](6).
: The end of the dry season, 1987.
: The end of the rainy season, 1988.
: The end of the dry season, 1989.
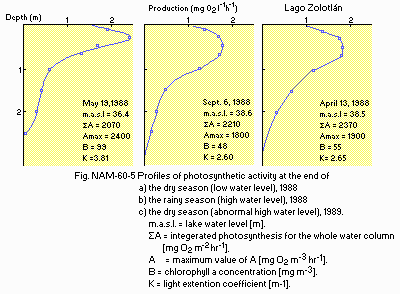
Profiles of photosynthetic activity at the end of
F4 BIOMASS
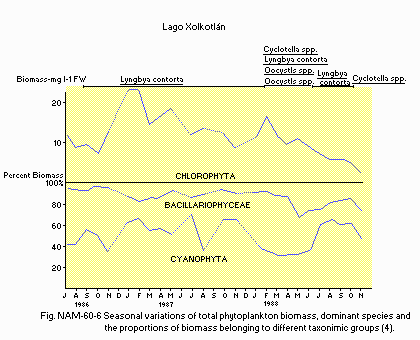
Seasonal variations of total phytoplankton biomass, dominant species and the proportions of biomass belonging to different taxonomic groups (4).
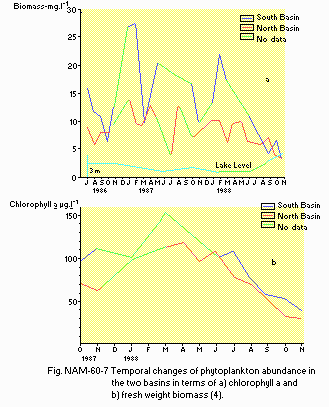
Temporal changes of phytoplankton abundance in the two basins in terms of a) chlorophyll a and b) fresh weight biomass (4).
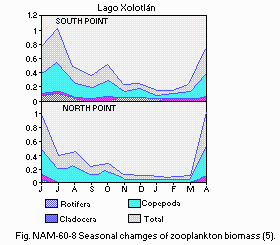
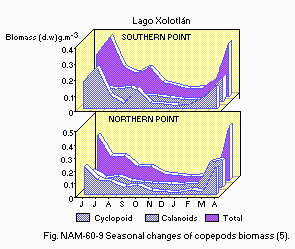
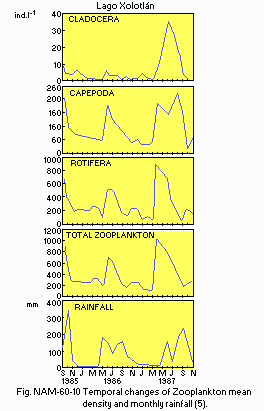
Temporal changes of zooplankton mean density and monthly rainfall (5).
G. SOCIO-ECONOMIC CONDITIONS
G3 POPULATION IN THE CATCHMENT AREA (7) (1992)| Population | Population density [km 2] | Major cities (population) | |
|---|---|---|---|
| Urban | 600,000 | Managua (600,000) | |
| Rural | 400,000 | ||
| Total | 1,000,000 | 150 |
H. LAKE UTILIZATION
H1 LAKE UTILIZATION (1)- Source of water (irrigation and city water), fisheries, tourism and recreation.
I. DETERIORATION OF LAKE ENVIRONMENTS AND HAZARDS
I1 ENHANCED SILTATION (1)- Extent of damage: Serious.
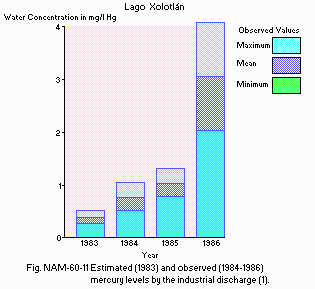
Estimated (1983) and observed (1984 1986) mercury levels by the industrial discharge (1).
- Total mercury concentration (8)
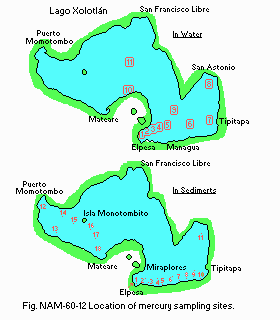
| In water [micro l-1], 1988 | ||
| Sampling site | Jan | Apr |
|---|---|---|
| 1 | 787 | 506 |
| 2 | 215 | 0.24 |
| 3 | 0.19 | 0.21 |
| 4 | - | 0.17 |
| 5 | - | 0.14 |
| 6 | - | 0.17 |
| 7 | - | 0.14 |
| 8 | - | 0.15 |
| 9 | - | 0.11 |
| 10 | - | 0.13 |
| 11 | - | 0.19 |
| In sediments [micro g 1], 1988 1989 | |||||
| Sampling site | Depth [cm] | ||||
|---|---|---|---|---|---|
| 5 | 10 | 15 | 20 | 25 | |
| 1 | 1.6 | 1.3 | 1.6 | 7.3 | 9.2 |
| 2 | 1.8 | 1.2 | 1.3 | 4.4 | 4.5 |
| 3 | 0.56 | 1.12 | 1.0 | 1.0 | 0.82 |
| 4 | 0.58 | 0.87 | 0.1 | 0.53 | 0.1 |
| 5 | 0.6 | 0.53 | 0.49 | 0.37 | 0.27 |
| 6 | 0.84 | 0.96 | 0.94 | 0.90 | 0.61 |
| 7 | 0.42 | 0.32 | 0.27 | 0.35 | 0.23 |
| 8 | 0.42 | 0.39 | 0.27 | 0.26 | 0.22 |
| 9 | 0.23 | 0.06 | 0.06 | 0.06 | 0.13 |
| 10 | 0.16 | 0.13 | 0.12 | 0.09 | 0.20 |
| 11 | - | 0.3 | 0.2 | 0.2 | 0.3 |
| 12 | 0.25 | 0.17 | 0.13 | 0.22 | 0.12 |
| 13 | 0.41 | 0.44 | 0.23 | 0.42 | 0.42 |
| 14 | 0.22 | 0.42 | 0.15 | 0.63 | 0.35 |
| 15 | 0.34 | 0.44 | 0.27 | 0.48 | 0.21 |
| 16 | 0.68 | 0.52 | 0.47 | 0.33 | 0.22 |
| 17 | 0.69 | 0.73 | 0.56 | 0.54 | 0.68 |
| 18 | 0.84 | 0.76 | 0.56 | 0.27 | 0.19 |
- In muscle and liver of Cichlasoma managuense and C. citrinellum
| Area of capture | No. | Hg (min. max.) [micro g 1] | [%] of cases above the permissible value | |
|---|---|---|---|---|
| Cichlasoma managuense | ||||
| - Bahia Miraflores | Muscle | 21 | 0.82 (0.42-1.45) | 100 |
| Liver | 20 | 2.33 (0.28-9.98) | 95 | |
| - Tipitapa | Muscle | 14 | 0.67 (0.43-1.07) | 100 |
| Liver | 21 | 0.24 (0.10-0.70) | 9.5 | |
| - San Francisco Libre | Muscle | 20 | 0.59 (0.40-0.87) | 100 |
| Liver | 25 | 0.46 (0.10-1.17) | 56 | |
| - Puerto Momotombo | Muscle | 25 | 0.48 (0.22-1.02 ) | 70.8 |
| Liver | 30 | 0.43 (0.05-1.17) | 60 | |
| C. cirinellum | ||||
| - Tipitapa | Muscle | 19 | 0.094 (0.008-0.45) | 15.8 |
| Liver | 20 | 0.35 (0.068-1.17) | 35 | |
| - San Francisco Libre | Muscle | 20 | 0.099 (0.008-0.63) | 15 |
| Liver | 20 | 0.88 (0.5-1.97) | 100 | |
| - Puerto Momotombo | Muscle | 21 | 0.021 (0.008-0.06) | 0 |
| Liver | - | - | - | |
- Nitrogen and phosphorus loadings to the lake [t yr-1](1) (1982)
T-N: 2,190.
T-P: 912.
- Extent of damage: None.
J. WASTEWATER TREATMENTS (1)
J1 GENERATION OF POLLUTANTS IN THE CATCHMENT AREA- (f) Severe pollution with limited wastewater treatment.
- Percentage of municipal population in the catchment area provided with
adequate sanitary facilities or public sewerage: 75%.
K. IMPROVEMENT WORKS IN THE LAKE (1)
- None.
L. DEVELOPMENT PLANS (1)
- None.
N. SOURCES OF DATA
- Questionnaire filled by the editors based on the following sources.
- Swain, W. R. (1988) Lake-wide impacts of long-term sources of xenobiotic contaminants: Lake Managua (Nicaragua) and Lake Michigan (United States). "Toxic Contamination in Large Lakes III. Sources, Fate, and Controls of Toxic Contaminants" (ed. Schmidtke, N. W.), pp. 389 427. Lewis Publishers, Chelsea, Michigan.
- Montenegro-Guillen, S. (1991) Verh. Internat. Verein. Limnol., 24: 1,155 1,157.
- Portig, W. H. (1976) The Climate of Central America. "World Survey of Climatology Volume 12, Climates of Central and South America" (ed. Schwerdtfeger, W.), p. 460. Elsevier Scientific Publishing Co., Amsterdam-London-New York.
- Hooker, E. L., et al. (1991) Verh. Internat. Verein. Limnol., 24: 1,158 1,162.
- Cisneros, R. O. & Mangas, E. I. (1991) Ibid., 24: 1,167 1,170.
- Erikson, R. et al., (1991) Ibid., 24: 1,163 1,166.
- Martinez Martinez, F. A., personal communication.
- Lacayo, M., et al. (1991) Verh. Internat. Verein. Limnol., 24: 1,174 1,177
