
LAKE CHAPALA
A view at Chapala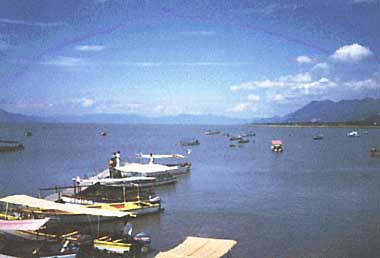
Photo: A.Kurata
A. LOCATION
- Jalisco, Mexico.
- 20:06-20:18N, 102:42-103:25W; 1,524 m above sea level.
B. DESCRIPTION
-
Lake Chapala is the largest natural lake in Mexico, located 42 km south of the metropolitan area of Guadalajara. Hydrologically it belongs to the Rio Lerma Lago de Chapala Rio Santiago drainage system, one of the most important in Mexico. The main tributary R. Lerma supplies almost half of the water input, while the R. Santiago drains the lake water to the Pacific Ocean.
This region, the Mesa Central Region, is a highly unstable geological zone. The lake forms part of an east west oriented graben which is a Tertiary lake system where the majority of once existed lakes are now dry or almost dry. The geological history of the lake is poorly known. It is thought that the present lake basin and the R. Santiago outflow originated in the middle Pleistocene or the late Pliocene. The original drainage was probably from the west end of the lake directly to the Pacific Ocean, but uplifting blocked that flow establishing the present R. Santiago drainage. Terraces provide evidence of lake water level variation due to climatic changes during the Pleistocene.
The catchment area is large as compared with the lake area, amounting to 52,500 km2. Sixteen percent of this area drains directly into the lake via small streams and runoff, while the remainder belongs to the watershed of R. Lerma. The climate is moderate, tropical and sub-humid with a single summer rainy season. Winter rains are less than 5% of the annual precipitation. Average annual evaporation (1,910 mm) greatly exceeds annual precipitation (781 mm in average).
Principal uses of the lake are irrigation, tourism, recreation and fisheries. In addition, it is the main water source for Guadalajara City with a population in excess of 4.5 million. The city used 2.108x1.0E+8 m3 of water in 1986, and water demands are increasing at a rate of 4% per year owing to urban, agricultural and industrial development. Principal industries in the lake's drainage basin are chemical, petrochemical and food processing. However, 93% of the water consumption in the basin are for agriculture. Predominantly untreated wastewaters are released to the R. Lerma. In the lower part of the river near the lake, much of the organic loading comes from pig farms (1).
C. PHYSICAL DIMENSIONS
| Surface area [km2] | 1,112 |
| Volume [km3] | 7.9 |
| Maximum depth [m] | 10.5 |
| Mean depth [m] | 7.2 |
| Water level | Regulated |
| Normal range of annual water level fluctuation [m] | 1.2 |
| Length of shoreline [km] | 215 |
| Residence time [yr] | 10.2 |
| Catchment area [km2] | 52,500 |
D. PHYSIOGRAPHIC FEATURES
D1 GEOGRAPHICAL- Bathymetric map: Fig. NAM-59-1.
- Number of main islands: None.
- Number of outflowing rivers and channels (name): 1 (R. Santiago).
- Climatic data at Guadalajara, 1931 1960 (2)
| Jan | Feb | Mar | Apr | May | Jun | Jul | Aug | Sep | Oct | Nov | Dec | Ann. | |
|---|---|---|---|---|---|---|---|---|---|---|---|---|---|
| Mean temp. [deg C] | 14.7 | 16.6 | 18.4 | 21.1 | 22.9 | 22.3 | 20.5 | 20.5 | 19.9 | 19.1 | 16.9 | 15.2 | 19.0 |
| Precipitation [mm] | 15 | 4 | 4 | 5 | 24 | 172 | 251 | 194 | 158 | 48 | 10 | 8 | 893 |
- Number of hours of bright sunshine: 2,594 hr yr-1.
- Water temperature [deg C]
| Mean value, 1971 1984 | ||||||||||||
| S* | 1 | 2 | 3 | 4 | 5 | 6 | 7 | 8 | 10 | 11 | 12 | 13 |
|---|---|---|---|---|---|---|---|---|---|---|---|---|
| 21.4 | 21.4 | 21.5 | 21.4 | 21.1 | 23.0 | 21.7 | 21.2 | 22.4 | 21.0 | 21.5 | 21.0 | |
| 14 | 15 | 16 | 17 | 20 | 21 | 22 | 23 | 24 | 25 | 26 | 27 | 28 |
| 21.7 | 21.9 | 21.6 | 21.9 | 22.1 | 20.9 | 21.3 | 22.1 | 22.1 | 22.3 | 22.2 | 22.3 | 21.9 |
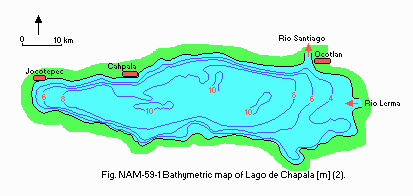
Bathymetric map [m](2).
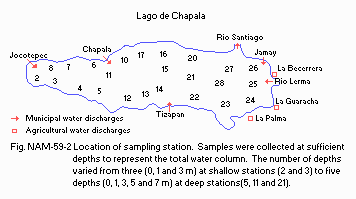
Location of sampling stations. Samples were collected at sufficient depths to represent the total water column. The number of depths varied from three (0, 1 and 3 m) at shallow stations (2 and 3) to five depths (0, 1, 3, 5 and 7 m) at deep stations (5, 11 and 21).
- Freezing period: None.
- Mixing type: Polymictic.
E. LAKE WATER QUALITY
E1 TRANSPARENCY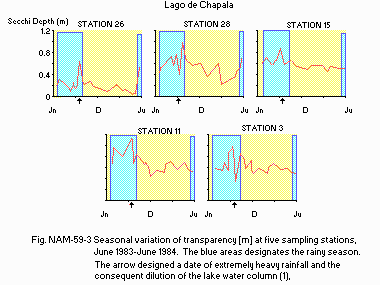
Seasonal variation of transparency [m] at five sampling stations, June 1983 June 1984. Shading designates the rainy season. The arrow designated a date of extremely heavy rainfall and the consequent dilution of the lake water column (1).
E2 pH (1)
- Station 1 28, 1972 1984
8.4 8.8 (mean 8.7).
- Station 1 28, 1972 1984: 19 109 (mean 29.7).
- Station 1 28, 1972 1984: 6.3 7.1 (mean 6.9).
- Lake wide, 1983 1984: 5.4.
- NH4-N [mg l-1]
Lake wide, 1983 1984: 0.145.
- NO3-N [mg l-1]
Lake wide, 1983 1984: 0.367.
- Organic-N [mg l-1]
Lake wide, 1983 1984: 0.705.
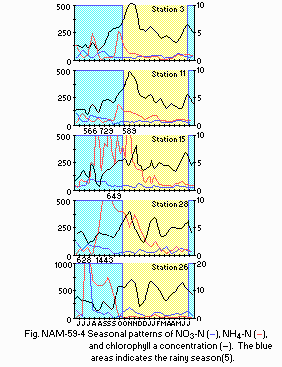
Seasonal patterns of NO3-N (l), NH4-N (n), and chlorophyll a concentration (broken line). Background shading indicates the rainy season (5).
E8 PHOSPHORUS CONCENTRATION
- PO4-P [mg l-1]
Station 1 28, 1972 1984: 0.261 0.480 (mean 0.353).
- Total-P
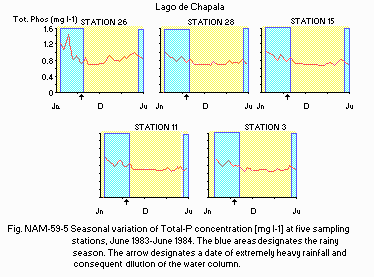
Seasonal variation of Total-P concentration [mg l-1] at five sampling stations, June 1983 June 1984. Shading designates the rainy season. The arrow designates a date of extremely heavy rainfall and consequent dilution of the lake water column.
- Supplementary notes
There is little spatial or seasonal variation in the water chemistry of this large lake. The lack of stratification permits continuous mixing. Only at the extreme eastern end near the mouth of the River Lerma do the chemical properties vary (usually to a minor extent) from the rest of the lake. Seasonal variation likewise is small. The basis for the seasonal variation is the difference in water inputs and outputs during the wet and dry seasons.
- Trend of water balance
Comparison of the annual water balance, 1935 1974 and 1975 1984.
| 1935-1974 | 1975-1984 | [%] change relative to | |||
|---|---|---|---|---|---|
| [1.0E+6 m3] | [%] | [1.0E+6 m3] | [%] | 1935-1974 | |
| Inputs | |||||
| - RiverLerma | 1,915 | 65 | 1,053 | 45 | -45 |
| - Precipitation | 813 | 28 | 891 | 38 | +9.6 |
| - Other | 224 | 7 | 404 | 17 | +45 |
| - Total | 2,952 | 100 | 2,348 | 100 | -20 |
| Outputs | |||||
| - River Santiago | 1,358 | 46 | 920 | 35 | -32 |
| - Evaporation | 1,453 | 49 | 1525 | 58 | +5 |
| - Other | 133 | 5 | 161 | 7 | +21 |
| - Total | 2,945 | 100 | 2,607 | 100 | -11 |
| Retention time [yr] | |||||
| - Mean of period | 5.56 | 10.19 | |||
| - Std. deviation | 2.7 | 5.11 | |||
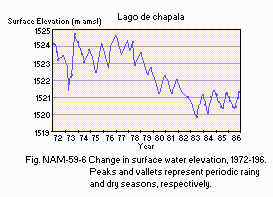
Change in surface water elevation, 1972 1986. Peaks and valleys represent periodic rainy and dry seasons, respectively.
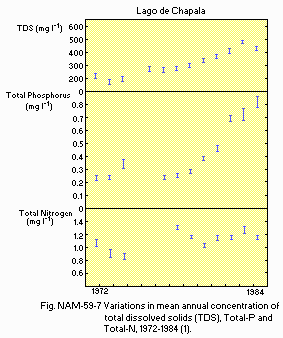
Variations in mean annual concentration of total dissolved solids (TDS), Total-P and Total-N, 1972 1984 (1).
Mean of physical and chemical parameters comparing unusually wet (1976) and dry (1982) years.
| Region*1 | Transparency [m] | pH *2 | SS *2 | NH4-N *2 | O3-N *2 | Org.-N *2 | PO4-P *2 | T-inorg.-p *2 |
|---|---|---|---|---|---|---|---|---|
| 1976 (wet year) | ||||||||
| - West | 0.54 | 8.6 | 23 | 0.299 | 0.204 | 0.911 | 1.250 | 1.619 |
| - Central | 0.57 | 8.6 | 20 | 0.240 | 0.815 | 0.970 | 1.101 | 1.509 |
| - East | 0.42 | 8.6 | 52 | 1.087 | 0.682 | 1.091 | 0.611 | 2.229 |
| - Mean | 0.51 | 8.6 | 30 | 0.498 | 0.547 | 0.983 | 1.018 | 1.750 |
| 1982 (dry year) | ||||||||
| - West | 0.86 | 8.9 | 17 | 0.071 | 0.274 | 0.778 | 0.389 | 0.631 |
| - Central | 0.64 | 9.0 | 15 | 0.091 | 0.264 | 0.779 | 0.400 | 0.691 |
| - East | 0.28 | 8.8 | 39 | 0.059 | 0.382 | 0.676 | 0.423 | 0.691 |
| - Mean | 0.64 | 8.9 | 24 | 0.075 | 0.308 | 0.745 | 0.405 | 0.677 |
East; mean of Stations 20 28.
*2 [mg l-1]
F. BIOLOGICAL FEATURES
F1 FLORA- Floating macrophytes: Eichhornia crassipes.
- Submerged macrophytes: Potamogeton sp.
- Fish: Chirostoma spp., Cyprinus carpio, Sarotheron niloticus.
- Lake wide, 1983 1984: 209.
- Annual fish catch [metric tons]
1981 1987: 8,000.
- Fish
From 1981 to 1987 the fishery yield averaged approximately 8,000 t yr-1 much less than previously. Several species of Chirostoma continue to dominate the fish community, but the harvest of marketable white fish has significantly diminished, from nearly 600 t in 1981 to less than 100 t in recent years. The introduced carp and tilapia are abundant. Carp through their foraging may contribute to sediment re-suspension. It is believed widely that the decline in fish catch is due to either overfishing and/or increased pollution. Alternatively, because the lake is now more light-limited because of re- suspensions of sediments, the fishery decline may be due to a decrease in phytoplankton production at the base of the food chain.
G. SOCIO-ECONOMIC CONDITIONS
G2 INDUSTRIES IN THE CATCHMENT AREA AND THE LAKE- The principal industries in the catchment area are chemical, petrochemical, and food processing. Agriculture is responsible for 93% of the water consumption. In the lower River Lerma, near the lake, pig farming is a major agricultural activity and is undoubtedly a significant (but not measured) contributor to the organic loading.
| Population | Population density [km 2] | Major cities (population) | |
|---|---|---|---|
| Total | 6,230,500 | 118.7 | Guadalajara (4,500,000) |
H. LAKE UTILIZATION (4)
H1 LAKE UTILIZATION- Source of water, sightseeing and tourism, recreation, commercial fisheries.
- The principal water output from the lake now is evaporation and the other important output is via the River Santiago most of which is immediately pumped for the water supply of Guadalajara Metropolitan Area.
I. DETERIORATION OF LAKE ENVIRONMENTS AND HAZARDS (4)
I1 ENHANCED SILTATION- Extent of damage: Serious.
- Present status: Suspected but not serious.
- Nuisance caused by eutrophication: None.
Biomass of phytoplankton is moderately low, averaging 5.4 mg chlorophyll a m-3. Production is lowest at the eastern (more turbid) end of the lake where the photic depth is usually less than 1 m. - Nitrogen and phosphorous loadings to the lake (4)
Load estimates of selected pollutants to the lake from various sources (after Grupo Hidrosanitec, 1986).
| River Lerma | Municipal wastewater | |||
|---|---|---|---|---|
| [t yr-1] | [%] | [t yr-1] | [%] | |
| BOD | 6,486 | 83.6 | 834.4 | 10.7 |
| T-N | 4,105 | 77.5 | 155 | 2.9 |
| T-P | 1,202 | 85.4 | 42 | 3.1 |
| T-S | 1,416,375 | 97.1 | 4,824 | 0.4 |
| Agricultural return flows | Other nonpoint sources | Total | ||||
|---|---|---|---|---|---|---|
| [t yr-1] | [%] | [t yr-1] | [%] | [t yr-1] | [%] | |
| BOD | 436.2 | 5.7 | 7,756 | 100 | ||
| T-N | 208.0 | 4.0 | 830 | 15.6 | 5,298 | 100 |
| T-P | 90 | 6.4 | 73 | 5.1 | 1,407 | 100 |
| T-S | 36,629.0 | 2.5 | 1,457,828 | 100 | ||
- Extent of damage: None.
J. WASTEWATER TREATMENTS
J1 GENERATION OF POLLUTANTS IN THE CATCHMENT AREA- (d) Measurable pollution with limited wastewater treatment.
- Percentage of municipal population in the catchment area provided with
adequate sanitary facilities or public sewerage: 80%. - Percentage of rural population with adequate sanitary facilities: 80%.
- Municipal wastewater treatment systems
No. of secondary treatment systems: 16.
K. IMPROVEMENT WORKS IN THE LAKE (4)
- None.
L. DEVELOPMENT PLANS (4)
- None.
M. LEGISLATIVE AND INSTITUTIONAL MEASURES FOR UPGRADING LAKE ENVIRONMENTS
M3 RESEARCH INSTITUTES ENGAGED IN THE LAKE ENVIRONMENT STUDIES- Water Treatment Department, Sistema Intermunicipal de Abastecimiento de Agua y Alcantarillado de la Zona Metropolitana de Guadalajara (SIAPA)
- Centro Estudios Limnologicos, S.A.R.H., Guadalajara
- Escuela de Biologia, Universidad Autonoma de Guadalajara
- Gobierno del Estado de Jalisco
N. SOURCES OF DATA
- Questionnaire filled by the editors with the support of Dr. O. T. Lind, Department of Biology, Baylor University, Waco, Texas, USA.
- Limon M., J. G., Lind, O. T., Vodopich, D. S., Doyle, R. & Trotter, B. G. (1989) Arch. Hydrobiol. Suppl. 83 (1): 57 81.
- Mosino Aleman, P. A. & Garcia, E. (1974) The climate of Mexico. "World Survey of Climatology Volume 11, Climates of North America" (ed. Bryson, R. A. & Hare, F. K.), p. 271. Elsevier Scientific Publishing Co., Amsterdam-London-New York.
- Lind, O. T. & Davalos-Lind, L. (1991) Limnol. Oceanogr., 36 (6): 1200 1208.
- Limon M., J. G. & Lind, O. T. (1990) Lake Reservoir Management, 6 (1): 61 70.
- Lind, O. T., Doyle, R., Vodopich, D. S. & Trotter, B. G. (1992) Limnol. Oceanogr., 37 (3): 549 565.
- Gobierno del Estado de Jalisco (1990) Chapala Un Lago para Mexico. 109 pp. Guadalajara.
