BUFFALO POUND LAKE
An aerial view of the lake's east end showing outlet
control structures and heavy growth of macrophytes
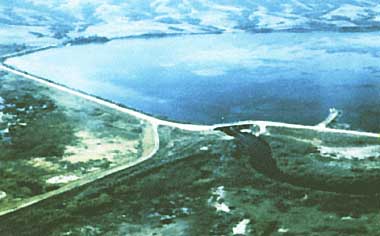
Photo: Prairie Farm Rehabilitation, Regina
A. LOCATION
- Saskatchewan, Canada.
- 50:12-50:35N, 105:03-105:23W; 509 m above sea level.
B. DESCRIPTION
Buffalo Pound Lake is a small prairie lake located near the headwaters of the Qu'Appelle River in south central Saskatchewan. The drainage basin of the lake is located in the heart of the Canadian plain and is typically a flat to gently undulating treeless plain which has been cultivated chiefly for cereal grain production. The lake provides drinking water for the cities of Moose Jaw and Regina and is an important recreational resource, supporting a number of cottage developments, a provincial park and a sport fishery.
Buffalo Pound Lake is naturally eutrophic due to the input from nutrient rich soils in the basin. The eutrophic state was aggravated by increased erosion following the breaking of the natural prairie during the early 1900's. The small size of the drainage basin and low precipitation combined with high evaporation caused the natural lake levels to vary widely. These wide fluctuations were reduced by regulation of the outflow in 1949. The 1967 initiation of water diversion from Lake Diefenbaker on the South Saskatchewan River all but eliminated the fluctuation in lake level and also provides for a greatly increased flushing rate with high quality water from the South Saskatchewan River system. The water diversion represents more than 90% of the inflow to Buffalo Pound Lake in most years. Despite the diversion of high quality water into Buffalo Pound Lake and controlling lake levels, the lake remains eutrophic. Major algal blooms and heavy growths of macrophytes occur every summer reducing the recreational potential of the lake and adding greatly to the cost of treating drinking water (Q).
C. PHYSICAL DIMENSIONS
| Surface area [km2] | 29.5 |
| Volume [km3] | 0.0898 |
| Maximum depth [m] | 5.6 |
| Mean depth [m] | 3.0 |
| Water level | Regulated |
| Length of shoreline [km] | 72.5 |
| Residence time [yr] | 1.5 |
| Catchment area [km2] | 3,310 |
D. PHYSIOGRAPHIC FEATURES
D1 GEOGRAPHICAL
- Sketch map: Fig. NAM-57-01.
- Names of main islands: None.
- Number of outflowing rivers and channels (name): 1 (Qu'Appelle R.).
D2 CLIMATIC
- Climatic data at Moose Jaw A*, 1951-1980 (2)
| Jan | Feb | Mar | Apr | May | Jun | Jul | Aug | Sep | Oct | Nov | Dec | Ann. |
| Mean temp. [deg C] | -15.8 | -11.5 | -5.6 | 4.2 | 11.5 | 16.6 | 19.7 | 18.6 | 12.5 | 6.4 | -3.6 | -10.7 | 3.5 |
| Precipitation [mm] | 19 | 15 | 18 | 30 | 49 | 66 | 53 | 40 | 36 | 18 | 17 | 21 | 382 |
* Circa 25 km south of the lake.
- Number of hours of bright sunshine: 2,330 hr yr-1.
- Solar radiation (Swift Current*)[MJ m-2 day-1]
| Jan | Feb | Mar | Apr | May | Jun | Jul | Aug | Sep | Oct | Nov | Dec | Ann. |
| 5.05 | 8.72 | 14.05 | 17.86 | 21.58 | 23.14 | 24.35 | 20.13 | 14.36 | 9.45 | 5.27 | 3.83 | 13.9 |
* Circa 175 km west-southwest of the lake.
Fig. NAM-57-01
Sketch map of the lake (Q).
- Water temperature [deg C](3, 4)
| Middle lake opposite water treatment plant, 1980-1986 |
| Depth [m] | Jan | Feb | Mar | Apr | May | Jun | Jul | Aug | Sep | Oct | Nov | Dec |
| 0.5 | 1.0 | 0.50 | 1.0 | - | 8.5 | 17.0 | 22.0 | 18.5 | 11.0 | - | 0.5 | 0.5 |
- Freezing period: 1 November-15 April.
- Mixing type: Polymictic.
E. LAKE WATER QUALITY
Middle lake opposite water treatment plant, 1980-1986 (3, 4)
E1 TRANSPARENCY [m]
| Jan | Feb | Mar | Apr | May | Jun | Jul | Aug | Sep | Oct | Nov | Dec |
| 0.9 | 1.9 | 1.0 | - | - | 2.5 | 1.0 | 1.1 | - | 0.7 | - | - |
E2 pH
| Depth [m] | Jan | Feb | Mar | Apr | May | Jun | Jul | Aug | Sep | Oct | Nov | Dec |
| 0.5 | 8.1 | 8.1 | - | - | 8.5 | 8.3 | 8.6 | 8.4 | 8.9 | 7.9 | - | - |
E3 SS [mg l-1]
| Depth [m] | Jan | Feb | Mar | Apr | May | Jun | Jul | Aug | Sep | Oct | Nov | Dec |
| 0.5 | 5 | 3 | - | - | 5 | 5 | 6 | 4 | 5 | 12 | 4 | - |
E4 DO [mg l-1]
| Depth [m] | Jan | Feb | Mar | Apr | May | Jun | Jul | Aug | Sep | Oct | Nov | Dec |
| 0.5 | - | 10.9 | - | - | 10.2 | 8.9 | 7.9 | 7.0 | 9.3 | 11.3 | 12.8 | - |
E6 CHLOROPHYLL CONCENTRATION [micro l-1]
| Depth [m] | Jan | Feb | Mar | Apr | May | Jun | Jul | Aug | Sep | Oct | Nov | Dec |
| 0.5 | 3 | 13 | 3 | - | 3 | 14 | 13 | 27 | 10 | 11 | 8 | <1 |
E7 NITROGEN CONCENTRATION
- Total Kjeldahl-N [mg l-1]
| Depth [m] | Jan | Feb | Mar | Apr | May | Jun | Jul | Aug | Sep | Oct | Nov | Dec |
| 0.5 | 0.9 | 0.7 | - | - | 0.8 | 0.6 | 1.3 | 0.7 | 1.2 | 0.9 | - | 0.6 |
E8 PHOSPHORUS CONCENTRATION
| Depth [m] | Jan | Feb | Mar | Apr | May | Jun | Jul | Aug | Sep | Oct | Nov | Dec |
| 0.5 | 0.12 | 0.90 | - | - | 0.07 | 0.12 | 0.10 | 0.12 | 0.14 | 0.10 | - | - |
F. BIOLOGICAL FEATURES
F1 FLORA (5)
- Submerged macrophytes
Dominant in summer 1988 (Elodea canadensis, Myriophyllum exalbescens, Potamogeton richardsonii); dominant in 1972-1974 (Potamogeton richardsonii, P. pectinatus, Ceratophyllum demersum).
- Phytoplankton
Microcystis aeruginosa, Aphanizomenon flos-aquae, Anabaena flos-aquae, Oscillatoria prolifica, Pediastrum duplex, Asterionella formosa, Stephanodiscus niagarae.
F2 FAUNA
- Fish
Perca flavescens, Castostomus commensoni, Ictiobus cyprinellus, Esox lucius, Stizostedion vitreum, Cyprinus carpio, Pimephales promelus, Pungitius pungitius, Notropis atherinoides, N. hudsonius.
F3 PRIMARY PRODUCTION RATE: Fig. NAM-57-02.
Fig. NAM-57-02
Vertical variations in daily production [mg C m-3 day-1] in 1967 and 1979 (5).
F4 BIOMASS
Fig. NAM-57-03 (5)
Seasonal variations in phytoplankton biomass of major algal phyla, 1965.
- Zooplankton density (8)
Mean density in 1975, middle lake: Protozoans 963 l-1, rotifers 321 l-1, cladocerans 321 l-1, Copepods 86 l-1.
F5 FISHERY PRODUCTS
There is no commercial fishery.
G. SOCIO-ECONOMIC CONDITIONS
G1 LAND USE IN THE CATCHMENT AREA (6) (1986)
| Area [km2] | [%] |
| Agricultural land |
| - Crop field | ca. 2,980 | 90 |
| - Pasture land | ca. 330 | 10 |
| Total | 3,310 | 100 |
- Types of important woody vegetation: Little or no forest/scrub communities.
- Types of important herbaceous vegetation: Crop field and pasture land.
- Main kinds of crops and/or cropping systems
Grains (wheat, oat, barley) and oil seeds (canola, flax).
- Levels of fertilizer application on crop fields: Moderate.
- Trend of change in land use in recent years: None.
G2 INDUSTRIES IN THE CATCHMENT AREA AND THE LAKE (1979)
| Main products or major industries |
| Primary Industry |
| - Crop production | Grains, oil seeds |
| - Animal husbandry | Beef |
| Tertiary Industry | Machinery repair (small agricultural service industry) |
G3 POPULATION IN THE CATCHMENT AREA (1986)
| Population | Population density [km-2] | Major cities (population) |
| Rural | 4,500 | 1.36 | None |
H. LAKE UTILIZATION
H1 LAKE UTILIZATION
Source of water and recreation (swimming, sport-fishing).
H2 THE LAKE AS WATER RESOURCE (1983)
| Use rate [t yr-1] |
| Domestic | 29,700,000 |
| Industrial | 5,200,000 |
I. DETERIORATION OF LAKE ENVIRONMENTS AND HAZARDS
I1 ENHANCED SILTATION
- Extent of damage: Not serious.
I2 TOXIC CONTAMINATION
- Present status: Detected but not serious.
- Main contaminants, their concentration and sources
Water treatment plant intake 1979-1981 (fish) and 1987 (water)
| Name of contaminant | Concentration in |
| Water [ng l-1] | Fish* [ppb] |
| Lindane | 0.08-0.16 (4) |
| Alpha-BHC | 0.39-0.42 (4) |
| Mercury | | 0.2-0.5 (7) |
* Wet weight basis. Pike, walleye muscle.
I3 EUTROPHICATION
- Nuisance caused by eutrophication
Foul odour of tap water and disruption of recreational activities.
- Supplementary notes
Despite the high flushing rate of Buffalo Pound Lake which resulted from the 1967 diversion of a considerable flow from Lake Diefenbaker, dense blooms of algae develop each summer as do dense littoral zone stands of higher aquatic plants.
I4 ACIDIFICATION
J. WASTEWATER TREATMENTS
J1 GENERATION OF POLLUTANTS IN THE CATCHMENT AREA
(f) Measurable nutrient input mainly from natural sources with limited wastewater treatment.
J2 APPROXIMATE PERCENTAGE DISTRIBUTION OF POLLUTANT LOADS
| [%] |
| Non-point sources | 95 |
| Point sources |
| - Municipal & domestic | 5 |
| Total | 100 |
J3 SANITARY FACILITIES AND SEWERAGE
- Municipal wastewater treatment systems
No. of primary treatment systems: 6 (primary lagoons).
No. of industrial wastewater treatment systems: None.
K. IMPROVEMENT WORKS IN THE LAKE
Water level control (1949) - construction of control dam. Water diversion from Lake Diefenbaker (1967).
M. LEGISLATIVE AND INSTITUTIONAL MEASURES FOR UPGRADING LAKE ENVIRONMENTS
M1 NATIONAL AND LOCAL LAWS CONCERNED
- Names of the laws (the year of legislation)
- Water Resources Management (1972)
- Pollution (by livestock) Control Act (1971)
- Pest Control Products (Sask.) Act (1973)
- Canada Water Act (1970)
- Responsible authorities
- Saskatchewan Environment
- Saskatchewan Environment
- Saskatchewan Environment
- Environment Canada
- Main items of control
- Water pollution
- Livestock operations
- Use of pesticides on water bodies
M2 INSTITUTIONAL MEASURES (the year of establishment)
- Saskatchewan Environment (1972)
- Saskatchewan Water Corporation (1984)
- Canada/Saskatchewan Qu'Appelle Agreement (1974-1984)
M3 RESEARCH INSTITUTES ENGAGED IN THE LAKE ENVIRONMENT STUDIES
- Region Water Research Institute, University of Regina
N. SOURCES OF DATA
- Questionnaire filled by Dr. D. Munro, Conservation and Protection, Water Quality Branch, Environment Canada, Regina, Saskatchewan, Canada.
- Saskatchewan Water Corporation (1986) 1983 Operation of the Qu'Appelle River System. Resource Management Hydrology Service, Moose Jaw, Saskatchewan.
- Environment Canada, Atmospheric Environment Service. Canada Climate Normals, 1951 -1980. Winnipeg, Manitoba.
- Saskatchewan Department of Environment and Public Safety, Regina, Saskatchewan. Unpublished data.
- Environment Canada, Inland Waters Directorate, Regina, Saskatchewan. Unpublished data.
- Hammer, U. T. (1983) Limnological studies of the lakes and streams of the upper Qu'Appelle River systems, Saskatchewan, Canada. Hydrobiologia, 99: 125-144.
- Saskatchewan Agriculture (1987) Agricultural Statistics 1986. Regina, Saskatchewan.
- Jackson, T. A. (1983) Mercury in the Qu'Appelle River System of Saskatchewan and Its Lakes and Tributaries. National Water Research Institute, Winnipeg, Manitoba.

