
BUTTLE LAKE
A northward view from the southwest corner of the South Basin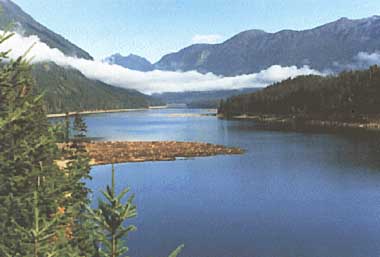
Photo: M.J.R.Clark, P.Lucey, J.Deniseger and L.Erickson
A. LOCATION
- British Columbia, Canada.
- 49:31-50:04N, 125:31W; 218 m above sea level.
B. DESCRIPTION
-
Buttle Lake lies at the head of the Campbell River system which drains an area of 1,404 km2 in the central part of Vancouver Island. The drainage basin is located in the Coastal Mountains region of recently glaciated intrusive rocks and has a maritime climate. Buttle Lake lies within the coastal western hemlock zone characterized by Douglas fir, western hemlock and western red cedar.
Buttle Lake has a typical elevation of 218 m and is oriented in a north-south direction. It connects by a narrow passage to Upper Campbell Lake which feeds Lower Campbell Lake and in turn John Hart Lake and the Campbell River which flows to the sea 20 km away.
Buttle Lake is a long narrow lake and sits within a 'U-shaped' valley typical of the region having steep rock walls and a broad flat floor of unconsolidated glacial deposit. Surrounded on both sides by extensive mountain systems, the valley floor consists of many irregular knolls, depressions and long meandering gravel ridges characteristic of recently glaciated areas.
It is an ultra-oligotrophic soft water lake. Since the lake and much of its watershed have been within a provincial park since 1911, the watershed has been largely undisturbed except for forest fires until dam construction in 1958 and mine construction in 1966.
In 1958 the Strathcona Dam (power generation for B. C. Hydro) raised the levels of Upper Campbell and Buttle Lakes by 8.5 m while regulating the water level which now fluctuates some 9.0 m annually. Except during maximum reservoir draw-down, the two lakes usually have a common elevation. Approximately 8 km from its southern end occurs a sill of some 40 m depth which defines a well defined basin somewhat isolated from the remainder of Buttle Lake. In 1966 a copper-lead-zinc mine began operation near the southern end of the lake. Mine tailings from the mill were deposited directly into the south basin till 1984; additionally, acid mine generation in the drainage basin had released metals, especially copper, zinc and cadmium, which contaminated the lake via Myra Creek which discharges to the same basin. In 1983 a surface and groundwater collection and treatment system was installed at the mine site and in 1984 an on-land tailings disposal system replaced the lake disposal. These remedial measures have greatly reduced concentration of toxic metals in the lake and biological communities have returned to their former abundance (Q).
C. PHYSICAL DIMENSIONS (3, 22)
| Surface area [km2] | 35 |
| Volume [km3] | 1.72 |
| Maximum depth [m] | 125 |
| Mean depth [m] | 48.8 |
| Water level | Regulated |
| Normal range of annual water level fluctuation [m] | 9.0 |
| Length of shoreline [km] | 75 |
| Residence time [yr] | 1.0 |
| Catchment area [km2] | 705 |
D. PHYSIOGRAPHIC FEATURES
D1 GEOGRAPHICAL- Sketch map
- Bathymetric map
- Names of main islands: None.
- Number of outflowing rivers and channels (name): 1 (Campbell R.).
- Climatic data at Campbell River BCFS*, 1951-1980 (4)
| Jan | Feb | Mar | Apr | May | Jun | Jul | Aug | Sep | Oct | Nov | Dec | Ann. | |
|---|---|---|---|---|---|---|---|---|---|---|---|---|---|
| Mean temp. [deg C] | 1.2 | 3.4 | 4.4 | 7.8 | 11.7 | 14.7 | 17.1 | 17.0 | 13.8 | 9.3 | 4.7 | 2.3 | 9.0 |
| Precipitation [mm] | 225 | 189 | 163 | 78 | 63 | 60 | 43 | 67 | 82 | 185 | 230 | 271 | 1,656 |
- Number of hours of bright sunshine (Nanaimo Airport*): 1,811 hr yr-1.
* Circa 112 km to the south. - Solar radiation (Nanaimo Departure Bay)[MJ m-2 day-1]
| Jan | Feb | Mar | Apr | May | Jun | Jul | Aug | Sep | Oct | Nov | Dec | Ann. |
|---|---|---|---|---|---|---|---|---|---|---|---|---|
| 2.93 | 5.85 | 10.5 | 15.9 | 21.0 | 22.1 | 23.7 | 19.5 | 13.6 | 7.83 | 3.74 | 2.27 | 12.4 |
Sketch map (Q).
Bathymetric map [m](3).
- Water temperature [deg C]
| South basin*, 1985-1986 | ||||||||||||
| 1986 | 1985 | |||||||||||
|---|---|---|---|---|---|---|---|---|---|---|---|---|
| Depth [m] | Jan | Feb | Mar | Apr | May | Jun | Jul | Aug | Sep | Oct | Nov | Dec |
| 0 | - | 3.13 | 3.84 | 6.52 | 7.86 | 13.96 | 16.02 | 21.34 | 16.61 | - | - | 4.53 |
| 5 | - | 3.36 | 3.70 | 6.22 | 7.85 | 13.17 | 14.65 | 20.81 | 16.11 | - | - | 4.55 |
| 10 | - | 3.43 | 3.64 | 5.93 | 7.57 | 10.74 | 12.70 | 18.19 | 15.7 | - | - | 4.55 |
| 15 | - | 3.56 | 3.55 | 5.49 | 6.43 | 8.66 | 10.77 | 12.92 | 12.0 | - | - | 4.55 |
| 20 | - | 3.72 | 3.39 | 4.68 | 5.97 | 7.36 | 7.75 | 7.88 | 8.2 | - | - | 4.55 |
| 25 | - | 3.51 | 3.31 | 4.59 | 5.07 | 6.56 | 6.65 | 7.05 | 7.3 | - | - | 4.52 |
| 30 | - | 3.51 | 3.24 | 4.37 | 4.89 | 6.14 | 6.40 | 6.71 | 7.0 | - | - | 4.52 |
| 35 | - | 3.49 | 3.21 | 4.21 | 4.76 | 5.70 | 6.10 | 6.43 | 6.5 | - | - | 4.52 |
- Freezing period: Usually not freeze over.
- Mixing type: Monomictic.
E. LAKE WATER QUALITY
-
Sampling station: 3 km north of Thelwood Creek (082), south basin.
| Jan | Feb | Mar | Apr | May | Jun | Jul | Aug | Sep | Oct | Nov | Dec |
|---|---|---|---|---|---|---|---|---|---|---|---|
| - | 5 | 5 | 7 | 6 | 6 | 8 | 14 | - | - | - | - |
| 1986 | 1985 | |||||||||||
|---|---|---|---|---|---|---|---|---|---|---|---|---|
| Depth [m] | Jan | Feb | Mar | Apr | May | Jun | Jul | Aug | Sep | Oct | Nov | Dec |
| 0 | - | 7.5 | 7.1 | 7.2 | 7.3 | 7.0 | 7.3 | 7.3 | 7.3 | - | - | 7.3 |
| 5 | - | 7.4 | 7.0 | 7.2 | 7.3 | 7.1 | 7.3 | 7.3 | 7.3 | - | - | 7.2 |
| 10 | - | 7.4 | 7.0 | 7.2 | 7.3 | 7.1 | 7.3 | 7.2 | 7.3 | - | - | 7.1 |
| 15 | - | 7.3 | 7.0 | 7.2 | 7.3 | 7.1 | 7.3 | 7.1 | 7.2 | - | - | 7.1 |
| 20 | - | 7.3 | 7.0 | 7.1 | 7.2 | 7.1 | 7.1 | 7.0 | 7.1 | - | - | 7.1 |
| 25 | - | 7.3 | 7.0 | 7.1 | 7.2 | 7.0 | 7.1 | 7.0 | 7.1 | - | - | 7.1 |
| 30 | - | 7.3 | 7.0 | 7.1 | 7.1 | 7.0 | 7.1 | 6.9 | 7.0 | - | - | 7.1 |
| 35 | - | 7.3 | 7.0 | 7.1 | 7.1 | 7.0 | 7.1 | 6.9 | 7.0 | - | - | 7.1 |
| 1986 | 1985 | |||||||||||
|---|---|---|---|---|---|---|---|---|---|---|---|---|
| Depth [m] | Jan | Feb | Mar | Apr | May | Jun | Jul | Aug | Sep | Oct | Nov | Dec |
| 0 | - | 2 | - | 1 | 1 | 1 | <1 | <1 | <1 | <1 | - | - |
| 10 | - | 2 | - | 1 | 1 | 2 | <1 | <1 | 1 | - | - | - |
| 20 | - | 2 | - | 1 | 1 | 2 | <1 | <1 | <1 | - | - | - |
| 30 | - | 1 | - | 1 | 1 | 2 | <1 | <1 | <1 | - | - | - |
| 40 | - | 2 | - | 1 | 2 | 2 | <1 | <1 | <1 | - | - | - |
| 60 | - | 2 | - | 1 | 1 | 1 | <1 | <1 | <1 | - | - | - |
| 1986 | 1985 | |||||||||||
|---|---|---|---|---|---|---|---|---|---|---|---|---|
| Depth [m] | Jan | Feb | Mar | Apr | May | Jun | Jul | Aug | Sep | Oct | Nov | Dec |
| 0 | - | 9.4 | 13.2 | 12.5 | 12.1 | 11.1 | 10.2 | 9.0 | 10.1 | - | - | 11.4 |
| 5 | - | 9.5 | 13.0 | 12.5 | 12.1 | 11.2 | 10.1 | 9.1 | 9.9 | - | - | 11.3 |
| 10 | - | 8.9 | 12.9 | 12.4 | 12.1 | 11.3 | 10.5 | 9.2 | 9.9 | - | - | 11.3 |
| 15 | - | 8.7 | 12.8 | 12.5 | 12.2 | 11.6 | 10.4 | 10.3 | 10.8 | - | - | 11.2 |
| 20 | - | 8.3 | 12.7 | 12.5 | 12.2 | 12.1 | 11.5 | 11.1 | 11.6 | - | - | 11.2 |
| 25 | - | 8.4 | 12.6 | 12.4 | 12.1 | 12.1 | 11.7 | 11.3 | 11.7 | - | - | 11.2 |
| 30 | - | 8.4 | 12.4 | 12.3 | 12.1 | 12.0 | 11.7 | 11.3 | 11.7 | - | - | 11.1 |
| 35 | - | 8.5 | 12.2 | 12.2 | 12.1 | 11.9 | 11.6 | 11.3 | 11.7 | - | - | 11.1 |
| 1986 | 1985 | |||||||||||
|---|---|---|---|---|---|---|---|---|---|---|---|---|
| Depth [m] | Jan | Feb | Mar | Apr | May | Jun | Jul | Aug | Sep | Oct | Nov | Dec |
| 1.0 | - | <0.5 | <0.5 | 0.7 | 1.0 | 0.6 | <0.5 | <0.5 | <0.5 | 0.7 | - | - |
- Total-N [mg l-1]
| 1986 | 1985 | |||||||||||
|---|---|---|---|---|---|---|---|---|---|---|---|---|
| Depth [m] | Jan | Feb | Mar | Apr | May | Jun | Jul | Aug | Sep | Oct | Nov | Dec |
| 0 | - | 0.10 | 0.09 | 0.09 | 0.10 | 0.09 | 0.15 | <0.07 | <0.08 | <0.09 | - | - |
| 10 | - | 0.09 | 0.13 | 0.10 | 0.12 | 0.11 | 0.14 | 0.10 | 0.08 | - | - | - |
| 20 | - | 0.13 | 0.18 | 0.15 | 0.09 | 0.12 | 0.13 | 0.08 | 0.08 | - | - | - |
| 30 | - | 0.16 | 0.17 | 0.19 | 0.11 | 0.15 | 0.07 | 0.08 | 0.11 | - | - | - |
| 40 | - | 0.15 | 0.17 | 0.12 | 0.12 | 0.18 | 0.08 | 0.09 | 0.11 | - | - | - |
| 60 | - | 0.19 | 0.17 | 0.16 | 0.10 | 0.15 | 0.11 | 0.10 | 0.11 | - | - | - |
- Total-P [micro l-1]
| 1986 | 1985 | |||||||||||
|---|---|---|---|---|---|---|---|---|---|---|---|---|
| Depth [m] | Jan | Feb | Mar | Apr | May | Jun | Jul | Aug | Sep | Oct | Nov | Dec |
| 0 | - | 5 | 3 | 3 | 5 | 5 | <3 | <3 | <3 | 3 | - | - |
| 10 | - | 5 | 4 | 5 | 4 | 5 | 3 | 5 | 5 | - | - | - |
| 20 | - | 5 | 4 | 4 | 3 | 5 | <3 | <3 | <3 | - | - | - |
| 30 | - | 6 | 4 | 5 | 4 | 5 | <3 | <3 | <0 | - | - | - |
| 40 | - | 7 | 4 | 5 | 4 | 5 | <3 | 3 | <3 | - | - | - |
| 60 | - | 7 | 5 | 6 | 4 | 4 | 3 | <3 | 3 | - | - | - |
The range and seasonality of total Kjeldahl nitrogen, silica and total dissolved phosphorus at station 0130082 in the south basin from 1981 to 1986 (2).
F. BIOLOGICAL FEATURES
F1 FLORA- Emerged macrophytes: Scirpus subterminalis (5).
- Floating macrophytes: None.
- Submerged macrophytes (5)
Potamogeton gramineus, Callitriche heterophylla, Ranunculus aquatilis, R. flammula. - Phytoplankton (5)
Cyanophyta (Aphanothece sp., Microcystis sp.); Bacillariophyta (Achnanthes sp., Cyclotella glomerata, Melosira sp., Rhizosolenia eriensis, Synedra acus, S. filiformis); Chrysophyta (Dinobryon sertularia); Cryptophyta (Cryptomonas sp., Chroomonas sp.).
- Zooplankton
- Benthos: Phyacodrillus montana, Psectrocladius, Thienemannimya.
- Fish
- Supplementary notes on the biota (Q)
The combination of only 11% littoral area (<6 m depth) and widely fluctuatingwater level has limited macrophyte vegetation severely.
Cladocerans (Daphnia spp., Holopedium gibberellum, Leptodora kindtii); Copepods (Cyclops sp., Diaptomus sp., Polyphemus pediculus, Sida sp.); Rotifers (Keratella cochlearis, Kellicottia longispina, Bosmina coregoni).
Salmo gairdneri, S. clarki clarki, Salvelinus malma, Cottus asper, Gasterosteus aculeatus.
- Phytoplankton standing crop in terms of chlorophyll a in this ultraoligotrophic lake was so low that it was virtually undetectable in all but 4 months of the year (July-October).
- From 1958 when the Strathcona Dam raised the water levels in the lake by 8.5 m to 1966 when a copper, lead and zinc mine began discharging to Buttle Lake's south basin, the creel census averaged 0.9 fish/rod hour. By 1978 it had fallen to 0.4 fish/rod hour and by 1980 it had dropped to 0 fish/rod hour (6). In 1984 a land tailings disposal system replaced the mine's tailings disposal. Studies are currently underway to determine how long lake rehabilitation will take following the diversion of acid mine tailings from the lake.
- Comparison of phytoplankton data collected in 1980 and 1981 with baseline data collected in 1966-1968 indicated that previously dominant diatoms such as Tabellaria flocculosa, T. fenestrata, Asterionella formosa and Melosira distans had become rare as had all Chlorophyta and Cyanophyta. More metal- tolerant species such as Navicula cryptocephala, Synedra acus, S. filiformis, Cyclotella bodanica and C. glomerata had substantially increased in abundance. As metal levels began to decrease S. acus and S. filiformis initially increased in numbers through 1983. However, from October 1983 through August 1985 Rhizosolenia eriensis became very abundant peaking at 18,000 cells ml-1 in south Buttle and 99.7% of the community, a virtual monoculture. In September 1985 the bloom "crashed" falling to less than 600 cells ml-1, a drop of 97%. Other species such as Dinobryon spp. have become seasonal co- dominants (spring) while sensitive species such as Tabellaria fenestrata, T. flocculosa, Fragilaria crotonensis and Asterionella formosa have begun to return.
In 1981 when metal levels were peaking, the zooplankton community indicated a trend toward decreasing numbers of cladocerans and calanoid copepods. Throughout 1984 zooplankton were present in such low numbers that they were found in only one of forty samples. Zooplankton began to reappear in 1985, gradually becoming more abundant and diverse through the spring and summer months. By late summer species such as Leptodora kindtii, Holopedium gibberellum, Polyphemus pediculus and Daphnia spp., which had been absent for a number of years, were reappearing along with Diaptomus sp., Keratella cochlearis, Kellicottia longispina, Bosmina longirostris, B. coregoni, Cyclops sp. and Polyarthra sp. In 1986, only two years after the mine waste diversion, species composition was similar to that sampled in 1966-1967.
Percent composition of phytoplankton community over time at site 0130082 (2).
Phytoplankton cell numbers [no. ml-1] over time at site 0130082 (2).
G. SOCIO-ECONOMIC CONDITIONS
G1 LAND USE IN THE CATCHMENT AREA (2a) (1978)| Area [km2] | [%] | |
|---|---|---|
| Natural landscape | ||
| - Woody vegetation | 1,264 | 90 |
| - Herbaceous vegetation | 140 | 10 |
| Total | 1,404 | 100 |
- Types of important forest vegetation
Pseudotsuga menziesii (Douglas fir), Tsuga heterophylla (western hemlock), Thuja plicata (red cedar). - Types of important herbaceous vegetation
Polystichium munitum (sword fern), Berberis nervosa (Oregon grape), Vaccinum parvifolium (red huckleberry), Achlys triphylla (vanilla leaf). - Supplementary notes
This lake lies within Strathcona Provincial Park, hence the lack of permanent population, agriculture and manufacturing industry.
| Gross product per year (US$1.00) | No. of persons engaged | No. of establishments | Main products pr mSecondary industry | |
|---|---|---|---|---|
| Primary industry Mining | - | - | 1 | Copper, lead, zinc, gold, silver |
H. LAKE UTILIZATION (Q)
H1 LAKE UTILIZATION- Source of water, sightseeing and tourism (no. of visitors in 1987: 52,100) and recreation (swimming, sport-fishing).
I. DETERIORATION OF LAKE ENVIRONMENTS AND HAZARDS
I1 ENHANCED SILTATION- Extent of damage: Not serious.
- Present status: Serious.
| Sampling station: 3 km N of Thelwood Creek | ||||
| Name of contaminant*1 | Range of concentration [ppb] in*2 | |||
|---|---|---|---|---|
| Water | Bottom mud | Fish*3 | ||
| 1986 | 1981 | Muscle 1983-1986 | Liver 1983-1986 | |
| Copper | 1-10 | 178+-48 | 0.61+-.68 | 510.4+-07.5 |
| Zinc | 20-50 | 209+-42 | 21.7+-9.5 | 110.9+-9.8 |
| Lead | 1-4 | 55+-47 | - | 3.14+-5.74 |
| Cadmium | <0.5 | <1 | - | 10.1+-4.3 |
*2 Volume basis [micro l-1] for water, and on a dry weight basis for fish tissue (mean +-S.D.).
*3 Species examined: Salmo gairdneri.
- Environmental quality standards for contaminants in lake water
Environment Canada guidelines [mg l-1]: Zn 0.03, Cu 0.002, Cd 0.0002, Pb 0.001.
- Past trends
Metal contents of fish muscle tissues in Buttle Lake and control lakes, with the number of samples and statistical comparisons. All metal contents are expressed on dry weight basis except mercury on wet weight basis.
Seasonal and inter-year changes of total zinc content in the lake water at Station 0130082 (south basin).
I3 EUTROPHICATION (Q)
- An unusual algal bloom dominated by Rhizosolenia eriensis occurred in 1984- 1985, continuing through winter. Lake concentration for total dissolved P ranged up to 0.008 mg l-1 and NO2/NO3-N up to 0.08 mg l-1 - the concentrations hardly indicate significant eutrophication. This bloom was likely associated with a number of factors such as declining metals concentration, reduced numbers of herbivorous zooplankton, a slight increase in nutrients and possibly a favorable N:P ratio.
- Extent of damage: None.
- Supplementary notes
Acid generation from a mine (mainly from waste rock) adds heavy metals but does not affect pH in the lake.
J. WASTEWATER TREATMENTS
J1 GENERATION OF POLLUTANTS IN THE CATCHMENT AREA- (f) A mine on one tributary (south arm) with previous tailings discharge to lake, some metal leachates from waste rock and existing discharge of mine/mill effluents.
- Industrial wastewater treatment systems
Improved collection and treatment systems at mine site are reducing metal loadings to the lake. Clarified effluent is pumped through tailings ponds.
L. DEVELOPMENT PLANS
- This lake is in Strathcona Provincial Park. Therefore there are no development plans.
M. LEGISLATIVE AND INSTITUTIONAL MEASURES FOR UPGRADING LAKE ENVIRONMENTS
M1 NATIONAL AND LOCAL LAWS CONCERNED- Name of the laws (the year of legislation)
- Waste Management Act
- Parks Act
- Fisheries Act
- Mines Regulations
- Responsible authorities
- British Columbia Ministry of Environment, Waste Management Branch
- British Columbia Ministry of Parks
- Canada Department of Fisheries and Oceans
- British Columbia Ministry of Mines (and Petroleum Resources)
- Main items of control
- Waste management permits
- British Columbia Waste Management Program, Ministry of Environment, Vancouver Island Region, Nanaimo, 1967-1988
- University of Victoria
- University of British Columbia
N. SOURCES OF DATA
- Questionnaire filled by Drs. M. J. R. Clark, Environmental Impact Unit, Environmental Services Section, Waste Management Branch, Victoria, British Columbia, P. Lucey, Department of Biology, University of Victoria, British Columbia, J. Deniseger and L. Erickson, Vancouver Island Region, Waste Management Branch, Ministry of Environment, Canada.
- British Columbia Ministry of Environment. Region 1, Waste Management Files.
- Deniseger, J., Erickson, L. J., Austin, A., Roch, M. & Clark, M. J. R. (In press) The effects of decreasing heavy metal concentrations on the biota of Buttle Lake, Vancouver Island, British Columbia. Water Research.
- National Topographic System, Department of Energy Mines and Resources, Surveys and Mapping Branch. Sheet 92F/12 (Scale 1:50,000), Edition 4, 1980 and Sheet 92F/13, Edition 3, 1976. (2a)
- Nordin, R. N., McKean, C. J. P., Boyd, I. T., Clark, M. J. R., Roch, M. R. & Deniseger, J. (1985) Effects of Dissolved Metals on the Aquatic Biota of the Lakes of the Campbell River Watershed. 234 pp. Water Management and Waste Management Branches, Ministry of the Environment, Victoria, B. C.
- Canadian Climate Normals, 1951-1980. Canadian Climate Program, Environment Canada, Atmospheric Environment Service, Downsview, Ontario.
- British Columbia Ministry of the Environment, Waste Management Branch (1987) (Computer file of) Aquatic Plants, Morphometry and Water and Sediment Chemistry for the Lakes in British Columbia-Site 480, Buttle Lake.
- Clark, M. J. R. & Morrison, T. 0. (1982) Impact of the Westmin Resources Ltd. Mining Operation on Buttle Lake and the Campbell River Watershed. Ministry of Environment, Waste Management Branch.
- Read, S. C. & Poulin, V. A. (1982) Economic evaluation of the Campbell River Fisheries. A Report Prepared for Waste Management Branch, B. C. Ministry of the Environment. 47 pp.
