
KAMLOOPS LAKE
A view from the lakeside hill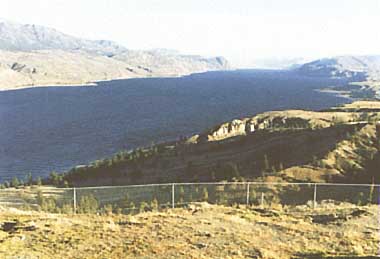
Photo: D.W.Holmes
A. LOCATION
- British Columbia, Canada.
- 50:26-50:42N, 120:03-120:32W; 336 m above sea level.
B. DESCRIPTION
-
Kamloops Lake is located in the dry interior of British Columbia adjacent to the City of Kamloops.
The lake is bounded on all sides by steep embankments with level areas only near creek deltas and at the inlet and outlet. The surrounding land is mostly uninhabited and within the dry belt interior grasslands composed of bunchgrass and sagebrush with pockets of Douglas fir, Ponderosa pine and spruce.
The lake appears to be a widening and deepening of the Thompson River which enters at the east end and exits at the west end. The limnology of the lake is controlled by the Thompson River which has large fluctuations in annual flow with over 60% occurring in the early summer during freshet (May-Jul.). Bulk residence times are very short, ranging from 20 days to 340 days with a mean of 60 days. The Weyerhaeuser Pulp Mill discharges daily an average of 182,000 m3 of biologically treated effluent to the Thompson River just upstream of the lake. The City of Kamloops periodically (Oct. & Nov.) discharges up to 35,000 m3 day-1 of tertiary treated domestic effluent. Major water quality problems which became evident in the Thompson River downstream of the lake in the early 1970's were attributed to the discharges. Improvements in water quality have occurred through improved treatment of the effluents.
C. PHYSICAL DIMENSIONS
| Surface area [km2] | 52 |
| Volume [km3] | 3.7 |
| Maximum depth [m] | 143 |
| Mean depth [m] | 71 |
| Water level | Unregulated |
| Normal range of annual water level fluctuation [m] | 5 |
| Length of shoreline [km] | 60.5 |
| Residence time [yr] | ca. 0.2* |
| Catchment area [km2] | 39,050 |
D. PHYSIOGRAPHIC FEATURES
D1 GEOGRAPHICAL- Sketch map: Fig. NAM-54-01.
- Bathymetric map: Fig. NAM-54-02.
- Names of main islands: None.
- Number of outflowing rivers and channels (name): 1 (Thompson R.).
- Climatic data at Kamloops Airport, 195l-1988
| Jan | Feb | Mar | Apr | May | Jun | Jul | Aug | Sep | Oct | Nov | Dec | Ann. | |
|---|---|---|---|---|---|---|---|---|---|---|---|---|---|
| Mean temp. [deg C] | -6.1 | -1.3 | 3.5 | 9.1 | 14.1 | 18.0 | 20.8 | 19.8 | 14.9 | 8.4 | 1.6 | -2.8 | 8.3 |
| Precipitation [mm] | 32 | 16 | 10 | 10 | 18 | 30 | 23 | 28 | 21 | 15 | 22 | 32 | 257 |
- Number of hours of bright sunshine: 2,000 hr yr-1.
- Solar radiation: 12.5 MJ m-2 day-1.
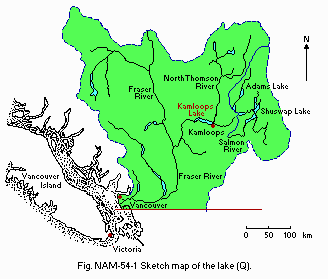
Sketch map of the lake (Q).
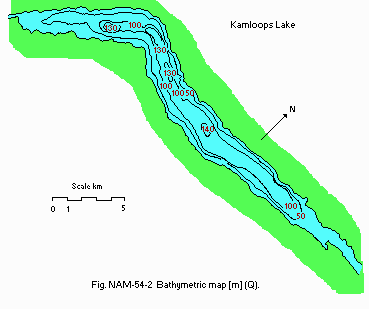
Bathymetric map [m](Q).
- Water temperature: Fig. NAM-54-03.
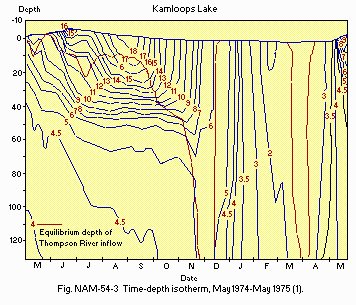
Time-depth isotherm, May 1974-May 1975 [deg C](1).
- Freezing period
Seldom freezes over with occasional freezing in small areas in December- January. - Mixing type: Dimictic.
- Supplementary notes on water mixing and thermocline formation
Water mixing and thermocline formation are dominated by the Thompson River which has a mean annual inflow of 720 m3 sec-1. Over 60% of the discharge comes in the early spring freshet with peak flows near 3,400 m3 sec-1 in Tune and minimum flows of 120 m3 sec-1 in February. As a result of the large and variable discharge, bulk residence times are very short (20-340 days). Throughout summer (June-October), the inflowing, highly turbid Thompson River water remains cooler than the lake surface water, thus interflowing through the epilimnion at depths of 10-30 m. Turbulence induced by this interflow effectively mix the intermediate region of the epilimnion. Only in late summer, with declining river flows and deep convective mixing of the surface waters, does the lake establish a classical two-layer thermal structure. Throughout summer, the outflow river remains warmer and less turbid than the inflow. Direct stratification slowly breaks down through November and December until complete convective overturn results. During this period, inflowing river water either sinks to the bottom, or is confined to the eastern end of the lake. Hence the outflow is derived entirely from surface lake water remaining from the summer. The lake during winter (January-March) is characterized by weak, reverse temperature stratification and low turbidity; the inflowing river waters are less dense than the ambient lake water and, therefore, tend to remain at the surface. In spring (April-May), convective overturn again occurs, followed by direct thermal stratification. As with the autumn overturn, the spring mixing processes act to retain all the new inflow water within the lake. Thus, the outflow waters consist of surface lake water reflecting winter conditions.
E. LAKE WATER QUALITY
E2 pH (1)| Station G2, March 1974-February 1975 | ||||||||||||
| Depth [m]* | Jan | Feb | Mar | Apr | May | Jun | Jul | Aug | Sep | Oct | Nov | Dec |
|---|---|---|---|---|---|---|---|---|---|---|---|---|
| 7.6 | 7.6 | 7.5 | 7.6 | 7.8 | 7.6 | 7.7 | 7.7 | 7.7 | 7.5 | 7.8 | 7.6 | |
| 7.6 | 7.6 | 7.5 | 7.7 | 7.7 | 7.6 | 7.7 | 7.7 | 7.6 | 7.5 | 7.8 | 7.6 | |
| 7.6 | 7.6 | 7.6 | 7.5 | 7.7 | 7.5 | 7.7 | 7.6 | 7.4 | 7.5 | 7.8 | 7.6 | |
| 7.6 | 7.6 | 7.5 | 7.4 | 7.7 | 7.5 | - | 7.6 | 7.6 | 7.4 | 7.8 | 7.5 | |
| 7.5 | 7.5 | 7.5 | 7.4 | 7.7 | - | - | - | 7.4 | 7.3 | 7.9 | 7.6 | |
- Depths [m] at which observations were made in each month for the above and the following tables
| Jan | Feb | Mar | Apr | May | Jun | Jul | Aug | Sep | Oct | Nov | Dec |
|---|---|---|---|---|---|---|---|---|---|---|---|
| 1 | 1 | 1 | 1 | 1 | 1 | 1 | 1 | 1 | 1 | 1 | 1 |
| 20 | 15 | 28 | 23 | 10 | 20 | 10 | 14 | 24 | 30 | 25 | 30 |
| 50 | 40 | 35 | 45 | 20 | 40 | 20 | 40 | 40 | 40 | 50 | 70 |
| 90 | 90 | 60 | 60 | 25 | 70 | 70 | 70 | 70 | 70 | 80 | 100 |
| 117 | 115 | 144 | 130 | 128 | 135 | 121 | 125 | 120 | 118 | 120 | 120 |
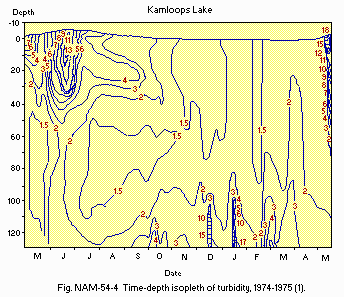
Time-depth isopleth of turbidity, 1974-1975 (1).
E4 DO [mg l-1](1)
| Station G2, March 1974-February 1975 | ||||||||||||
| Depth [m] | Jan | Feb | Mar | Apr | May | Jun | Jul | Aug | Sep | Oct | Nov | Dec |
|---|---|---|---|---|---|---|---|---|---|---|---|---|
| * | 11.0 | - | 12.2 | 11.6 | 10.5 | 10.7 | 9.9 | 9.6 | 9.5 | 9.7 | 10.2 | 12.1 |
| 11.4 | - | 12.1 | - | 10.5 | 10.4 | 9.8 | 8.9 | 9.2 | 9.6 | 10.3 | 12.1 | |
| 11.4 | - | 12.2 | 11.7 | 10.6 | - | 10.0 | 9.6 | 9.8 | 9.8 | 10.2 | 12.3 | |
| 11.3 | - | 12.1 | 12.2 | 10.5 | 11.4 | 10.8 | 11.2 | 10.7 | 10.3 | 10.0 | 12.2 | |
| 11.2 | - | 12.0 | 11.4 | 10.6 | - | - | - | 9.1 | 9.1 | 9.8 | 12.3 | |
- Chlorophyll a [micro l-1]
Mean: 2.9.
Maximum (September): 5.4.
- Total-N [micro l-1]
| Station G2, March 1974-February 1975 | ||||||||||||
| Depth [m] | Jan | Feb | Mar | Apr | May | Jun | Jul | Aug | Sep | Oct | Nov | Dec |
|---|---|---|---|---|---|---|---|---|---|---|---|---|
| * | 230 | 206 | 201 | 175 | 215 | 246 | 193 | 158 | 143 | 153 | 156 | 200 |
| 217 | 210 | 150 | 181 | 219 | 223 | 149 | 152 | 125 | 187 | 129 | 175 | |
| 191 | 221 | 156 | 163 | 216 | 262 | 178 | 187 | 122 | 208 | 147 | 179 | |
| 193 | 236 | 147 | 169 | 267 | 257 | - | 222 | 114 | 244 | 201 | 186 | |
| 114 | 217 | 158 | 188 | 230 | - | - | - | 144 | 320 | 232 | 207 | |
- Supplementary notes
NO2-N + NO3-N varied from 120 micro l-1 (spring) to 20 micro l-1 (late summer minimum). Ammonia was usually below 10 micro l-1 (Q).
- Total-P [micro l-1]
| Station G2, March 1974-February 1975 | ||||||||||||
| Depth [m] | Jan | Feb | Mar | Apr | May | Jun | Jul | Aug | Sep | Oct | Nov | Dec |
|---|---|---|---|---|---|---|---|---|---|---|---|---|
| * | 7 | 14 | 7 | 10 | 12 | 20 | 13 | 9 | 9 | 6 | 4 | 9 |
| 8 | 10 | 8 | 9 | 16 | 25 | 16 | 23 | 20 | 6 | 4 | 6 | |
| 10 | 10 | 9 | 9 | 11 | 22 | 12 | 7 | 7 | 6 | 5 | 10 | |
| 2 | 10 | 6 | 8 | 9 | 9 | 14 | 4 | 7 | 5 | 4 | 4 | |
| 8 | 13 | 22 | 13 | 43 | - | - | - | 6 | 5 | 4 | 5 | |
- Supplementary notes
Dissolved-P ranged from 6 micro l-1 in spring to a maximum of 10 micro l-1 associated with the river plume in June, and declined to 4 micro l-1 in late summer.
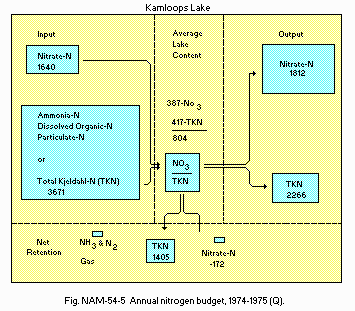
Annual nitrogen budget, 1974-1975 (Q).
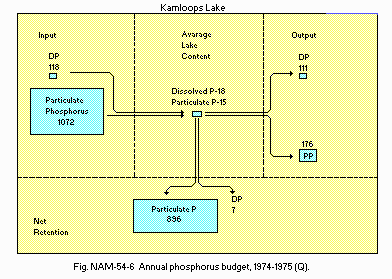
Annual phosphorus budget, 1974-1975 (Q).
F. BIOLOGICAL FEATURES
F1 FLORA- Emerged macrophytes: Equisetum sp. (4).
- Submerged macrophytes (4)
- Phytoplankton (5)
Potamogeton pectinatus, P. pusillus, P. perfoliatus, P. perfoliatus, P. gramineus, Najas flexilis, Ranunculus aquatilis, Chara sp., Callitriche sp., Elodea canadensis, Marsilea vesta (list not complete).
Bacillariophyceae (Tabellaria, Stephanodiscus, Fragilaria, Nitzschia, Asterionella, Stauroneis, Cymbella, Disploneis, Melosira, Mastogloia, Achnanthes, Amphipleura, Navicula, Cocconeis, Synedra, Surirella, Cyclotella, Diatoma, Gomphonema, Neidium, Hannaea, Pinnularia); Chrysophyceae (Dinobryon, Ceratium); Chlorophyceae (Crucigenia, Onychonema); Cyanophyceae (Borzia); Dinophyceae.
- Zooplankton (5)
- Fish (6)
Copepoda (Diaptomus ashlandi, Cyclops bicuspidatus thomasi, Epishura nevadensis); Cladocera (Daphnia longispina, Bosmina longirostris, Leptodora kindtii, Holopedium gibberum); Rotifera (Kellicottia longispina, Keratella sp., Notholca sp., Asplancha sp.).
Salmo gairdneri, Salvelinus malmo, Lota lota, Cottus asper, Prosopium williamsonii, Ptychocheilus oregonenois, Mylocheilus caurinum, Catostomus macrochelilus, C. catostomus, Richardsonius balteatus, Acipenser transmontanus, Oncorhynchus tshawytscha, O. nerka (kokanee and sockeye), O. kisutch.
- Station G2: 88.
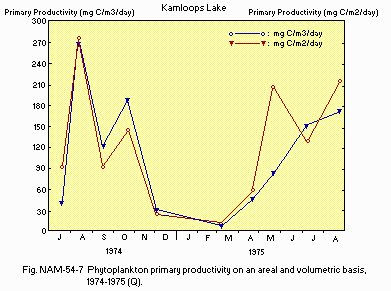
Phytoplankton primary productivity on an areal and volumetric basis, 1974-1975 (Q).
F4 BIOMASS (5)
- Zooplankton [no. m-3]
4,500-21,000
G. SOCIO-ECONOMIC CONDITIONS
G1 LAND USE IN THE CATCHMENT AREA (7) (1988)| Area [km2] | [%] | |
|---|---|---|
| Natural landscape | ||
| - Woody vegetation | ca. 35,930 | 92.0 |
| - Herbaceous vegetation | ca. 1,170 | 3.0 |
| - Swamp | +- | |
| - Others | ca. 195 | 0.5 |
| Agricultural land | ||
| - Crop field | ca. 390 | 1.0 |
| - Pasture land | ca. 780 | 2.0 |
| Residential area | ca. 390 | 1.0 |
| Others | ca. 195 | 0.5 |
| Total | 39,050 | 100.0 |
- Types of important forest vegetation
- Types of important herbaceous vegetation
- Main kinds of crops and/or cropping systems
- Levels of fertilizer application on crop fields: Moderate.
- Trends of change in land use in recent years
Ponderosa pine, interior Douglas fir, trembling aspen, white birch, cottonwood, alder, lodgepole pine, Engelmann spruce, subalpine fir, interior western hemlock, red cedar.
Bunchgrass/bluegrass/fescues, pinegrass, alpine tundra vegetation.
Alfalfa, hay grasses, corn (silage & truck garden), local commercial vegetables and tree fruits.
Land clearing for pasture and hay crops; highway and railway construction and upgrading; extensive forestry cropping; and residential urban development in Kamloops.
| Gross product per year (US$1.00) | No.of persons engaged | No. of establishments | Main products or major industries | |
|---|---|---|---|---|
| Primary industry | ||||
| - Crop production 18,100,000 | N.A. | N.A. | ||
| - Ranching | N.A. | N.A. | 370 | Cattle |
| - Forestry | N.A. | 337 | N.A. | Lumber/pulp |
| - Mining | N.A. | N.A. | N.A. | Copper |
- Numbers of domestic animals in the catchment area
Cattle 42,100, sheep 1,200, swine N.A., poultry N.A.
| Population | Population density [km-2] | Major cities (population) | |
|---|---|---|---|
| Urban | 61,773 | 200 | Kamloops (65,000) |
| Rural | 17,727 | ||
| Total | 79,500 | 2.04 |
H. LAKE UTILIZATION
H1 LAKE UTILIZATION- Source of water, recreation (swimming, sport-fishing) and fisheries.
| Use rate [IGD] | |
|---|---|
| Domestic | 403,000 |
| Irrigation | 1,710 ac. ft. |
| Industrial | 3,989,500 |
I. DETERIORATION OF LAKE ENVIRONMENTS AND HAZARDS
I1 ENHANCED SILTATION- Extent of damage: Not serious.
- Supplementary notes
Increases in cultural activities (logging, land clearing, etc.) in the last decade have increased silt loading to the watershed especially during spring run-off.
- Present status: Detected but not serious.
- Supplementary notes
Low levels of dioxins and furans have been detected in drinking water and popular sport fish (dolly varden, trout and salmon) in the lower Thompson River. Elevated levels were found in coarse fish such as suckers, squawfish and whitefish. Residents were cautioned to restrict their intake of the coarse species.
- Nuisance caused by eutrophication (10)
Taste and odour detected in fish (problems associated with pulp mills). - Nitrogen and phosphorus loadings to the lake
| May 1974 - April 1975 | ||
| Sources [Mg yr-1] | Total [g m-2 yr-1] | |
|---|---|---|
| T-P | 900+-50 | 17+-4 |
| T-N | 5,300+-1,300 | 100+-5 |
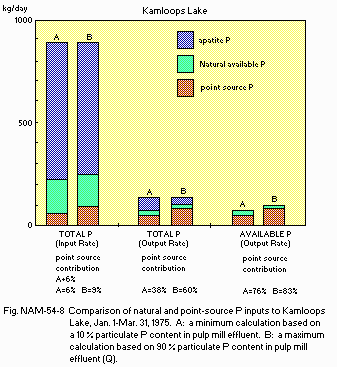
Comparison of natural and point-source P inputs to Kamloops Lake, Jan. l - Mar. 31, 1975.
- Supplementary notes
- The high turbidity and deep mixing in a relatively thick epilimnion suppresses net photosynthesis.
- The actual bio-availability of Total-P loading is very low because it is mostly in the inert mineral apatite (12).
- Most of the algal biomass produced is exported down the outlet river, so little accumulation of these products occurs in the hypolimnion where they could affect nutrient regeneration and oxygen consumption rates.
Increases in benthic algae downstream of the lake were observed in the late fall and winter in the 1970's, but it is not known whether this was due to increased biologically available P loadings to the upstream lake or to changes in grazing invertebrate populations which may have been affected by other factors such as mortality or migration due to toxic effluents introduced upstream. Although the nutrient loading to Kamloops Lake is immense, the biological response to these loadings does not produce the expected eutrophic condition. The reason for this is threefold.
- Extent of damage: None (8).
J. WASTEWATER TREATMENTS (11)
J1 GENERATION OF POLLUTANTS IN THE CATCHMENT AREA- (d) Measurable pollution with limited wastewater treatment.
| [%] | ||
|---|---|---|
| Non-point sources | 60 | agricultural, natural and dispersed settlements |
| Point sources | ||
| - Municipal | 20 | municipal sewage treatment plant |
| - Industrial | 20 | pulp mill |
| Total | 100 | |
- Percentage of municipal population in the catchment area provided with
adequate sanitary facilities (on-site treatment systems) or public sewerage: 90-100%. - Percentage of rural population with adequate sanitary facilities (on-site
treatment systems): 50-75%. - Municipal wastewater treatment systems
No. of tertiary treatment systems: 2 (one alum addition extended lagoon, one modified Bardenpho mechanical plant). No. of secondary treatment systems: 6 (small activated sludge package plants with ground disposal). No. of other types: Numerous individual and communal septic systems. - Industrial wastewater treatment systems
No. of industrial wastewater treatment systems: 4 (one extended aeration biobasin type for pulp mill, three lagoon treatments types for cooling water).
M. LEGISLATIVE AND INSTITUTIONAL MEASURES FOR UPGRADING LAKE ENVIRONMENTS (Q)
M1 NATIONAL AND LOCAL LAWS CONCERNED- Names of the laws (the year of legislation)
- British Columbia Waste Management Act (1982)
- British Columbia Environmental Management Act (1981)
- Canadian Environmental Contaminants Act (1975)
- Canadian Fisheries Act
- British Columbia Pesticide Control Act (1977)
- Responsible authorities
- British Columbia Waste Management Branch
- British Columbia Ministry of Environment
- Canadian Environmental Protection Service
- Canadian Department of Fisheries
- British Columbia Pesticide Control Branch
- Main items of control
- Permitted waste discharges to environment
- General waste discharges, accidental spills, etc.
- General discharges to environment and permitted discharges
- Discharges deleterious to fish
- Discharge of pesticides under permit
- British Columbia Ministry of Environment
- Waste Management Branch, Kamloops, B. C. (controls discharges, monitors impact)
- Water Management Branch, Kamloops, B. C. (water quality and quantity studies)
- Freshwater Fisheries Branch, Kamloops, B. C. (fish studies)
- Canadian Government
- Environmental Protection Service, Vancouver, B. C. (assess waste impacts)
- Federal Fisheries Branch, Vancouver, B. C. (fish populations, impact studies)
- National Water Hydrology Research Institute, Saskatoon, Sask. (water qualit research)
N. SOURCES OF DATA
- Questionnaire filled by Dr. D. W. Holmes, Head, Environmental Section, Waste Management Branch, Ministry of Environment, British Columbia, Canada.
- St. John, B. E., Cormack, E. C., Deley, R. J., Gray, C. B. J. & Pharo, C. H. (1976) The limnology of Kamloops Lake, British Columbia. "Sources and Effects of Algal Growth, Colour, Foaming and Fish Tainting in the Thompson River System". Federal-Provincial Thompson River Task Force, Dept. Environment, Vancouver.
- Inland Waters Directorate (1987) Surface Water Data, British Columbia. Cat. No. En 36-407/1987. Environment Canada.
- Atmospheric Environment Service (1988) Climatic Records for Kamloops Airport - 30 Year Normals. Environment Canada.
- Warrington, P. D. (1980) Studies on aquatic macrophytes. "Aquatic Plants of British Columbia", Part 33. Aquatic Studies Branch, B. C. Ministry of Environment.
- Kelso, B. W. &qmp; G. Derkson, G. (1976) The standing crop of plankton in Kamloops Lake, B. C. from March, 1974 to April, 1975. "Sources and Effects of Algal Growth, Colour, Foaming and Fish Tainting in the Thompson River System". Federal-Provincial Thompson River Task Force, Vancouver.
- Fisheries Branch, B. C. Ministry of Environment, Kamloops, B. C. Personal communication.
- Habitat Branch, B. C. Ministry of Environment, Kamloops, B. C. Personal communication.
- Thompson-Nicola Regional District, Kamloops, B. C.; Columbia-Shuswap Regional District, Salmon Arm, B. C. Personal communication.
- Water Management Branch, B. C. Ministry of Environment, Kamloops, B. C. Personal communication.
- Kovacs, T. G. &qmp; Voss, R. H. (1985) The Effect of Bleached Kraft Effluent on the Aquatic Environment: Fish Flavour Evaluation. Paprican Project No. 6312 and 7170.
- Waste Management Branch, B. C. Ministry of Environment, Kamloops, B. C. Personal communication.
- Reid, R. P., Pharo, C. H. & Barnes, W. C. (1980) Direct determination of apatite in lake sediments. Can. J. Fish. Aquat. Sci., 37(4), 640-646.
- Bothwell, M. L., Jasper, S. & Daley, R. J. (1989) Phosphorus Control of Algal Production and Biomass in the Thompson River, B. C. IWD Scientific Series No. 165.
- Bothwell, M. L., National Hydrology Research Centre, Saskatoon, Saskatchewan. Personal communication.
