
OKANAGAN LAKE
A view from the lakeside hill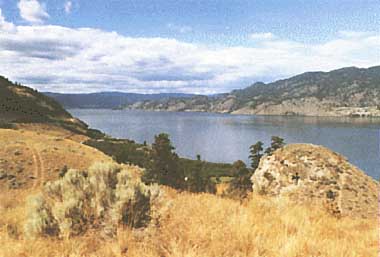
Photo: J.E.Bryan and E.V.Jensen
A. LOCATION
- British Columbia, Canada.
- 49:30-50:22N, 119:20-119:45W; 342 m above sea level.
B. DESCRIPTION
-
Okanagan Lake is situated in south central British Columbia. It has acatchment area of over 6,000 km2 and is the largest of the five main and interconnected lakes in the Okanagan valley. The Okanagan valley is U-shaped with mountains rising on both sides to 1,000-2,500 m.
Okanagan Lake in general is a deep, oligotrophic water body with two shallower reaches with poorer water circulation, higher nutrient levels, and greater plankton abundance. The lake in profile is composed of three basins, a large north basin, a mid basin and a southern basin. It is jointed to Kalamalka Lake in the north by Vernon Creek and at the south end to Skaha Lake by the Okanagan River. This river flows south through Skaha Lake, Vaseaux Lake and Osoyoos Lake; it joins the Columbia River near Brewster, Washington.
Several hundred meters of unconsolidated materials deposited during the Pleistocene epoch line the valley bottom. These materials probably resulted from glacial outwash, direct glaciation, and lacustrine fluvial sedimentation. Notable characteristics of the valley, particularly at the south end, are the terraces which were formed as the lowering of postglacial lake levels were repeatedly arrested. These fertile benches have been used extensively for horticulture, principally fruit trees and grape growing.
Three major population centres are located along lake Okanagan shores: Vernon at the north end, Kelowna at the mid point and Penticton at the south end (Penticton's sewage effluent is discharged to the outflow of Okanagan Lake). The major industrial development in the valley is associated with agriculture and forestry. As well, a large copper deposit has been developed in the drainage basin. Tourism is also a major economic factor in the local economy. These facts coupled with the arid nature of the region have resulted in a very high economic value being given to water quality and quantity. This is reflected by the number of studies conducted on the Okanagan lakes in recent history. Federal-provincial studies in 1969-1974 and 1977-1982 provided the first basic technical information on all the valley lakes and tracked water quality following sewage treatment improvements at Vernon and Penticton. Water quality improvement in the central basin of the lake is expected now, so that the city of Kelowna has instituted tertiary treatment (1).
C. PHYSICAL DIMENSIONS (2, 3)
| Surface area [km2] | 351 |
| Volume [km3] | 24,644 |
| Maximum depth [m] | 230 |
| Mean depth [m] | 76 |
| Water level | Regulated |
| Length of shoreline [km] | 270 |
| Residence time [yr] | 52.8 |
| Catchment area [km2] | 6,188 |
D. PHYSIOGRAPHIC FEATURES
D1 GEOGRAPHICAL- Sketch map: Fig. NAM-51-0l.
- Bathymetric map: Fig. NAM-51-02.
- Names of main islands: Grant (<0.01 km2) and Rattlesnake (<0.01 km2).
- Number of outflowing rivers and channels: 1 (Okanagan R.).
- Climatic data at Pentiction Airport, 1950-1980
| Jun | Feb | Mar | Apr | May | Jun | Jul | Aug | Sep | Oct | Nov | Dec | Ann. | |
|---|---|---|---|---|---|---|---|---|---|---|---|---|---|
| Mean temp. [deg C] | -2.7 | 0.6 | 3.9 | 8.6 | 13.4 | 17.2 | 20.3 | 19.5 | 14.7 | 8.7 | 3.0 | 0.4 | 8.9 |
| Precipitation [mm] | 32 | 20 | 17 | 21 | 29 | 28 | 21 | 27 | 18 | 15 | 24 | 31 | 236 |
Sketch map (Q).
Bathymetric map [50 ft=15.24 m](4).
- Number of hours of bright sunshine (North of Okanagan and Pinticton
Airport): 2,032 hr yr-1.
- Solar radiation (Summerland)[MJ m-2 day-1](5)
| Jun | Feb | Mar | Apr | May | Jun | Jul | Aug | Sep | Oct | Nov | Dec | Ann. |
|---|---|---|---|---|---|---|---|---|---|---|---|---|
| 3.4 | 6.5 | 11.5 | 16.7 | 20.8 | 22.6 | 23.7 | 19.6 | 14.5 | 8.5 | 3.8 | 2.5 | 12.8 |
- Water temperature [deg C](6, 7, 8)
| North Okanagan Centre, 1977-1988 | ||||||||
| Depth [m] | Mar | Apr | May | Jun | Jul | Aug | Sep | Oct |
|---|---|---|---|---|---|---|---|---|
| 0 | 3.75 | 6.0 | 11.0 | 14.0 | 20.0 | 22.0 | 18.8 | 15.0 |
| 5 | 3.75 | 6.0 | - | - | 20.0 | - | 18.5 | 15.5 |
| 10 | 3.75 | 6.0 | - | - | 15.0 | - | 18.5 | 15.0 |
| 15 | 3.75 | 5.5 | - | - | 14.0 | - | 13.3 | 14.0 |
| 20 | 3.75 | 5.5 | - | - | 9.0 | - | 9.8 | 14.0 |
| 25 | 3.75 | 5.0 | - | - | 7.5 | - | 8.3 | 10.5 |
| 35 | 3.75 | 5.0 | - | - | 6.0 | - | 6.2 | 6.0 |
| 45 | 3.75 | 5.0 | - | - | 5.5 | - | 5.8 | 5.0 |
| Vernon Arm, 1979-1988 | ||||||||||||
| Depth [m] | Jan | Feb | Mar | Apr | May | Jun | Jul | Aug | Sep | Oct | Nov | Dec |
|---|---|---|---|---|---|---|---|---|---|---|---|---|
| 0 | 1.5 | - | 3.8 | 5.0 | 12.0 | 17.5 | 20.0 | 23.0 | 19.1 | 16.0 | 8.0 | 3.0 |
| 2 | - | - | 3.8 | - | - | - | - | - | 18.8 | - | - | - |
| 4 | - | - | 3.8 | - | - | - | - | - | 18.5 | - | - | - |
| 6 | - | - | 3.8 | - | - | - | - | - | 18.3 | - | - | - |
| 8 | - | - | 3.8 | - | - | - | - | - | 18.0 | - | - | - |
| 10 | - | - | 3.8 | - | - | - | - | - | 17.6 | - | - | - |
| 14 | - | - | 3.8 | - | - | - | - | - | 16.4 | - | - | - |
| 18 | - | - | 3.8 | - | - | - | - | - | 12.9 | - | - | - |
- Freezing period (Vernon Arm): January-February.
- Mixing type: Monomictic. Partially dimictic (North Okanagan Centre).
- Notes on water mixing and thermocline formation
North Okanagan Centre and the entire lake have only had complete ice cover 3 to 4 years in the past 100 years. As a result the lake stratifies in spring and mixes throughout the winter. Partial freezing of sheltered areas such as Vernon Arm can occur, i.e. Vernon Arm is dimictic during cold winters but monomictic during warm winters.
E. LAKE WATER QUALITY
E1 TRANSPARENCY [m](7, 8)| North Okanagan Centre, 1983-1984 | |||||||||||
| Jan | Feb | Mar | Apr | May | Jun | Jul | Aug | Sep | Oct | Nov | Dec |
|---|---|---|---|---|---|---|---|---|---|---|---|
| 16.5 | - | 11.9 | 6.4 | 5.8 | 5.8 | 8.4 | 8.1 | 9.0 | 9.7 | 10.7 | 14.2 |
| Vernon Arm, 1979-1984 | |||||||||||
| Jan | Feb | Mar | Apr | May | Jun | Jul | Aug | Sep | Oct | Nov | Dec |
|---|---|---|---|---|---|---|---|---|---|---|---|
| 10.0 | - | 6.5 | 3.0 | 2.4 | 2.0 | 3.6 | 4.25 | 8.0 | 8.9 | 7.5 | 9.0 |
| North Okanagan Centre, 1983-1984 | ||||||||||||
| Depth [m] | Jan | Feb | Mar | Apr | May | Jun | Jul | Aug | Sep | Oct | Nov | Dec |
|---|---|---|---|---|---|---|---|---|---|---|---|---|
| 1.5 | 8.0 | 8.1 | 8.3 | 8.3 | 8.4 | 8.3 | 8.5 | 8.5 | 8.5 | 8.4 | 8.2 | 8.0 |
| Vernon Arm, 1984 | ||||||||||||
| Depth [m] | Jan | Feb | Mar | Apr | May | Jun | Jul | Aug | Sep | Oct | Nov | Dec |
|---|---|---|---|---|---|---|---|---|---|---|---|---|
| 1.5 | 8.2 | - | 8.4 | 8.4 | 8.3 | 8.6 | 8.7 | 8.5 | 8.5 | 8.3 | 8.2 | 8.0 |
- South Okanagan Centre, 29 July 1975: 1.
| Depth [m] | Mar | Apr | May | Jun | Jul | Aug | Sep | Oct | Nov |
|---|---|---|---|---|---|---|---|---|---|
| 0 | 11.6 | 12.5 | 12.9 | 10.2 | 9.3 | 9.5 | 9.8 | 9.3 | 9.2 |
| 5 | 11.6 | 12.5 | - | - | 10.0 | - | 10.0 | 9.3 | - |
| 10 | 11.6 | 13.0 | - | - | 10.0 | 9.5 | 10.2 | 9.3 | - |
| 15 | 11.6 | - | - | - | 10.5 | - | 11.3 | 9.3 | - |
| 20 | 11.6 | - | - | - | 10.5 | - | 11.9 | 9.3 | - |
| 25 | 11.6 | 12.0 | - | - | 11.0 | 11.5 | 11.9 | 9.8 | - |
| 35 | 11.6 | 12.0 | - | - | 11.0 | 11.8 | 11.9 | 10.0 | - |
| 45 | 11.6 | 12.0 | - | - | 11.0 | 11.8 | 12.0 | 10.0 | - |
| 150 | - | 11.6 | 11.8 | - | - | - | - | - | - |
| Vernon Arm, March and September 1988 | ||
| Depth [m] | Mar | Sep |
|---|---|---|
| 0 | 13.6 | 10.3 |
| 2 | 13.6 | 10.3 |
| 4 | 13.6 | 10.4 |
| 6 | 13.6 | 10.4 |
| 8 | 13.6 | 10.4 |
| 10 | 13.6 | 10.6 |
| 14 | 13.6 | 10.8 |
| 18 | 13.6 | 11.2 |
Profiles of temperature, dissolved oxygen and turbidity for Okanagan Lake North, 1977 and 1978 (7).
E6 CHLOROPHYLL CONCENTRATION [micro l-1]
| North Okanagan Centre, 1984-1987 | ||||||||||||
| Depth [m] | Jan | Feb | Mar | Apr | May | Jun | Jul | Aug | Sep | Oct | Nov | Dec |
|---|---|---|---|---|---|---|---|---|---|---|---|---|
| 0-10 | 0.8 | 0.9 | 0.8 | 2.0 | 2.0 | 1.2 | 1.0 | 1.0 | 0.7 | 1.0 | 1.2 | 1.0 |
| Vernon Arm, 1979-1987 | ||||||||||||
| Depth [m] | Jan | Feb | Mar | Apr | May | Jun | Jul | Aug | Sep | Oct | Nov | Dec |
|---|---|---|---|---|---|---|---|---|---|---|---|---|
| 0-10 | 1.2 | 2.7 | 2.4 | 2.5 | 2.2 | 2.7 | 2.2 | 2.8 | 2.0 | <1.0 | 2.3 | 1.8 |
- Total-N [mg l-1]
| North Okanagan Centre, 1979-1987 | ||||||||||||
| Depth [m] | Jan | Feb | Mar | Apr | May | Jun | Jul | Aug | Sep | Oct | Nov | Dec |
|---|---|---|---|---|---|---|---|---|---|---|---|---|
| 0-10 | 0.27 | 0.23 | 0.2 | 0.15 | 0.17 | 0.11 | 0.24 | 0.11 | 0.20 | 0.14 | 0.23 | 0.18 |
| 20-45 | - | - | 0.2 | 0.13 | 0 | 0.17 | - | - | - | 0.35 | - | - |
| Vernon Arm, 1979 | ||||||||||||
| Depth [m] | Jan | Feb | Mar | Apr | May | Jun | Jul | Aug | Sep | Oct | Nov | Dec |
|---|---|---|---|---|---|---|---|---|---|---|---|---|
| 0-10 | 0.25 | 0.21 | 0.19 | 0.20 | 0.20 | 0.21 | 0.22 | 0.22 | 0.20 | 0.19 | 0.15 | 0.18 |
- Total-P [mg l-1]
| North Okanagan Centre, 1971-1987 (9) | |||||||||||
| Depth [m] | Jan | Feb | Mar | Apr | May | Jun | Jul-Aug | Sep | Oct | Nov | Dec |
|---|---|---|---|---|---|---|---|---|---|---|---|
| 0-10 | .009 | - | .008 | .009 | .001 | .009 | .008 | .008 | 0.01 | .009 | .009 |
| 20-45 | - | - | .006 | .010 | - | - | .007 | .010 | 0.01 | - | - |
| Vernon Arm, 1979-1986 (7, 9) | ||||||||||||
| Depth [m] | Jan | Feb | Mar | Apr | May | Jun | Jul | Aug | Sep | Oct | Nov | Dec |
|---|---|---|---|---|---|---|---|---|---|---|---|---|
| 0-10 | 0.13 | 0.16 | 0.09 | 0.12 | 0.12 | 0.15 | 0.18 | 0.14 | 0.11 | 0.10 | .008 | .009 |
- Okanagan Centre, 1983-1988: 1.66 (mean; N =7).
Spring Total-N at 4 sites in North Basin. Vernon discharge stopped by 1978 (8).
Spring Total-P at 4 sites in North Basin. Vernon discharge stopped by 1978 (8).
Fall phytoplankton at 4 sites in North Basin (8).
Total-P, phytoplankton chlorophyll a and periphyton chlorophyll a and nitrogen at Vernon Arm (OK-S2), 1976-1979 (7).
F. BIOLOGICAL FEATURES (1977)
F1 FLORA- Emerged macrophytes: Scirpus lacustris, Typha latifolia (10).
- Floating macrophytes (10)
- Submerged macrophytes (10)
- Phytoplankton (8)
Potamogeton gramineus, P. natans, Nuphar polysepalum.
Myriophyllum spicatum, Potamogeton perfoliatus, P. pectinatus, P. crispus, Elodea canadensis.
Dominants (Lyngbya limnetica, Fragilaria crotonensis, Melosira italica); Sub- dominants (Merismopedia, Oscillatoria, Botryococcus, Ankistrodesmus, Teraspora, Asterionella, Cyclotella, Rhizosolenia, Stephanodiscus).
- Zooplankton (8)
- Benthos (11, 12)
- Fish (13)
Dominants (Diaptomus ashlandi, Cyclops bicuspidatus); Sub-dominants (Bosmina, Notholca, Kellicottia).
Oligochaeta (Tubifex tubifex, Ilyodrilus templetoni, Limnodrilus hoffmeisteri, L. udekemianus, L. claparedeanus, Nais variabilis, N. pardalis); Hirundinea (Helobdella stagnalis, Placobdella monifera); Amphipoda (Gammarus limnaeus, Hyalella azteca); Ephemeroptera (Caenis sp., Choroterpes sp.); Odonata (Enallagma cyathigerum); Trichoptera (Ithytrichia sp., Hydroptila sp., Polycentropus sp., Oecetis avara, Mystacides spp.); Hemiptera (Notonecta sp., Corixa sp.); Diptera (Chironomus, Endochironomus, Cryptochironomus, Allochironomus, Prochiromonus, Paratendipes, Pentapedilum, Polypedilum, Procladius, Tanytarus, Cladotanytarsus); Coleoptera (Hydroporus sp.); Hydracarina (Hygrobates longipalpis); Gastropoda (Lymnaea caperata, Gyraulus parvus, Menetus exacuus); Perecypoda (Anodonta oregonensis, A. beringaiana, Pisidium compressum, Valvata sincera, V. sp.).
Oncorynchus nerka*, O. mykiss*, Salvelinus namaycush*, Prosopium williamosoni*, Perca fluviatilis flavescens*, Lota lota*, Coregonus clupeaformis*, Catostomus macrocheilus, C. catostomus, Cyprinus carpio*, Ptychocheilus oregonensis, Mylocheilus caurinus, Acrocheilus alutaceus, Richardsonius balteatus, Rhinichthys falcatus, Cottus asper, C. cognatus. * Important for sport-fishing.
- Annual fish catch [no.] (1980)
Rainbow trout: 13,109.
Kokanee: 222,867.
Trends in kokanee escapement in Okanagan Lake.
- Supplementary notes
Reduced kokanee fishery possibly due to introduction of carp, whitefish, mysid shrimp and Eurasian milfoil or to loss of spawning habitat and quality due to channelization, dam construction and diversion of water for irrigation and domestic use. Fishing pressure has increased with the increase in human population near the lake (14).
- Eurasian milfoil (Myriphyllum spicatum) had colonized about one quarter of the lake's littoral zone by 1979 after invading sometime in the early 1970's. It presented a nuisance to boaters and swimmers and a major control effort was undertaken by the provincial authorities to limit these effects on beaches and on boat harbours. The milfoil beds have shrunk to some extent in the last ten years but control (i.e. harvesting, dredging) is still implemented in some areas.
G. SOCIO-ECONOMIC CONDITIONS
G1 LAND USE IN THE CATCHMENT AREA (15) (1970)| [km2] | [%] | |
|---|---|---|
| Natural landscape | ||
| - Woody and | 4,208 | 68 |
| - herbaceous vegetation | ||
| - Others | 990 | 16 |
| Agricultural land | 495 | 8 |
| Residential area | 186 | 3 |
| Others* | 309 | 5 |
| Total | 6,188 | 100 |
- Types of important forest vegetation
- Types of important herbaceous vegetation
- Types of other important vegetation
- Main kinds of crops and/or cropping systems
- Levels of fertilizer application on crop fields: Moderate.
- Trends of changes in land use in recent years
Pinus ponderosa (mid-altitudes), Pseudotsuga menziesii (high altitudes), Abies lasiocarpa, Picea engelmanii (high & exposed subalpine).
Artemisia spp., Agropyron spicatum (low & mid-altitudes), Calamagrostis rubescens (high altitudes), Carex spp. (high & exposed subalpine).
Balsamorhiza sagittata, Opuntia fragilis, Lewisia rediviva, Typha latifolia, Salicornia europaea rubra, Purshia tridentata.
Fruits (apple, cherry, grape, peach, apricot, pear, plum), hay, alfalfa.
Gradual loss of agricultural land to urban development.
| Gross product per year (US$1.00) | No.of persons engaged | Main products or major industries | |
|---|---|---|---|
| Primary industry | |||
| - Crop production | 40,300,000 | 2,650 | Fruit trees, grapes |
| - Fisheries* | |||
| - Others | 49,710,000 | 660 | Lumber, mining |
| Secondary industry | |||
| - Manufacturing | 77,860,000 | 4,170 | Wood products, fabricating |
| - Tourism | 11,240,000 | 1,230 | |
| Tertiary industry Retail | 19,760 | ||
- Number of domestic animals in the catchment area (17)
Cattle 9,350, sheep -1,000, swine 6,975, poultry 372,800, others 4,500.
| Population | Population density [km-2] | Major cities (population) | |
|---|---|---|---|
| Urban | 62,700 | Kelowna, Summerland, Peachland, | |
| Rural | 62,300 | Westbank, Vernon, Armstrong, Naramata, Okanagan Centre, Spallumcheen | |
| Total | 125,000 | 20.2 |
H. LAKE UTILIZATION
H1 LAKE UTILIZATION- Source of water, sightseeing and tourism (no. of visitors in 1980: 1.05 million for entire Okanagan Valley (15)), recreation and fisheries.
| Use rate [m3 day-1] | |
|---|---|
| Domestic | 2,117 |
| Irrigation | 14,165,159 |
| Industrial | 85,435 |
| Others Water work | 2,340 |
I. DETERIORATION OF LAKE ENVIRONMENTS AND HAZARDS
I1 ENHANCED SILTATION- Extent of damage: Not serious.
- Supplementary notes
Relative composition of phosphorus transported to the Okanagan Valley lakes in suspended sediments during snowmelt averaged 62% apatite P, 16% non-apatite P and 22% organic
- Present status: Detected but not serious.
- Main contaminants, their concentrations and sources
| Name of contaminants | Range of concentrations [ppm] | Main Sources | ||
|---|---|---|---|---|
| Water*1 | Bottom mud | Fish*2 | ||
| 1987 (19) | 1974 (4) | 1988 (8) | ||
| Hg | <0.00005-0.00019 | 34-777 ppb | 0.06-0.33 | |
| PCB | <0.0004 | <0.1-0.6 | ||
| PCP/TCP | <0.0001 | 0 | ||
| DDT | <0.01-3.63 | |||
| Organophosphorus | <0.0025 | Pesticides | ||
| Organochlorine | <0.00025 | Pesticides | ||
*2 Dorsal muscle of rainbow trout; wet weight basis [mg l-1].
- Food safety standards or tolerance limits for toxic contaminant residue
Canadian Food and Drug Directorate, World Health Organization.
- Past trends
1970-1988: Mercury in rainbow trout muscle (wet wt. basis). Circles indicate means and vertical lines indicate ranges.
1970-1986: DDT in rainbow trout muscle. Circles indicate means and vertical lines indicate ranges.
- Supplementary notes: British Columbia banned the use of DDT in 1971.
- Nuisance caused by eutrophication
Unusual algal bloom (Anabaena sp.; Vernon Arm, June 1975), foul odour of tap water, and degraded aesthetic value (reduced tourist and local use). - Nitrogen and phosphorus loadings to the lake [t yr-1](2, 15, 17)
Past, present and predicted bioavailable phosphorus loadings.
| 1970 | 1980 | 1990 | |
|---|---|---|---|
| Controllable*1 | |||
| - Point sources | |||
| -- Municipal*2 | 37.5 | 17.0 | 8.5 |
| -- Storm sewers | 0.3 | 0.5 | 0.7 |
| -- Industrial | 0.7 | 1.1 | 1.2 |
| - Non-point sources | |||
| -- Agriculture | |||
| --- Animals | 2.2 | 8.8 | 8.9 |
| --- Fertilizer | 0.3 | 0.4 | 0.4 |
| -- Septic tank | 3.8 | 6.6 | 8.3 |
| -- Logging | N.A. | 6.0 | 6.0 |
| -- Others | 0.2 | 1.3 | 0.3 |
| - Subtotal | |||
| Non-controllable*3 | |||
| -- Dustfall & precipitation*4 | 8.9 | 8.9 | 8.9 |
| -- Watershed sources*5 | 24.5 | 18.5 | 18.5 |
| -- Mainstem loadings*5 | 0.1 | 0.1 | 0.1 |
| - Subtotal | 33.5 | 27.5 | 27.5 |
| Total loadings | 78.5 | 69.2 | 61.8 |
- Supplementary notes
Water quality objective for phosphorus is 0.010 mg l-1 (2)(British Columbia Ministry of Environment water quality criteria documents). Countermeasures are to reduce P contributions from point and non-point sources through the 1982 Okanagan Basin Implementation Agreement (15) and the Okanagan Water Quality Project (1986-1989) described below. Goals: 90-95% removal of P from sewage sources through upgrading of sewage treatment plants and waste management planning for centres without collection systems. Implementing best management practices for agriculture and logging to reduce contributions from these diffuse sources of phosphorus.
- Extent of damage: None.
- Supplementary notes (20)
Based on the high calcium content and alkalinity of Okanagan Lake water, it is considered of low sensitivity to acidic inputs.
Sulphate deposition at Kelowna near centre point of Okanagan Lake.
I5 OTHER HAZARDS
- Log booms.
J. WASTEWATER TREATMENTS
J1 GENERATION OF POLLUTANTS IN THE CATCHMENT AREA- (d) Measurable pollution with limited wastewater treatment.
| Sources | 1970 | 1980 | 1987 | [%] |
|---|---|---|---|---|
| Sewage treatment plants | 59.1 | 19.1 | 11.7 | 14 |
| Septic | 8.0 | 11.5 | 16.9 | 21 |
| Agriculture | 4.5 | 11.9 | 2.5 | 3 |
| Forestry | 8.4 | 8.4 | 8.4 | 10 |
| Other | 41.9 | 41.9 | 41.9 | 51 |
| Total | 81.4 | 100 |
- Percentage of municipal population in the catchment area provided with
adequate sanitary facilities (on-site treatment systems) or public sewerage: 100%. - Percentage of rural population with adequate sanitary facilities (on-site
treatment systems): 100%. - Municipal wastewater treatment systems
No. of tertiary treatment systems: 3 (Kelowna, Vernon, Westbank).
No. of secondary treatment systems: 1 (Armstrong).
K. IMPROVEMENT WORKS IN THE LAKE
Kl RESTORATION- None.
- None.
- Diver operated dredges used to control milfoil in Vernon Arm, Kelowna and Summerland.
L. DEVELOPMENT PLANS
- Most of the land is owned privately and has been developed or can be. Most of the lakeshore suitable for housing development has been developed or will be within a few decades. Dense subdivisions have or will have tertiary treatment for wastewater. Tile fields from septic tanks are not allowed closer than 33 m from the lakeshore and are usually not permitted in area of high groundwater or porous soils which do not remove most of the phosphorus from wastewater. Livestock operations are being encouraged to conform to pollution control guidelines.
M. LEGISLATIVE AND INSTITUTIONAL MEASURES FOR UPGRADING LAKE ENVIRONMENTS
M1 NATIONAL AND LOCAL LAWS CONCERNED- Names of the laws (the year of legislation)
- British Columbia Environment Management Act/Waste Management Act (1982)
- British Columbia Health Act/Sewage Disposal Regulations (1986)
- Responsible authorities
- Government of British Columbia, Ministry of Environment
- Government of British Columbia, Ministry of Health
- Main items of control
- All discharges of wastewater >5,000 IGD
- All discharges of wastewater <5,000 IGD
- Supplementary notes: Limited control over nutrient from agriculture, forestry and urban runoff - most control measures are not regulations but
guidelines.
- Okanagan Basin Study -Joint Canada/British Columbia interdisciplinary program
- British Columbia Pollution Control/Waste Management Branch, British Columbia Ministry of Environment
- Okanagan Basin Implementation Program - Joint Canada/British Columbia project to implement recommendations of the Okanagan Basin Study
- British Columbia Waste Management Branch
- British Columbia Water Management Branch
N. SOURCES OF DATA
- Questionnaire filled by Drs. J. E. Bryan, Head of Environmental Section & E. V. Jensen, Impact Assessment Biologist. Waste Management Program, Ministry of Environment, British Columbia.
- Stockner, J. G. & Northcote, T. G. (1974) Recent limnological studies of the Okanagan basin lakes and their contribution to comprehensive water resource planning. J. Fish. Res. Board Can., 31: 955-976.
- Anon. (1985) Phosphorus in the Okanagan Valley Lakes: Sources, Water Quality Objectives and Control Possibilities. Ministry of Environment, Waste Management Branch, Victoria, B. C.
- Anon. (1974) Main Report of the Consultative Board Including the Comprehensive Framework Plan. Canada-British Columbia Okanagan Agreement, Office of the Study Director, Penticton, B. C.
- St. John, B. E. (1973) The Limnogeology of the Okanagan Mainstem Lakes. Canada-British Columbia Basin Agreement. 41 pp. Office of the Study Director, Penticton, B. C.
- Canadian Climate Normals, 1951-1980. Environment Canada, Atmospheric Environment Service.
- Truscott, S. J. & Kelso, B. W. (1979) Trophic Changes in Lakes Okanagan, Skaha and Osyoos, B. C., Following Implementation of Tertiary Municipal Waste Treatment. Canada-British Columbia Okanagan Basin Implementation Agreement, Penticton, B. C.
- Jensen, E. V. (MS1981) Results of the Continuing Water Quality Monitoring Program on Okanagan Lakes for Years 1979 to 1980. Canada-British Columbia Okanagan Basin Implementation Agreement, Ministry of the Environment, Penticton, B. C.
- Ministry of Environment, Waste Management Branch, Penticton, B. C. Unpublished data.
- Bryan, J. E. (1987) Effects of Wastewater Releases by City of Vernon on Vernon Creek and Vernon Arm of Okanagan Lake in 1984 and 1985. British Columbia Ministry of Environment and Parks. ISBN 0-7726-0720-6. 35 pp.
- Warrington, P. (1980) Studies on Aquatic Macrophytes, Part 33, Aquatic Plants of British Columbia. Ministry of Environment, Littoral Resources Unit, Victoria, B. C.
- Clemens, W. A., Rawson, D. S. & McHugh, J. L. (1939) A Biological Survey of Okanagan Lake, British Columbia. Fish. Res. Board Can., Bulletin no. 56.
- Seather, 0. A. (1970) A survey of the Bottom Fauna in Lakes of the Okanagan Valley, British Columbia. Technical Report No. 196, Fish Res. Board Can., Freshwater Institute, Winnipeg, Manitoba.
- Anon. (1974) Fisheries and Sport Fish Potentials of the Okanagan Basin. Technical Supplement IX(A) to the Final Report. Canada-British Columbia Okanagan Basin Agreement, Penticton, B. C.
- Bull, C. J. (MS1987) Okanagan Lake Plan. Technical Report, Ministry of Environment, Fisheries Section, Okanagan Sub-region, Penticton, B. C.
- Anon. (1982) Okanagan Basin Implementation Board, Report of the Okanagan Basin Implementation Agreement.
- Taylor, R. L. & MacBride, B. (1977) Vascular Plants of British Columbia. Technical Bulletin no. 4, University of British Columbia.
- Anon. (1982) 1980 Update-Nutrient Loadings from Non-point Sources, Review Item B-4, Non-point Sources, Okanagan Basin Implementation Agreement. Prepared by Canadian Bio-Resources Engineering Ltd. for the Okanagan Basin Implementation Board.
- Gray, C. B. J. & Kirkland, R. A. (1986) Suspended sediment phosphorus composition in tributaries of the Okanagan lakes, B. C. Water Research, 20(9): 1193-1196.
- Jensen, E. V. (MS1987) Results of Trace Contaminant Monitoring on Okanagan and Skaha Lake Water, April 1987. 11 pp. B. C. Ministry of Environment.
- Swain. L. G. (1985) Chemical Sensitivity of Lakes in British Columbia to Acidic Inputs. Water Management Branch, Victoria, B. C.
- Anon. (1988) Acid Rain in British Columbia. Ministry of Environment and Parks, Victoria, B. C.
- Alexander, D. G. Summary of Nitrogen and Phosphorus Loadings to the Okanagan Main Valley Lakes from Cultural and Natural Sources. Okanagan Basin Implementation Board Internal Report.
- Newroth, P. (1981) Case Studies of Aquatic Plant Management for Lake Preservation and Restoration in British Columbia, Canada. Restoration of Lakes and Inland Waters. U.S. EPA Report 440/5-81-010.
- Bryan, J. E. (MS1989) Water Quality of the Main Valley Okanagan Lakes. B. C. Ministry of the Environment.
