
LAKE MEMPHREMAGOG
A view on the lake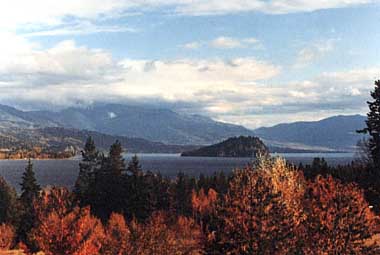
Photo: J.Kalff
A. LOCATION
- Quebec, Canada; and Vermont, USA.
- 44:5-45:5N, 72:0-72:7W; 208 m above sea level.
B. DESCRIPTION
Lake Memphremagog is a long (40 km) but narrow (1-3 km) lake, located 130 km to the east of Montreal, Quebec. It is a transboundary lake, receiving 71% of its stream inflow from the Vermont, USA, portion of its catchment, but with 75% of the lake surface area in Quebec, Canada. It is a lake of exceptional, rugged beauty; set in a diverse landscape, hilly and mountainous to the west, but with pastoral, rolling farmland to the east.The drainage basin of Lake Memphremagog is situated in the physiographic region of the Piedmont. Its early geologic history is tied to the uplift and folding of the Appalachian Mountain chain. The present lake basin was formed about 11,000 B. P. by glacial gouging of a preexisting valley during the final retreat of the Wisconsin glaciation. Following the termination of the Champlain Sea phase, the present lake was formed about 9,500 B. P.
The lake has three distinct basins, a deep Central, and shallower North and South basins. 70% of the lake's watershed is drained by three rivers which enter the lake at the extreme south end and provide the primary input of nutrients into the lake. This has resulted in a distinct nutrient gradient within the lake - the southern end is mesotrophic, while the Central and North basins remain oligotrophic.
The first known settlements
were established by the St. Francis Indian community on what they called
Lake "Mem-plow-bouque" (large, beautiful expanse of water). The first European
settlements were founded in 1793 at Ducansborough (now Newport, Vermont)
and in 1794 at Gibraltar Point (now Bolton, Quebec). The Canadian side
was largely settled by United Empire Loyalists (settlers who left America
after the revolution because they wanted to remain under the British Flag).
The lake was popular as a recreation and vacation area in the mid-to-late
1800's, but tourism dropped off sharply after the turn of the century and
the area was not subjected to the intensive development pressures and related
problems that have affected other river basins in the northeastern United
States or southern Quebec. These historical trends are changing as the
1980's brought a new tourism boom and a steady wave of related development
to both the American and Canadian portions of the lake basin. The problems
associated with increased development have, for the present, been offset
by a continuing reduction in crop growing and increased forest regrowth,
as well as the installation of tertiary sewage treatment at Newport in
1983 (1, 2, 3).
C. PHYSICAL DIMENSIONS (1, 2)
| Basin | North | Central | South | Total |
|---|---|---|---|---|
| Surface area [km2] | - | - | - | 102 |
| Volume [km3] | - | - | - | 1.7 |
| Maximum depth [m] | 33 (2) | 107 | 12 | 107 |
| Mean depth [m] | 13 | 55 | 8 | 15.5 |
| Water level | - | - | - | Regulated |
| Normal range of annual water level fluctuation [m] | - | - | - | 0.5 |
| Length of shoreline [km] | - | - | - | 121 |
| Residence time [yr] | - | - | - | 1.7 |
| Catchment area [km2] | - | - | - | 1,764 |
D. PHYSIOGRAPHIC FEATURES
D1 GEOGRAPHICAL
- Bathymetric map: Fig. NAM-48-01.
- Names of main islands
- Number of outflowing rivers and channels (name): 1 (Magog R.).
Trois Soeurs, Lords, Molson, Longue, Ronde, Province and Whetstone.
D2 CLIMATIC
- Climatic data at Sherbrooke*, 1987 (6)
| Jan | Feb | Mar | Apr | May | Jun | Jul | Aug | Sep | Oct | Nov | Dec | Ann. | |
|---|---|---|---|---|---|---|---|---|---|---|---|---|---|
| Mean temp. [deg C] | -11 | -13 | -2 | 7 | 11 | 18 | 19 | 16 | 13 | 6 | -1 | -6 | 4 |
| Precipitation [mm] | 58 | 22 | 54 | 41 | 99 | 124 | 85 | 58 | 93 | 117 | 112 | 62 | 925 |
- Number of hours of bright sunshine: 1,895 hr yr-1.
- Solar radiation (Montreal Jean Brebeuf*)[MJ m-2 day-1]
| Jan | Feb | Mar | Apr | May | Jun | Jul | Aug | Sep | Oct | Nov | Dec | Ann. |
|---|---|---|---|---|---|---|---|---|---|---|---|---|
| 5.30 | 8.80 | 12.51 | 15.87 | 9.07 | 20.25 | 20.96 | 17.23 | 13.45 | 8.04 | 4.61 | 3.92 | 12.5 |
- Fig. NAM-48-01
Bathymetric map [30 ft=9.14 m](Q).

- Water temperature [deg C](4)
| Depth [m] | Jan | Feb | Mar | Apr | May*1 | Jun*2 | Jul*3 | Aug*4 | Sep | Oct | Nov | Dec |
|---|---|---|---|---|---|---|---|---|---|---|---|---|
| S*5 | - | - | - | - | 9.5 | 14.4 | 22.7 | 22.3 | - | - | - | - |
| 1 | - | - | - | - | 9.3 | 14.4 | 21.1 | 22.6 | - | - | - | - |
| 2 | - | - | - | - | 9.0 | 14.2 | 20.6 | 22.8 | - | - | - | - |
| 3 | - | - | - | - | 8.8 | 14.2 | 20.3 | 23.1 | - | - | - | - |
| 4 | - | - | - | - | 8.7 | 14.2 | 20.2 | 23.5 | - | - | - | - |
| 5 | - | - | - | - | 8.5 | 14.1 | 20.1 | 23.9 | - | - | - | - |
| 6 | - | - | - | - | 8.5 | 14.1 | 19.9 | 24.1 | - | - | - | - |
| 7 | - | - | - | - | 8.4 | 14.1 | 16.2 | 23.9 | - | - | - | - |
| 8 | - | - | - | - | 5.2 | 13.7 | 15.6 | 23.9 | - | - | - | - |
| 9 | - | - | - | - | 5.1 | 11.2 | - | - | - | - | - | - |
| Depth [m] | Jan | Feb | Mar | Apr | May*1 | Jun*2 | Jul*3 | Aug*4 | Sep | Oct | Nov | Dec |
|---|---|---|---|---|---|---|---|---|---|---|---|---|
| S | - | - | - | - | 4.9 | 13.2 | 24.1 | 22.1 | - | - | - | - |
| 1 | - | - | - | - | 4.9 | 13.1 | 23.8 | 22.1 | - | - | - | - |
| 2 | - | - | - | - | 4.8 | 12.4 | 22.1 | 22.1 | - | - | - | - |
| 3 | - | - | - | - | 4.8 | 12.2 | 21.3 | 22.1 | - | - | - | - |
| 4 | - | - | - | - | 4.8 | 12.2 | 21.0 | 22.1 | - | - | - | - |
| 5 | - | - | - | - | 4.8 | 11.3 | 20.3 | 22.1 | - | - | - | - |
| 6 | - | - | - | - | - | 10.0 | 19.8 | 22.1 | - | - | - | - |
| 10 | - | - | - | - | - | 6.6 | 16.4 | 22.1 | - | - | - | - |
| 15 | - | - | - | - | - | - | - | 16.1 | - | - | - | - |
| Depth [m] | Jan | Feb | Mar | Apr | May*1 | Jun*2 | Jul*3 | Aug*4 | Sep | Oct | Nov | Dec |
|---|---|---|---|---|---|---|---|---|---|---|---|---|
| S | - | - | - | - | 8.4 | 13.8 | 23.5 | 20.6 | - | - | - | - |
| 1 | - | - | - | - | 8.3 | 13.8 | 21.4 | 20.8 | - | - | - | - |
| 3 | - | - | - | - | 8.3 | 13.8 | 20.2 | 20.8 | - | - | - | - |
| 5 | - | - | - | - | 8.0 | 13.7 | 19.2 | 20.8 | - | - | - | - |
| 7 | - | - | - | - | 7.5 | 13.6 | 18.3 | 20.5 | - | - | - | - |
| 9 | - | - | - | - | 6.8 | 12.9 | 17.1 | 20.4 | - | - | - | - |
| 11 | - | - | - | - | 6.5 | 10.9 | 15.6 | 19.9 | - | - | - | - |
| 13 | - | - | - | - | 6.2 | 9.4 | 13.3 | 17.8 | - | - | - | - |
| 15 | - | - | - | - | 6.2 | 9.1 | 10.5 | 12.4 | - | - | - | - |
| 17 | - | - | - | - | 6.1 | 8.4 | 8.3 | 9.1 | - | - | - | - |
| 19 | - | - | - | - | 6.0 | 6.8 | 7.2 | 8.8 | - | - | - | - |
- Freezing period
- Mixing type
- Notes on water mixing and thermocline formation
South basin: Early December-middle April.
North and central basin: Middle December-middle April.
South basin: Polymictic.
North and central basin: Dimictic.
Thermally stratified in the Central and North basins, late May-October, with thermocline at 9-11 m depth.
E. LAKE WATER QUALITY
E1 TRANSPARENCY [m](4)
| Jan | Feb | Mar | Apr | May | Jun | Jul | Aug | Sep | Oct | Nov | Dec |
|---|---|---|---|---|---|---|---|---|---|---|---|
| - | - | - | - | 6 | 5 | 5.3 | 4.8 | 5.8 | - | - | - |
| Jan | Feb | Mar | Apr | May | Jun | Jul | Aug | Sep | Oct | Nov | Dec |
|---|---|---|---|---|---|---|---|---|---|---|---|
| - | - | - | - | - | 3.9 | 4.5 | 4.3 | 3.5 | 5.7 | - | - |
| Jan | Feb | Mar | Apr | May | Jun | Jul | Aug | Sep | Oct | Nov | Dec |
|---|---|---|---|---|---|---|---|---|---|---|---|
| - | - | - | - | 2.9 | 3.6 | 3.6 | - | 4.8 | - | - | - |
E2 pH
| Depth [m] | Jan | Feb | Mar | Apr | May | Jun | Jul | Aug | Sep | Oct | Nov | Dec |
|---|---|---|---|---|---|---|---|---|---|---|---|---|
| S* | - | - | - | - | - | - | - | 8.3 | - | - | - | - |
| Depth [m] | Jan | Feb | Mar | Apr | May | Jun | Jul | Aug | Sep | Oct | Nov | Dec |
|---|---|---|---|---|---|---|---|---|---|---|---|---|
| S | - | - | - | - | - | 6.7 | - | 7.1 | - | - | - | - |
E4 DO [mg l-1](18)
| Depth [m] | Jan | Feb | Mar | Apr | May | Jun | Jul | Aug | Sep | Oct | Nov | Dec |
|---|---|---|---|---|---|---|---|---|---|---|---|---|
| 1 | - | - | - | - | 12.5 | 10.8 | 9.5 | 9.3 | 8.8 | - | - | - |
| 3 | - | - | - | - | 12.6 | 10.8 | 9.7 | 9.3 | 8.9 | - | - | - |
| 5 | - | - | - | - | 12.6 | 10.8 | 9.9 | 9.4 | 8.9 | - | - | - |
| 7 | - | - | - | - | 12.7 | 10.8 | 10.0 | 9.5 | 8.8 | - | - | - |
| 9 | - | - | - | - | 12.6 | 10.8 | 9.7 | 9.5 | 8.7 | - | - | - |
| 11 | - | - | - | - | 12.5 | 10.8 | 9.5 | 9.5 | 8.0 | - | - | - |
| 13 | - | - | - | - | 12.4 | 10.8 | 9.1 | 8.8 | 7.3 | - | - | - |
| 15 | - | - | - | - | 12.3 | 10.8 | 9.1 | 8.2 | 7.5 | - | - | - |
| 17 | - | - | - | - | 12.3 | 10.9 | 9.5 | 7.8 | 8.4 | - | - | - |
| 19 | - | - | - | - | 12.3 | 10.9 | 9.7 | 8.1 | 8.7 | - | - | - |
| 21 | - | - | - | - | 12.3 | 11 | 10.2 | 8.8 | 9.3 | - | - | - |
E6 CHLOROPHYLL CONCENTRATION [micro l-1](4)
| Depth [m] | Jan | Feb | Mar | Apr | May | Jun | Jul | Aug | Sep | Oct | Nov | Dec |
|---|---|---|---|---|---|---|---|---|---|---|---|---|
| 5*2 | - | - | - | - | 3.0 | 4.2 | 2.5 | 2.6 | 3.3 | - | - | - |
| Depth [m] | Jan | Feb | Mar | Apr | May | Jun | Jul | Aug | Sep | Oct | Nov | Dec |
|---|---|---|---|---|---|---|---|---|---|---|---|---|
| 5*2 | - | - | - | - | 4.0 | 3.9 | 2.1 | 3.6 | 2.9 | - | - | - |
| Depth [m] | Jan | Feb | Mar | Apr | May | Jun | Jul | Aug | Sep | Oct | Nov | Dec |
|---|---|---|---|---|---|---|---|---|---|---|---|---|
| 5*2 | - | - | - | - | 4.7 | 6.0 | 4.2 | 3.6 | 2.3 | - | - | - |
E7 NITROGEN CONCENTRATION (4)
- Total-N [mg l-1]
| Depth [m] | Jan | Feb | Mar | Apr | May | Jun | Jul | Aug | Sep | Oct | Nov | Dec |
|---|---|---|---|---|---|---|---|---|---|---|---|---|
| 5*2 | - | - | - | - | 0.60 | 0.35 | 0.28 | 0.30 | 0.23 | - | - | - |
| Depth [m] | Jan | Feb | Mar | Apr | May | Jun | Jul | Aug | Sep | Oct | Nov | Dec |
|---|---|---|---|---|---|---|---|---|---|---|---|---|
| 5*2 | - | - | - | - | 0.65 | 0.42 | 0.31 | 0.23 | 0.39 | - | - | - |
| Depth [m] | Jan | Feb | Mar | Apr | May | Jun | Jul | Aug | Sep | Oct | Nov | Dec |
|---|---|---|---|---|---|---|---|---|---|---|---|---|
| 5*2 | - | - | - | - | 0.46 | 0.42 | 0.36 | 0.29 | 0.27 | - | - | - |
E8 PHOSPHORUS CONCENTRATION (4)
- Total-P [mg l-1]
| Depth [m] | Jan | Feb | Mar | Apr | May | Jun | Jul | Aug | Sep | Oct | Nov | Dec |
|---|---|---|---|---|---|---|---|---|---|---|---|---|
| 5*2 | - | - | - | - | .013 | .013 | .011 | .010 | .009 | - | - | - |
| Depth [m] | Jan | Feb | Mar | Apr | May | Jun | Jul | Aug | Sep | Oct | Nov | Dec |
|---|---|---|---|---|---|---|---|---|---|---|---|---|
| 5*2 | - | - | - | - | .017 | .013 | .012 | .011 | .011 | - | - | - |
| Depth [m] | Jan | Feb | Mar | Apr | May | Jun | Jul | Aug | Sep | Oct | Nov | Dec |
|---|---|---|---|---|---|---|---|---|---|---|---|---|
| 5*2 | - | - | - | - | .016 | .016 | .016 | .015 | .014 | - | - | - |
E10 PAST TRENDS: Fig. NAM-48-02 and 03.
- Fig. NAM-48-02
Mean summer concentration of chlorophyll a, 1972-1986 [micro l-1].

- Fig. NAM-48-03
Mean summer concentration of Total-P, 1972-1986 [micro l-1].

F. BIOLOGICAL FEATURES
All stations combined, 1973-1987F1 FLORA
- Submerged macrophytes (7)
- Phytoplankton (14)
Cabomba caroliniana, Elodea canadensis, E. septangular, Heteranthera dubia, Isoetes sp., Myriophyllum spicatum, Najas sp., Potamogeton richardsonii, P.
praelongus, Vallisneria americana, Nitella sp.
South basin: Diatoma tenue var. elongatum, Oscillatoria redekei, Ceratium hirundinella, Rhodomonas minuta, Melosira italica, Cryptomonas reflexa, Stephanodiscus astraea, S. nantzschii, Asterionella formosa, Fragilaria crotonensis, Uroglena volvox, Anabaena flos-aqae, Gleococcus schraeteri, Coelosphaerium naegelianum.
North basin: Diatoma tenue, Oscillatoria redekei, Fragilaria crotonensis, Rhizosolenia eriensis, R. minuta, Botryococcus braunii, Cyclotella bodanika, C. hirundinella, Synedra ulna var. danica, Chrysochromulina parva, Gleococcus schroeteria, Coelosphaerium naegelianum.
F2 FAUNA
- Zooplankton (12, 16, 17)
- Benthos (8, 12)
- Fish (9)
- Supplementary notes on the biota (8, 9)
Cyclops bicuspidatus thomasi, C. vernalis, Mesocyclops edax, Diaptomus sicilis, D. minutus, Tropocyclops prasinus mexicanus, Epischura lacustris, Senecella calanoides, Daphnia galeata, Bosmina longirostris, B. coregoni, Chydorus sphaericus, Holopedium gibberum, Ceriodaphnia quadrangula, Diaphanosoma leuchtenbergianum, Keratella sp., Monostyla sp., Polyarthra sp.
Chironomus anthracinus, Chaoborus punctipennis, Tanytarsus spp., Procladius spp., Phaenospectra sp., Microspectra sp., Pontoporeia hoyi, Amnicola sphaerium, Fossaria, Helisoma.
Hybognathus nuchalis, Notemigonus crysoleucas, Notropis volucellus, Pimephales notatus, Etheostoma nigrum, Perca flavescens, Fundulus diaphanus, Lepomis gibbosus, Micropterus dolomieu, Semotilus corporalis, Catostomus commersoni, Osmerus mordax.
The nutrient gradient along the axis of the lake influences the abundance and distribution of organisms. Biomass of fish species is about three times greater in the more productive southern end. Phytoplankton and benthos biomass and production too are greater in the south.
F3 PRIMARY PRODUCTION RATE (10)
- Phytoplankton
Net C14 Production rate [g C m-2 day-1]
| 1973 | 1972 | Ann. | ||||||||||
|---|---|---|---|---|---|---|---|---|---|---|---|---|
| Jan | Feb | Mar | Apr | May | Jun | Jul | Aug | Sep | Oct | Nov | Dec | total |
| 0.1 | 0 | 0.1 | 0.3 | 0.8 | 0.9 | 0.7 | 0.7 | 1.0 | 0.5 | 0.3 | 0.2 | 175* |
| 1973 | 1972 | Ann. | ||||||||||
|---|---|---|---|---|---|---|---|---|---|---|---|---|
| Jan | Feb | Mar | Apr | May | Jun | Jul | Aug | Sep | Oct | Nov | Dec | total |
| - | - | - | - | 0.6 | 1.0 | 0.7 | 1.0 | - | - | - | - | - |
| 1973 | 1972 | Ann. | ||||||||||
|---|---|---|---|---|---|---|---|---|---|---|---|---|
| Jan | Feb | Mar | Apr | May | Jun | Jul | Aug | Sep | Oct | Nov | Dec | total |
| 0.1 | 0.1 | 0.3 | 0.7 | 0.7 | 0.7 | 1.3 | 1.1 | 1.5 | 0.7 | 0.2 | 0.1 | 219* |
F4 BIOMASS (9)
- Benthos [g (dry wt.) m-2]
1972-1973 South basin: 3.30 òÂ0.25.
North basin: 1.19 òÂ0.06.
F7 NOTES ON THE REMARKABLE CHANGES OF BIOTA IN THE LAKE IN RECENT YEARS
- None.
G. SOCIO-ECONOMIC CONDITIONS
G1 LAND USE IN THE CATCHMENT AREA (1, 2)
| Area [km2] | [%] | |
|---|---|---|
| Natural landscape | ||
| - Woody vegetation | 1,300 | 74 |
| - Herbaceous vegetation | 88 | 5 |
| - Swamp | 36 | 2 |
| Agricultural land | ||
| - Crop field | 240 | 14 |
| Residential area | 80 | 5 |
| Total | 1,744 | 100 |
- Types of important forest vegetation: Maple, beech, birch, spruce, fir.
- Types of important herbaceous vegetation: Abandoned pasture, hay.
- Main kinds of crops and/or cropping systems: Hay, maize.
- Levels of fertilizer application on crop fields
- Trends of change in land use in recent years (2)
Light (manure application).
Historically, economy based on natural resources. Now manufacturing is playing a more significant role. 37% decline in natural resource industries (agriculture, forestry) from 1960 to 1970. In the 1980's, 10% of woodland harvested annually.
G2 INDUSTRIES IN THE CATCHMENT AREA AND THE LAKE (2)
| Gross product during the year (= US$1.00) | Percentage of persons engaged | No. of establishments | Main products or major industries | |
|---|---|---|---|---|
| Primary industry | 24 mill. | 16 | 666 | |
| - Crop production | Corn, hay | |||
| - Animal husbandry | Dairy products | |||
| - Fisheries | ||||
| Secondary industry | ||||
| - Manufacturing & construction | N.A. | 32 | 27 | Machinery, clothing Service, transport, etc. |
| Tertiary industry | N.A. | 40 | ||
| (Unemployed) | 12 | |||
- Numbers of domestic animals in the catchment area
Cattle 25,000, others unknown.
G3 POPULATION IN THE CATCHMENT AREA (2)
| Population* density [km-2] | Population (population) | Main cities | |
|---|---|---|---|
| Rural | 19,702 | ||
| Total | 19,702 | 11.2 | Newport, Derby |
- Supplementary notes (1)
Seasonal population is +20,000, and rapidly growing. More than 1,500 vacation cottages line the shores of the lake.
H. LAKE UTILIZATION
H1 LAKE UTILIZATION
- Source of water, sightseeing and tourism (no. of visitors in 1975:
20,000) and recreation (swimming, sport-fishing, yachting).
H2 THE LAKE AS WATER RESOURCE (2)
| Use rate [m3 sec-1] | |
|---|---|
| Domestic | 1 |
| Industrial | 34 |
I. DETERIORATION OF LAKE ENVIRONMENTS AND HAZARDS
I1 ENHANCED SILTATION
- Extent of damage: Not serious.
- Supplementary notes
Excessive erosion and sedimentation on cropland on steep slopes-on Vermont rivers. Streambank erosion due to livestock and soil erosion due to poor logging practices. Offset by gradual reduction in cropland and increases in pasture and forest.
I2 TOXIC CONTAMINATION
- Present status: Detected but not serious.
- Main contaminants, their concentration and sources
| Name of contaminants | Concentration [ppm] in bottom mud* |
|---|---|
| Zn | 198 |
| Mn | 533 |
| Ni | 109 |
| Cu | 45 |
| Pb | 117 |
- Supplementary notes (11)
Metal levels not highly variable throughout the lake.
I3 EUTROPHICATION
- Nitrogen and phosphorus loadings to the lake [t yr-1](13)
| Sources | Domestic 1987 | River loading 1972 | Natural recip. 1972 | Total |
|---|---|---|---|---|
| T-P | 1 | 21 | 7 | 29 |
- Supplementary notes (13)
Eutrophication has only been a problem in the extreme south end of the lake, while north and central basins are oligotrophic. However, a new sewage treatment system that went into operation in 1983 reduced the T-P loadings (from the town of Newport) from 20 t yr-1 to
I4 ACIDIFICATION
- Extent of damage: None.
J. WASTEWATER TREATMENTS
J1 GENERATION OF POLLUTANTS IN THE CATCHMENT AREA
- (c) Limited pollution with wastewater treatment.
J3 SANITARY FACILITIES AND SEWERAGE
- Percentage of municipal population in the catchment area provided with
- Percentage of rural population with adequate sanitary facilities (on-site
- Municipal wastewater treatment systems
- Industrial wastewater treatment systems
adequate sanitary facilities (on-site treatment systems) or public sewerage: 100%.
treatment systems): Unknown.
No. of tertiary treatment systems: 3 (P removal).
No. of secondary treatment systems: 3.
No. of industrial wastewater treatment systems: 2.
K. IMPROVEMENT WORKS IN THE LAKE (Q)
- None.
L. DEVELOPMENT PLANS (Q)
Increasing recreational development and condominium construction.M. LEGISLATIVE AND INSTITUTIONAL MEASURES FOR UPGRADING LAKE ENVIRONMENTS
M1 NATIONAL AND LOCAL LAWS CONCERNED
- Names of the laws (the year of legislation)
- The level at which Lake Memphremagog should be maintained. Dam on outflow (1935).
- Responsible authorities
- Environment Canada, U.S. Dept. of the Army/Corps of Engineers, Quebec
- Dept. of the Environment
- Main items of control
- Lake level
M2 INSTITUTIONAL MEASURES
Memphremagog Conservation Inc., Quebec (employs students in clean-up work and public education).M3 RESEARCH INSTITUTES ENGAGED IN THE LAKE ENVIRONMENT STUDIES
- Limnology Research Centre, McGill University, Montreal, Quebec
N. SOURCES OF DATA
- Questionnaire filled by Dr. J. Kalff, Limnology Research Centre, McGill University, Montreal, Canada.
- Memphremagog Conservation Inc. (1982) Environmental Land Use Guide of the Lake Memphremagog Watershed.
- New England River Basins Commission (1981) Lake Memphremagog-St. Francis River Basin Overview.
- Carlson, R. E., Kalff, J. & Leggett, W. C. (1979) The phosphorus and nitrogen budgets of Lake Memphremagog; with a predictive model of its nutrient content following sewage removal.
- Limnology Research Centre (1972-1988) Lake Memphremagog Data Collection.
- Rasmussen, J. Personal communication.
- Environment Canada (1987) Meteorological reports.
- ) Canadian Climate Normals, 1951-1980. Environment Canada, Atmospheric Environment Service.
- Downing, J. A. & Anderson, M. R. (1985) Estimating the standing biomass of aquatic macrophytes. Can. J. Fish. Aquat. Sci., 42(12): 1860-1869.
- Dermott, R. M., Kalff, J., Leggett, W. C. & Spence, J. (1977) Production of Chironomus, Procladius and Chaoborus at different levels of phytoplankton biomass in Lake Memphremagog, Quebec-Vermont. Can. J. Fish Aquat. Sci., 34(11): 2001-2007.
- Gascon, D. & Leggett, W. C. (1977) Distribution, abundance and resource utilization of littoral zone fishes in response to a nutrient/production gradient in Lake Memphremagog. J. Fish. Res. Bd., 34: 1105-1117.
- Ross, P. E. & Kalff, J. (1975) Phytoplankton production in Lake Memphremagog, Quebec (Canada) - Vermont (USA). Verh. Int. Ver. Limn., 19: 760-769.
- Rowan, D., McGill Univ. Personal communication.
- Morse, J. W. & Flanders, P. H. (1971) Primary Productivity Study of Three Vermont Lakes. State of Vermont Agency of Conservation.
- Kalff, J. & Lawson, A. (1988) The Capacity of Lake Memphremagog for Further Development. Limnology Research Centre, McGill University.
- Watson, S. (1979) Phytoplankton dynamics in Lake Memphremagog and their relationship to trophic level. M. Sc. Thesis, McGill University, Montreal.
- Chambers, P. & Kalff, J. (1985) Depth distribution and biomass of submerged aquatic macrophyte communities in relation to Secchi depth. Can. J. Fish. Aquat. Sci., 42: 701-709.
- Sarafian, V. (1984) Life cycles, biomass and production of copepods in Lake Memphremagog. M. Sc. Thesis, Concordia University, Montreal.
- Shoenert, R. A. & Peters, R. H. Cladoceran abundance along the trophic gradient of Lake Memphremagog. Internal report. McGill University, Montreal.
- Marshall, T. Personal communication.
McGill University, Montreal, Quebec.
