
WABAMUN LAKE
An aerial view of the lake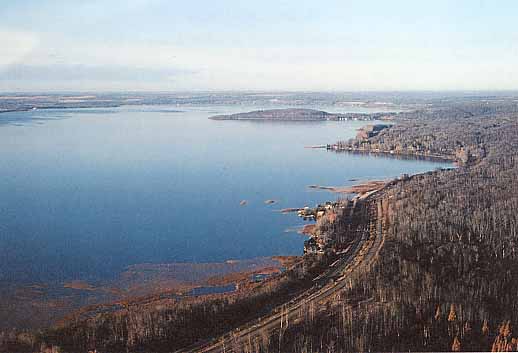
Photo: P.Mitchell
A. LOCATION
- Alberta, Canada.
- 53:3N, 114:6W; 724.7 m above sea level.
B. DESCRIPTION
Lake Wabamun, one of the best-known lakes of Alberta, lies 60 km west of Edmonton. The name "Wabamun" is a Cree word meaning mirror.Lake Wabamun is a large shallow lake that is 19.2 km long and 6.6 km wide. Its long fetch along the prevailing wind results in heavy wave action at times. The deepest area reaching 11 m is at the western end. There are natural beaches along much of the shoreline, but emergent vegetation restricts their use. The littoral zone (<5 m depth) includes 31% of lake bottom. Sandy areas are found at depths less than 2 m with soft clay or organic sediments over most of the lake bottom.
The range of water level fluctuation since the earliest records (1915; continuous records since 1933) amounts to about 1.4 m, although normal range is about 1 m on approximately a ten-year cycle. Since 1912 a number of control structures have been built and subsequently destroyed on one or the other of the two outlet creeks. As of 1989 investigations were underway to determine an elevation for a suitable control structure.
Despite abundant aquatic vegetation along shorelines and in bays, the water in L. Wabamun is often fairly clear and blue-green algal blooms are rare. The popular opinion is that the nuisance growth of an aquatic weed, Elodea canadensis, which was not observed in the lake before 1968, caused poor water quality. The cooling water discharge from two power plants on the shore were implicated as the cause. Since the diversion of cooling water to a large cooling pond in 1975, Elodea began to decline simultaneously, and is now rare in the lake, except near the cooling water discharge canal from the 3rd power plant.
The drainage basin surrounding the lake is about three times as wide as the lake surface; the terrain is gently rolling to undulating hills to the south of the lake. The native vegetation is dominated by trembling aspen, balsam poplar and willow with white spruce in undisturbed areas. About half of the land is used for agriculture. Coal is strip-mined extensively north and south of the lake. As coal excavation moves west, the mined-out land is reclaimed, primarily for agricultural purposes, but reclamation efforts will include recontouring and the return of native vegetation.
At least 35 drainage courses convey runoff and groundwater to the lake, of which the seven largest account for about 70% of the total runoff. Mine drainage enters the lake after settling in several ponds. Two outlets, one of which is a man-made through-cut, join to form Wabamun Creek, which flows intermittently toward the North Saskatchewan River.
The community of Wabamun was established in 1912. The first coal mines in the lake's watershed began underground operations in 1910; strip mining began in 1948. Three power plants have been built by TransAlta Utilities to take advantage of the abundant supply of local coal. At present only one (started operation in 1983) uses lake water for cooling, and heated effluent is returned to Kapasiwin Bay, where a large portion of the bay area remains ice- free in winter.
The provincial park located on Moonlight Bay is a focus of activity on warm summer weekends, such as boating, swimming, fishing, camping, and hiking. Fishing is one of the most popular activities on the lake. In summer, fishing is often excellent for northern pike and increasingly so for walleye. In winter, ice-fishing for whitefish draws hundreds of fishermen on mild weekends and large pike may be taken from the outlet canal at the power plant (4, 5, 11, 12).
C. PHYSICAL DIMENSIONS
| Surface area [km2] | 82 |
| Volume [km3] | 0.513 |
| Maximum depth [m] | 11 |
| Mean depth [m] | 6.3 |
| Water level | Unregulated |
| Normal range of annual water level fluctuation [m] | 1 |
| Length of shoreline [km] | 57.3 |
| Residence time [yr] | >100 |
| Catchment area [km2] | 259 |
D. PHYSIOGRAPHIC FEATURES
D1 GEOGRAPHICAL
- Bathymetric map: Fig. NAM-45-01.
- Names of main islands: None.
- Number of outflowing rivers and channels (name): 1 (Wabamun Creek).
D2 CLIMATIC
- Climatic data at Highvale*, 1985 (17)
| Jan | Feb | Mar | Apr | May | Jun | Jul | Aug | Sep | Oct | Nov | Dec | Ann. | |
|---|---|---|---|---|---|---|---|---|---|---|---|---|---|
| Mean temp. [deg C] | -6.9 | -11.3 | -0.7 | 5.6 | 12.5 | 13.0 | 17.9 | 14.5 | 7.3 | 4.0 | -12.4 | -3.2 | 3.4 |
| Precipitation [mm] | 23 | 18 | 3 | 49 | 38 | 73 | 44 | 112 | 69 | 25 | 17 | - | 471 |
Mean annual precipitation: 534 mm (6).
- Number of hours of bright sunshine: 2,315 hr yr-1 (10).
- Solar radiation (Edmonton Stony Plain*)[MJ m-2 day-1](10)
| Jan | Feb | Mar | Apr | May | Jun | Jul | Aug | Sep | Oct | Nov | Dec | Ann. |
|---|---|---|---|---|---|---|---|---|---|---|---|---|
| 3.65 | 7.09 | 12.43 | 17.53 | 20.21 | 21.87 | 21.89 | 18.09 | 12.11 | 7.69 | 3.95 | 2.59 | 12.4 |
Bathymetric map [m](1).
Area/capacity curve for Wabamun Lake (16).
Water level of the lake between 1915 and 1987 (29).
- Water temperature [deg C](18)
| Depth [m] | 1980 | 1981 | ||||||||||
|---|---|---|---|---|---|---|---|---|---|---|---|---|
| Nov | Dec | Jan | Feb | Mar | Apr | May | Jun | Jul | Aug | Sep | Oct | |
| 0 | 3.5 | - | 0.4 | 0.1 | 0.1 | 3.4 | 7.0 | 15.7 | 18.0 | 25.6 | 17.9 | 10.3 |
| 1 | 3.5 | - | 0.6 | 0.4 | 0.6 | 3.4 | 7.0 | 15.8 | 17.9 | 25.2 | 17.9 | 10.3 |
| 2 | 3.5 | - | 0.8 | 1.2 | 1.0 | 3.0 | 7.0 | 15.8 | 17.9 | 25.2 | 17.8 | 10.3 |
| 3 | 3.5 | - | 1.0 | 2.5 | 1.5 | 2.9 | 7.0 | 15.8 | 17.9 | 24.5 | 17.7 | 10.3 |
| 4 | 3.5 | - | 1.4 | 3.1 | 2.3 | 2.6 | 7.0 | 15.8 | 17.9 | 22.7 | 17.5 | 10.2 |
| 5 | 3.5 | - | 2.9 | 3.4 | 2.9 | 2.6 | 7.0 | 15.8 | 17.9 | 21.8 | 16.7 | 10.2 |
| 6 | 3.5 | - | 3.2 | 3.5 | 3.8 | 2.6 | 7.0 | 15.8 | 17.9 | 21.4 | 16.5 | 10.2 |
| 7 | 3.5 | - | 3.3 | 3.5 | 3.9 | 2.7 | 7.0 | 15.8 | 17.9 | 20.6 | 16.4 | 10.2 |
Temperature profile [deg C] for 1981, at Wabamun West (top) and Moonlight Bay (bottom)(1, 18).
- Freezing period: 1 November-26 April.
- Mixing type: Polymictic.
- Notes on water mixing and thermocline formation
Usually the lake does not stratify. On rare occasions in midsummer. When a thermocline forms, it may last only a few days. Normally, the lake is mixed to its bottom during summer (cold polymictic).
E. LAKE WATER QUALITY
E1 TRANSPARENCY [m](18)
| May | Jun | Jul | Aug | Sep | Oct |
|---|---|---|---|---|---|
| 3.5 | 3.0 | 2.1 | 1.8 | 2.5 | 3.3 |
E2 pH (18)
| Depth [m] | Jan | Feb | Mar | Apr | May | Jun | Jul | Aug | Sep | Oct |
|---|---|---|---|---|---|---|---|---|---|---|
| 0 | - | - | - | - | 8.5 | 8.1 | 8.6 | 8.9 | 8.8 | 8.4 |
| 1 | 8.2 | - | - | - | 8.5 | 8.2 | 8.5 | 8.9 | 8.8 | 8.3 |
| 2 | 8.3 | - | - | - | 8.5 | 8.2 | 8.5 | 8.9 | 8.8 | 8.5 |
| 3 | 8.4 | - | - | - | 8.5 | 8.2 | 8.5 | 8.9 | 8.8 | 8.6 |
| 4 | 8.4 | - | - | - | 8.6 | 8.2 | 8.5 | 8.9 | 8.8 | 8.6 |
| 5 | 8.3 | - | - | - | 8.6 | 8.2 | 8.4 | 8.9 | 8.8 | 8.7 |
| 6 | 8.2 | - | - | - | 8.5 | 8.2 | 8.3 | 8.9 | 8.7 | 8.7 |
| 7 | 7.4 | - | - | - | 8.5 | 8.2 | 8.3 | 8.8 | 8.5 | 8.7 |
E3 SS [mg l-1](18)
| Depth [m] | May | Jun | Jul | Aug | Sep | Oct |
|---|---|---|---|---|---|---|
| E* | 2.0 | 3.0 | 3.0 | 5.0 | 5.0 | 3.0 |
E4 DO [mg l-1](18)
| Depth [m] | 1980 | 1981 | ||||||||||
| Nov | Dec | Jan | Feb | Mar | Apr | May | Jun | Jul | Aug | Sep | Oct | |
| 0 | 12.4 | - | 12.4 | 12.8 | 12.9 | 9.05 | 10.5 | 8.5 | 9.3 | 8.0 | 11.2 | 8.2 |
| 1 | 12.3 | - | 12.7 | 12.7 | 12.2 | 9.05 | 10.5 | 8.6 | 9.3 | 8.1 | 11.3 | 8.2 |
| 2 | 12.2 | - | 12.5 | 12.1 | 11.2 | 9.10 | 10.6 | 8.6 | 9.5 | 8.2 | 11.3 | 8.3 |
| 3 | 11.8 | - | 12.5 | 11.4 | 10.2 | 9.18 | 10.6 | 8.6 | 9.6 | 8.1 | 11.2 | 8.2 |
| 4 | 11.6 | 12.4 | 11.5 | 10.0 | 9.19 | 10.8 | 8.6 | 9.7 | 8.2 | 10.8 | 8.2 | |
| 5 | 11.6 | - | 11.4 | 11.0 | 8.0 | 9.21 | 10.8 | 8.6 | 9.8 | 8.2 | 9.2 | 8.2 |
| 6 | 11.5 | - | 10.9 | 10.7 | 4.6 | 9.21 | 10.8 | 8.6 | 9.9 | 7.9 | 8.5 | 8.2 |
| 7 | 11.4 | - | 3.1 | 3.2 | 0.5 | 9.19 | 10.8 | 8.6 | 9.8 | 2.7 | 7.8 | 8.2 |
| 8 | 10.6 | - | - | - | - | 8.55 | 10.6 | - | 9.8 | - | - | - |
Dissolved oxygen profile [mg l-1], 1981 (1, 18). Wabamun West on top, Moonlight Bay on bottom.
E6 CHLOROPHYLL CONCENTRATION [micro l-1](18)
| Depth [m] | May | Jun | Jul | Aug | Sep | Oct |
|---|---|---|---|---|---|---|
| E* | 4.4 | 6.2 | 15.8 | 19.6 | 19.4 | 14.2 |
E7 NITROGEN CONCENTRATION (18)
- Total-N [mg l-1]
| Depth [m] | May | Jun | Jul | Aug | Sep | Oct |
|---|---|---|---|---|---|---|
| E* | 0.837 | 0.738 | 0.975 | 1.021 | 1.008 | 0.984 |
E8 PHOSPHORUS CONCENTRATION
- Total-P [mg l-1](18)
| Depth [m] | May | Jun | Jul | Aug | Sep | Oct |
|---|---|---|---|---|---|---|
| E* | 0.036 | 0.028 | 0.038 | 0.036 | 0.045 | 0.035 |
Major ions and related water quality variables. Average concentrations in mg l-1 except as noted for composite samples from the euphotic zone collected 19 times during the ice-free period from May 1983 to October 1985. S.E.=standard error.
| Mean | S.E. | |
|---|---|---|
| pH range | 7.6-9.1 | - |
| Total alkalinity (as CaCO3) | 1931 | 1 |
| Specific conductivity (micro S cm-1) | 417 | 2 |
| Total dissolved solids | 235 | 1 |
| Total hardness (as CaCO3) | 111 | 1 |
| Total particulate carbon | 2 | 0.17 |
| Dissolved organic carbon | 11 | 0.1 |
| HCO3 | 220 | 2 |
| CO3 | 8 | 0.78 |
| Mg | 12 | 0.2 |
| Na | 46 | 0.4 |
| K | 8 | 0.08 |
| Cl | 3 | 0.16 |
| SO4 | 26 | 0.55 |
| Ca | 24 | 0.43 |
| 1981 | 1983 | |||
|---|---|---|---|---|
| Mean | S.E. | Mean | S.E. | |
| Total phosphorus | 34.2 | 1.65 | 30.4 | 1.5 |
| Total dissolved phosphorus | 11.3 | 1.06 | 9.8 | 0.46 |
| Soluble reactive phosphorus | 3.5 | 0.57 | 2.7 | 0.42 |
| Total Kjeldahl nitrogen | 1,040 | 48 | 767 | 37 |
| NO3 + NO2 nitrogen | 4.2 | 0.56 | 5.4 | 3.3 |
| NH4 nitrogen | 76 | 23 | 17.3 | 4.7 |
| Iron | <20 | - | <20 | - |
| Chlorophyll a | 12.6 | 1.36 | 10.4 | 1.8 |
| Secchi depth [m] | 1.9 | 0.14 | 2.3 | 0.34 |
Total phosphorus, chlorophyll a for Wabamun West (top) and Moonlight Bay (bottom), 1981 (1, 18).
E10 PAST TRENDS (1, 18)
| E. | |||
| Year | Sample no. | Chlorophyll a | Total-P |
|---|---|---|---|
| 1980 | 6 | 13.0 2.6 | 29.8 2.4 |
| 1981 | 7 | 12.6 1.5 | 33.0 1.5 |
| 1982 | 4 | 11.1 3.8 | 30.0 3.0 |
| 1983 | 3 | 12.4 2.7 | 30.5 2.7 |
| 1984 | 3 | 13.5 1.9 | 32.9 2.6 |
| 1985 | 3 | 11.5 1.6 | - - |
| 1986 | 4 | 10.6 2.3 | 32.8 1.8 |
| 1987 | 3 | 14.3 3.5 | 36.3 0.9 |
- Supplementary notes
The water quality of L. Wabamun has been studied off and on since 1968. Investigations included the effects of the thermal discharges from the two power plants (20, 21,22,23); the iron chemistry (24); and ground-water (25). Additional reports and studies are listed in a comprehensive literature review (5). Studies by Alberta Environment on the limnology of the lake and its nutrient sources began in 1980 (12) and have been on-going (18, 19).
F. BIOLOGICAL FEATURES
F1 FLORA
- Emerged macrophytes
- Floating macrophytes
- Submerged macrophytes
- Phytoplankton
Typha latifolia, Sagittaria cuneata, Polygonum coccineum, Scirpus spp.
Lemna minor, Nuphar variegatum, Potamogeton natans.
Chara globularis, Ceratophyllum demersum, Ranunculus circinatus, Myriophyllum exalbescens, Potamogeton pectinatus, P. praelongus, P. richardsonii, P. vaginatus, P. filiformis, Elodea canadensis.
The first plant survey in 1961 (30) documented species similar to those in the lake today, with the exception of Elodea canadensis which was not seen in the lake in 1961. It became dominant by 1970 as a result of thermal discharges from the powerplant. For further studies on Elodea see (20) and (31).
Anabaena flos-aquae, A. spp., Lyngbya birgei, Gloeotrichia echinulata, Stephanodiscus niagarae.
Diatoms are usually dominant in spring and fall with blue-greens dominant in July and August. In 1987, large populations of Lyngbya birgei, Gloeotrichia echinulata and Anabaena flos-aquae developed in July. probably due to favorable climatic conditions. The diatom, Stephanodiscus niagarae, also attained a large biomass by the end of June 1985 and this continued through middle September.
F2 FAUNA (1, 13, 18, 32, 34, 35, 36, 37)
- Zooplankton (18)
- Benthos
- Fish
Cladocera (Bosmina longirostris, Chydorus sphaericus, Daphnia galeata mendotae, D. retrocurva, Ceriodaphnia lacustris, C. reticulata, Eurycercus lamellatus, Simocephalus serrulatus, Diaphanosoma leuchtenbergianum, Acroperus harpae, Leptodora kindtii, Alona costata); Rotifera (Keratella "cochlearis", K. qyadrata, Kellicottia longispina, Filinia terminalis, F. longiseta, Asplanchna sp., Synchaeta sp., Conochilus natans, C. unicornis, Polyarthra vulgaris, P. euryptera, Notholca acuminata, Ploesoma hudsoni, P. truncatum); Copepoda (Skistodiaptomus oregonensis, Leptodiaptomus sicilis, Diacyclops edax, Acanthocyclops vernalis, Eucyclops agilis, E. speratus, Trichocerca multicrinis, T. cylindrica, Brachionus patulus, B. angularis, Monostyla sp., Lecane luna). Based on vertical haul samples from the euphotic zone, 1980- 1982.
Chironomus spp., Polypedilium spp., Cladotanytarsus spp., Tanytarsus spp.
Coregonus clupeaformis* (lake whitefish), Esox lucius (northern pike), Perca flavescens (yellow perch), Catastomus commersoni (white sucker), Culaea inconstans (stickleback), Notropis hudsonius (spottail shiner), Etheostoma exile (Iowa darter).
* Economically important.
F4 BIOMASS (1, 18)
- Phytoplankton* [mg l-1]
Composite samples collected from the euphotic zone.
| Percentage
composition |
5/3 | 5/31 | 6/28 | 7/27 | 8/24 | 9/20 | 10/17 |
|---|---|---|---|---|---|---|---|
| Cyanophyta | 0 | 13 | 18 | 44 | 54 | 6 | 18.5 |
| Chlorophyta | 16 | 23 | 15 | 14 | 11 | 1 | 4 |
| Chrysophyta | 24 | 33 | 2 | 4 | 0 | 0 | 0.5 |
| Bacillariophyta | 43 | 28 | 47 | 30 | 13 | 88 | 72 |
| Cryptophyta | 17 | 1 | 7.5 | 5 | 17 | 3 | 5 |
| Pyrrhophyta | 0 | 2 | 10.5 | 3 | 5 | 2 | 0 |
| Total biomass | 2.15 | 0.272 | 2.24 | 5.37 | 7.21 | 11.9 | 3.04 |
F5 FISHERY PRODUCTS
- Annual fish catch [metric tons](38)
- Fishery products other than fish: None.
1982-1988 Northern pike: 25.
Lake white fish: 135.
F6 PAST TRENDS (13, 28)
- Estimated angler-hours, effort and harvest of lake whitefish
| Year | Period | Total angler-hours | Total no. of fish caught | Catch rate |
|---|---|---|---|---|
| 1982-83 | Nov-Apr | 364,817 | 192,054 | 0.53 |
| 1983 | Mar-Apr | 157,349 | 115,608 | 0.61 |
| 1984 | Mar | 31,348 | 15,204 | 0.48 |
| 1986 | Jan-Apr | 85,304 | 32,314 | 0.38 |
| 1986 | Mar | 33,734 | 16,530 | 0.49 |
F7 NOTES ON THE REMARKABLE CHANGES OF BIOTA IN THE LAKE IN RECENT YEARS
- No remarkable changes noted for the period 1980-1988.
G. SOCIO-ECONOMIC CONDITIONS
G1 LAND USE IN THE CATCHMENT AREA (41)
| Area [km2] | [%] | |
|---|---|---|
| Natural landscape | ||
| - Swamp and wetlands | 7 | 3 |
| - Others | 104 | 40 |
| Agricultural land | 136 | 52 |
| Residential area | 5 | 2 |
| Others* | 7 | 3 |
| Total | 259 | 100 |
- Main types of woody vegetation (main species)
- Main kinds of crops and/or cropping systems
- Levels of fertilizer application on crop fields: Light.
- Trends of change in land use in recent years
Trembling aspen (Populus tremuloides), balsam poplar (P. balsamifera), willow, white spruce, white birch.
Hay, barley, forage oats, cattle production.
Conversion to coal mines from agricultural land, bush or forest.
G2 INDUSTRIES IN THE CATCHMENT AREA AND THE LAKE (42)
| Gross product per year (= US$1.00) | No. of persons engaged | No. of establishments | Main products or major industries | |
|---|---|---|---|---|
| Secondary industry | ||||
| - Others | 400 million | 330 | 2 | Power generation |
H. LAKE UTILIZATION
H1 LAKE UTILIZATION (Q)
- Source of water, sightseeing and tourism (no. of visitors to Wabamun
Lake Provincial Park in 1987-88: 145,300 (33)), recreation (swimming, sport-
fishing, yachting) and fisheries.
H2 THE LAKE AS WATER RESOURCE (42)
| Use rate | ||
|---|---|---|
| Domestic | 25,000 | [US gallons day-1] |
| Industrial | 135,000*1 | [US gallons day-1] |
| Others | ||
| - Power plant | 356*2 | [mill. m3 yr-1] |
I. DETERIORATION OF LAKE ENVIRONMENTS AND HAZARDS
I1 ENHANCED SILTATION
- Extent of damage: Not serious.
I2 TOXIC CONTAMINATION
- Present status: None.
I3 EUTROPHICATION
- Nuisance caused by eutrophication
- Nitrogen and phosphorus loadings to the lake (1)
Unusual algal bloom Very rare (took place in 1987); dominant species were Lyngbya birgei, Gloeotrichia echinulata and Anabaena flos-aquae.
Measured Total-P loadings, averages [kg yr-1](12)
| Sources | P-load |
|---|---|
| Streams | 2,030 |
| Diffuse runoff | 1,210 |
| Ash lagoon effluent | 743 |
| Atmospheric precipitation | 1,882 |
| Sewage | 75 |
| Sediment release | 8,000 |
| Groundwater | 260 |
| Total | 14,200 |
- Supplementary notes
L. Wabamun is classified as a eutrophic lake according to OECD criteria based on maximum chlorophyll a concentrations.
I4 ACIDIFICATION
- Extent of damage: None.
J. WASTEWATER TREATMENTS
J1 GENERATION OF POLLUTANTS IN THE CATCHMENT AREA
- (c) Some discharge of pollution load into the lake.
J2 APPROXIMATE PERCENTAGE DISTRIBUTION OF POLLUTANT LOADS
| [%] | |
|---|---|
| Non-point sources agricultural, natural and dispersed settlements) 95 | |
| Point sources | |
| - Municipal | <1 |
| - Industrial | 5 |
J3 SANITARY FACILITIES AND SEWERAGE
- Percentage of municipal population in the catchment area provided with
- Percentage of rural population with adequate sanitary facilities (on-site
- Municipal wastewater treatment systems
- Industrial wastewater treatment systems
adequate sanitary facilities (on-site treatment systems) or public sewerage: 100%.
treatment systems): 90%.
No. of tertiary treatment systems: 0.
No. of secondary treatment systems: 2.
No. of industrial wastewater treatment systems: 2 (one discharge out of the catchment, the other treated via lagoon system).
K. IMPROVEMENT WORKS IN THE LAKE
K3 OTHERS (42)
- Macrophyte harvest: 366 acres; average 282 ton yr-1 (1975-1988).
M. LEGISLATIVE AND INSTITUTIONAL MEASURES FOR UPGRADING LAKE ENVIRONMENTS
M1 NATIONAL AND LOCAL LAWS CONCERNED
- Names of the laws (the year of legislation)
- Clean Water Act
- Clean Air Act
- Public Health Act
- Responsible authorities
- Alberta Ministry of the Environment
- Alberta Ministry of the Environment
- Regional Health Units
- Main items of control
- Industrial and municipal discharges
- Industrial discharges
M2 INSTITUTIONAL MEASURES (year of establishment)
- Alberta Ministry of the Environment, Edmonton (1970)(monitoring of lakes and pollution control)
M3 RESEARCH INSTITUTES ENGAGED IN THE LAKE ENVIRONMENT STUDIES
- University of Alberta, Department of Zoology, Edmonton, Alberta
N. SOURCES OF DATA
- Questionnaire filled by Dr. P. Mitchell, Alberta Environmental Protection Services, Environmental Assessment Division, Environmental Quality Monitoring Branch, Edmonton, Alberta.
- Canada Department of Energy, Mines and Resources, Surveys and Mapping Branch. National Topographic Series 1:50,000 83G/7, 9, 10 (1975) 83G/8 (1974).
- Reid, Crowther & Partners Ltd. (1973) Lake Wabamun Study. Prepared for Alberta Environment. 156 pp.
- Habgood, H. (1983) Lake Wabamun literature review. Prepared for the Lake Wabamun Watershed Advisory Committee and published by Alberta Environment.
- Alberta Environment, Technical Services Division, Hydrology Branch. Unpublished data.
- Lindsay, J. D., Odynsky, W., Peters, J. W. & Bowser, W. E. (1968) Soil survey of the Buck Lake (NE 83B) and Wabamun Lake (E 1/2 83G) areas. Alta Soil Surv. Rep.24, Univ. Alta Bul. SS-7, Alta Res. Council Rep. 87. Edmonton.
- Alberta Research Council, Natural Resources Division, Alberta Geological Survey (1972) Geological Map of Alberta. Edmonton.
- Strong, W. L. & Leggat, K. R. (1981) Ecoregions of Alberta. Alberta Energy Natural Resources, Resource Evaluation Planning Division, Edmonton.
- Environment Canada, Atmospheric Environment Service (1982) Canadian Climate Normals, Volume 7, Bright Sunshine 1951-1980.
- Ivan, M., Administrator of Village of Wabamun. Personal communication.
- Mitchell, P. A. (1985) Preservation of Water Quality in Lake Wabamun. Alberta Environment, Pollution Control Division, Water Quality Control Branch, Edmonton.
- R. L. & L. Environmental Services Ltd. (1987) County of Parkland Fisheries Inventory: Lake Wabamun. Prepared for Alberta Recreation, Parks and Wildlife, Fish and Wildlife Division, Edmonton.
- Haag, R. W. & Gorham, P. R. (1979) Community Dynamics of Submerged Macrophytes in Lake Wabamun, Alberta. Summary Report to Alberta Environment.
- Hamilton, H. & Reynoldson, T. B. (1981) Lake Wabamun Eutrophication Study. Interim Report on 1980 Lake Sediment Studies. Alberta Environment Pollution Control Division, Edmonton.
- Alberta Environment, Technical Services Division, Survey Branch.
- Alberta Environment (1985) Climate of Alberta. Data compiled by Environment Canada, Atmospheric Environment Service.
- Alberta Environment, Environmental Assessment Division, Environmental Quality Monitoring Branch. Unpublished data.
- Mitchell, P. A. (1984) The importance of sediment release in the assessment of a shallow eutrophic lake for phosphorus control. Proceedings of the Third Annual Conference on Lake and Reservoir Management. North American Lake Management Society. U.S. E. P. A.440/5- 84-001. Washington, D. C. 129 pp.
- Beak Consultants Ltd. (1980) The Effects of Thermal Discharges on the Aquatic Plants and Other Biota of Wabamun Lake, Alberta. Prepared for Calgary Power Ltd., Calgary.
- Gallup, D. N. & Hickman, M. (1973) Temperature and oxygen distribution in the mixing zone of a thermal discharge to Lake Wabamun, Alberta. Proceedings of a Symposium of Lakes in Western Canada, Water Resources Centre, University of Alberta, Edmonton, pp. 285-303.
- Gallup, D. N. & Hickman, M. (1975) Effects of the discharge of thermal effluent from a power station on Lake Wabamun, Alberta, Canada- limnological features. Hydrobiol., 46: 45-69.
- Nursall, J. R., Nuttall, J. B. & Fritz, P. (1972) The effect of thermal effluent in Lake Wabamun, Alberta. Verh. Int. Ver. Limnol., 18: 269-277.
- Schwartz, F. & Gallup, D. N. (1978) Some factors controlling the major ion chemistry of small lakes: examples from the prairie-parkland of Canada. Hydrobiol., 58: 65-81.
- Crowe, A. & Schwartz, F. W. (1982) The Groundwater Component of the Wahamun Lake Eutrophication Study. Alberta Environment, Water Quality Control Branch, Edmonton.
- Anderson, R. S. Unpublished data. Alberta Environment, Pollution Control Division, Water Quality Control Branch, Edmonton.
- Reynolds, C. S. (1980) Phytoplankton assemblages and their periodicity in stratifying lake systems. Holarctic Ecology 3: 141-159.
- Alberta Forestry, Lands and Wildlife, Fish and Wildlife Division. Unpublished data.
- Environment Canada (1915-1987) Surface water data prepared by Inland Waters Directorate, Water Survey Canada, Water Resources Branch, Ottawa.
- Dobson, H. & Stanley, B. (1961) Aquatic plants in Wabamun Lake. Report to Calgary Power Ltd. Unpublished data.
- Allen, E. & Gorham, P. (1973) Changes in the submerged macrophyte communities of Lake Wabamun as a result of thermal discharge. Proceedings of a Symposium of Lakes in Western Canada, Water Resources Centre, University of Alberta, Edmonton.
- Rasmussen, J. B. (1979) The macroinvertebrate fauna and thermal regime of Lake Wabamun, a lake receiving thermal effluent. M. Sc. Thesis, University of Alberta, Edmonton.
- Alberta Recreation and Parks (1988) Unpublished data.
- Miller, R. B. & Paetz, M. J. (1952) Report on Lake Wabamun, October 1952. Alberta Forestry, Lands and Wildlife, Fish and Wildlife Division, Edmonton.
- Ash, G. (1974) The effects of heated water discharge upon lake whitefish (Coregonus clupeaformis)[Mitchell] in Wabamun Lake, Alberta. Proceedings of the 10th Symposium (1975), Water Pollution Research in Canada: 9-16.
- Mackay, W. C., Department of Zoology, University of Alberta, Edmonton. Personal communication.
- Berry, D., Alberta Forestry, Lands and Wildlife, Fish and Wildlife Division. Personal communication.
- Watson, M., Fish and Wildlife Division, Alberta Forestry, Lands and Wildlife, Edmonton. Personal communication.
- Berry, K. B. (1986) Wabamun Lake Sport Fishery Results of Creel Surveys and Sportsfishing Monitoring from 1982 to 1984. Alberta Energy and Natural Resources, Fish and Wildlife Division. Unpublished manuscript.
- Ash, G. & Hildebrand, L. (1986) Winter Creel Survey of Wabamun Lake, Alberta (1 January to 9 April, 1986). Report prepared by R. L. L. Environmental Services for Alberta Forestry Lands and Wildlife and the Recreation Parks and Wildlife Foundation. Edmonton, Alberta.
- Mitchell, P., Hamilton, H., Livingstone, H., Rippon, B. & Prosser, D.
- Mulligan, F. Plant Manager, Wabamun Thermal Plant, TransAlta Utilities, Wabamun. Personal communication.
(l) Mitchell, P. (in press) Wabamun Lake. "Atlas of Alberta Lakes" (ed.
Mitchell, P. & Prepas, E. E.). University of Alberta Press, Edmonton.
(1981) Lake Wabamun Eutrophication Study Interim Report. Water Quality Control Branch, Alberta Environment, Edmonton.
- Alberta Forestry, Lands and Wildlife, Fish and Wildlife Division (1988) Boating in Alberta. Edmonton.
- Alberta Forestry, Lands and Wildlife, Fish and Wildlife Division (1988) Guide to Sportfishing Regulations. Edmonton.
- Alberta Recreation, Parks and Wildlife, Fish and Wildlife Division (1976) Commercial Fisheries Catch Statistics for Alberta, 1942-1975. Fish.
Manage. Rep. 22. Edmonton.
