
LAKE SIMCOE
Ice fishing huts on the lake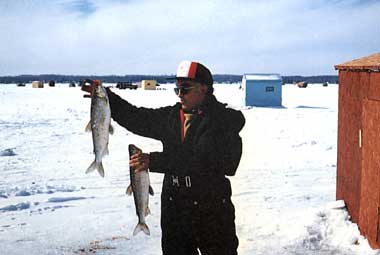
Photo: J.Overton, K.Nicholls, M.Dickman and M.Foy
A. LOCATION
- South Central Ontario, Canada.
- 44:5-44:5N, 79:0-79:0W; 220 m above sea level.
B. DESCRIPTION
Lake Simcoe is southern Ontario's largest body of water excluding the Great Lakes. It serves as an important recreational resource for cottagers, anglers, campers and boaters. The population of the lake's basin was approximately 190,000 people in 1985. During the summer, there is an influx of 40,000 to 50,000 cottagers who occupy the 12,000 cottages surrounding the lake. Seventy percent of these cottagers rent or own boats and 35 marinas provide a moorage for the larger boats and yachts that can then access the Trent-Severn Canal System waterway which connects Lake Simcoe to Georgian Bay (via the Talbot River), Lake Huron, Lake Ontario and the Rideau Canal System which allows boats to reach the nation's capital and from there, the Ottawa River and the St. Lawrence.Lake Simcoe's shoreline is composed of 55% cobble, 35% sand and 10% organic muck. The lake is located within the eastern portion of the Simcoe Lowlands where well-drained till soils predominate. Along the northern and western shores of the lake, the lowland consists of a narrow bouldery terrace confined by a low bluff. The southern and eastern shores are characterized by poorly drained sandy loams and large organic deposits located along the major river courses.
The lake's basin is drained by 35 tributary inflows with 5 major rivers draining approximately 60% of the watershed area. Annual mean discharges for the major river systems range from 2 to 4 m3 s-1. Peak flows range from 20 to 60 m3 s-1 and usually occur during the spring melt period.
The 1980 survey of Ontario sport anglers indicated that Lake Simcoe received more fishing effort than any other Ontario inland lake. During the winters of 1980-1983, 400,000 to 500,000 angler-hours were spent on the lake during each winter and 2,000 to 3,000 ice fishing huts were rented during each year. Lake Simcoe's proximity to major urban centres in the Oshawa-Toronto-Hamilton corridor is primarily responsible for the intense sport fishery that exists on the lake, which is located about 50 km from Toronto and is within an hour's drive for over half the population of Ontario.
Water
quality in the lake has been affected by an excessive supply of phosphorus
which has stimulated an over-growth of aquatic weeds and algae in certain
parts of the lake. This results in critically low dissolved oxygen levels
in deep portions of the lake which in turn has been linked to a decline
in whitefish and lake trout populations within the lake. Beginning in 1975,
lake shore municipalities. Ontario ministries and conservation authorities
responsible for Lake Simcoe began working together to study the lake and
in 1979 they published the Lake Simcoe-Couchiching Basin Environmental
Strategy which evaluated measures designed to reduce phosphorus inputs
to the lake. This strategy also established baselines for physical, chemical
and biological data, some of which are described below. Considerable reductions
in point source phosphorus loading have been achieved in recent years.
Present-day inputs (1989) may be near acceptable levels (2, 3, 4, 5, 7,
8).
C. PHYSICAL DIMENSIONS (5, 9)
| Surface area [km2] | 725 |
| Volume [km3] | 11.6 |
| Maximum depth [m] | 41 |
| Mean depth [m] | 15 |
| Water level | Regulated |
| Normal range of annual water level fluctuation [m] | 0.4 |
| Residence time [yr] | 16 |
| Catchment area [km2] | 2,840 |
D. PHYSIOGRAPHIC FEATURES
D1 GEOGRAPHICAL
- Bathymetric map: Fig. NAM-42-01.
- Names of main islands: Georgina, Thorah, Snake, and Fox (1).
- Number of outflowing rivers and channels (name)
- Others
1 (Atherly Narrows, mean flux 37.1 m3 s-1)(5).
Number of inflowing rivers and channels (name) 3 (Talbot R., 4.35 m3 s-1), (Holland R., 3.9 m3 s-1) and (Pefferlaw Brook, 3.78 m3 s-1)(5).
D2 CLIMATIC
- Climatic data at Orillia, 1989 (6)
| Jan | Feb | Mar | Apr | May | Jun | Jul | Aug | Sep | Oct | Nov | Dec | Ann. | |
|---|---|---|---|---|---|---|---|---|---|---|---|---|---|
| Mean temp. [deg C] | -9.3 | -12 | -2.8 | 4.6 | 13 | 16.2 | 20.4 | 19.2 | 14.6 | 7.4 | 2.3 | -5.9 | 5.6 |
| Precipitation [mm] | 89 | 63 | 59 | 64 | 70 | 79 | 83 | 82 | 82 | 85 | 82 | 95 | 932 |
- Number of hours of bright sunshine (Toronto): 2,045 hr yr-1.
- Solar radiation (Toronto)[MJ m-2 day-1](6)
| Jan | Feb | Mar | Apr | May | Jun | Jul | Aug | Sep | Oct | Nov | Dec | Ann. |
|---|---|---|---|---|---|---|---|---|---|---|---|---|
| 5.2 | 8.2 | 12.1 | 16.1 | 19.8 | 22 | 22 | 18.7 | 14 | 9.2 | 4.8 | 3.9 | 13 |
Fig. NAM-42-01
Bathymetric map (Q).

- Water temperature [deg C]
| Depth [m] | Jan | Feb | Mar | Apr | May | Jun | Jul | Aug | Sep | Oct | Nov | Dec |
|---|---|---|---|---|---|---|---|---|---|---|---|---|
| 0 | - | - | - | - | 4.8 | 14.8 | 17.2 | 22.2 | 13.7 | 12.0 | - | - |
| 5 | - | - | - | - | 4.8 | 14.5 | 17.3 | 22.2 | 14.5 | 12.0 | - | - |
| 10 | - | - | - | - | 4.8 | 12.1 | 15.6 | 22.2 | 15.1 | 12.0 | - | - |
| 15 | - | - | - | - | 4.8 | 9.3 | 13.9 | 15.1 | 15.2 | 12.0 | - | - |
| 20 | - | - | - | - | 4.8 | 7.7 | 8.5 | 9.9 | 10.4 | 12.0 | - | - |
| 25 | - | - | - | - | 4.8 | 7.6 | 8.2 | 8.2 | 7.5 | 12.0 | - | - |
| 30 | - | - | - | - | 4.7 | 7.6 | 8.0 | 8.1 | 6.7 | 12.0 | - | - |
Fig. NAM-42-02
Water temperature at one meter above the lake bottom at 3 stations
in Lake Simcoe (2).

- Freezing period: December-March.
- Mixing type: Dimictic.
- Supplementary note
A very gradually sloping thermocline forms between 13 and 20 m each summer and remains there from June to September.
E. LAKE WATER QUALITY
E1 TRANSPARENCY [m]
- Mean Secchi depth at the open water location station K45 was 4.4 m
for 1981- 1985. That for the same period in Cook Bay was 2.9 m (2)
| 1981 | 1982 | 1983 | 1984 | 1985 | Average |
|---|---|---|---|---|---|
| 4.5 | 4.4 | 3.9 | 4.5 | 4.8 | 4.4 |
E2 pH (2)
| Depth [m] | 1981 | 1982 | Average |
|---|---|---|---|
| 0 | 8.3 | 8.45 | 8.38 |
| 30 | - | 8.0 | 8.0 |
E3 SS [mg l-1]*(2)
| Depth [m] | 1982 | 1983 | 1984 | 1985 | Average |
|---|---|---|---|---|---|
| 0 | 329.4 | 318.0 | 334.6 | 335.1 | 329.6 |
| 30 | 345.8 | 331.7 | 346.2 | 344.7 | 342.1 |
E4 DO [mg l-1](2)
| Depth [m] | Jan | Feb | Mar | Apr | May | Jun | Jul | Aug | Sep | Oct | Nov | Dec |
|---|---|---|---|---|---|---|---|---|---|---|---|---|
| 0 | - | - | - | 12.0 | 12.0 | 9.6 | 8.1 | 7.9 | 8.8 | 9.2 | - | - |
| 5 | - | - | - | 12.0 | 12.0 | 9.6 | 7.6 | 7.8 | 8.8 | 9.2 | - | - |
| 10 | - | - | - | 11.9 | 12.1 | 9.4 | 6.9 | 7.8 | 8.6 | 9.2 | - | - |
| 15 | - | - | - | 11.8 | 12.2 | 9.6 | 6.7 | 5.6 | 8.4 | 9.2 | - | - |
| 20 | - | - | - | 11.8 | 12.1 | 9.9 | 5.9 | 3.9 | 6.6 | 9.2 | - | - |
| 25 | - | - | - | 11.8 | 11.9 | 8.9 | 4.9 | 3.7 | 1.4 | 9.2 | - | - |
| 30 | - | - | - | 11.8 | 11.8 | 8.8 | 2.4 | 3.7 | 0.9 | 8.9 | - | - |
Fig. NAM-42-03
Dissolved oxygen, transparency [m] and temperature profile [deg C]
at Station K45, 1980 (11, 12).

E6 CHLOROPHYLL CONCENTRATION [mg l-1](2)
| 1981 | 1982 | 1983 | 1984 | 1985 | Average |
|---|---|---|---|---|---|
| 2.1 | 1.6 | 1.6 | 2.2 | 2.6 | 2.02 |
E7 NITROGEN CONCENTRATION
- NO2-N, NO3-N, NH4-N and Total Kjeldahl-N [mg l-1]
| Depth [m] | NO2 | NO3 | NH4 | TKN | ||||
|---|---|---|---|---|---|---|---|---|
| 0 | 30 | 0 | 30 | 0 | 30 | 0 | 30 | |
| 1982 | 0.005 | 0.015 | 0.045 | 0.135 | 0.039 | 0.015 | 0.39 | 0.40 |
| 1983 | 0.002 | 0.007 | 0.009 | 0.072 | 0.021 | 0.005 | 0.40 | 0.36 |
| 1984 | 0.002 | 0.003 | 0.041 | 0.082 | 0.074 | 0.012 | 0.62 | 0.37 |
| 1985 | 0.002 | 0.007 | 0.028 | 0.113 | 0.069 | 0.075 | 0.51 | 0.48 |
| Average | 0.003 | 0.008 | 0.031 | 0.101 | 0.051 | 0.027 | 0.46 | 0.40 |
Fig. NAM-42-04
Inorganic nitrogen concentrations measured 1 m above the bottom.

E8 PHOSPHORUS CONCENTRATION
- PO4-P and Total-P [mg l-1]
| Depth [m] | PO4 | Total unfiltered P | ||
|---|---|---|---|---|
| 0 | 30 | 0 | 30 | |
| 1982 | 0.003 | 0.009 | 0.012 | 0.031 |
| 1983 | 0.003 | 0.007 | 0.021 | 0.030 |
| 1984 | 0.002 | 0.010 | 0.017 | 0.023 |
| 1985 | 0.002 | 0.008 | 0.020 | 0.025 |
| Average | 0.0027 | 0.009 | 0.017 | 0.027 |
Fig. NAM-42-05
Euphotic zone total phosphorus concentrations at stations C1, CS and
C9 in Cook Bay and in the Holland River, 1980 (11).

E10 PAST TRENDS
- The levels of dissolved oxygen in the deeper basins of the lake began
falling in the 1960's and improvements were noted in the 1980's following
the implementation of phosphorus abatement strategies (12).
F. BIOLOGICAL FEATURES
- 1971-1979
F1 FLORA (9)
- Emerged macrophytes: Typha latifolia, Typha angustifolia, Scirpus spp.
- Floating macrophytes: Lemna minor, Wolffia sp.
- Submerged macrophytes
- Phytoplankton
- Benthic algae: Cladophora, Dichtomosiphon tuberosus, Chara.
Potamogeton pectinatus, Elodea canadensis, Myriophyllum spicatum.
Ceratium hirundinella, Stephanodiscus hantzschia, S. astreaea, Melosira granulata, M. ambigua, and Cryptomonas spp. are the dominant taxa at most stations in Lake Simcoe. During late summer, Anabaena flos-aquae forms dense surface blooms reaching densities of 0.06 mm3 l-1 in Cook Bay which is the most eutrophic part of the lake (2). Dinobryon, Mallomonas, Scenedesmus, Pediastrum, Aphanizomenon, Coelosphaerium, Lyngbya, Oscillatoria, Euglena, Trachelomonas and Phacus never reached more than 5% of the total annual (May- October) algal biomass (11).
- Fig. NAM-42-06
Seasonal distribution of phytoplankton density for the 7 most abundant classes at stations K45 and E51, 1980 (2).

F2 FAUNA
- Zooplankton
- Benthos
- Fish (8)
The rotifers were not abundant. Surface tows in the fall (October) of 1982 revealed Karatella cochlearis, K. quadrata, Syncheata, sp., Brachionus spp.
and Polyarthra. sp. (15). The common copepods were Senecella calanoides, Epischura lacustris and Diaptomus sicilis (calanoid copepods); Cyclops bicuspidatus thomasi and Mesocyclops edax (cyclopoid copepods); and Daphnia galeata mendotae and Bosmina coregoni coregoni (dadocerans)(15).
Micropsectra sp., Phanopsectra sp. (chironomids); Pisidium conventus and P.
casertanum (clams).
Lake trout* (Salvelinus namaycush), Large mouth bass* (Micropterus salmoides), small mouth bass* (Micropterus dolomieui), northern pike (Esox lusius), whitefish (Coregonus clupeaformis), white sucker (Catosomus commersoni), American smelt (Osmerus mordax) walleye or yellow pickerel (Stizostedion vitreum), ling or burbot (Lota lota), rock bass (Ambloplites rupestris), yellow perch (Perca flavescens).
* Economically important.
F4 BIOMASS (11)
- Phytoplankton [mm3 l-1]
| 30 Apr | 20 May | 12 Jun | 1 Jul | 12 Aug | 23 Sep | 14 Oct |
|---|---|---|---|---|---|---|
| 0.23 | 0.42 | 0.79 | 0.38 | 0.25 | 0.57 | 0.38 |
F7 NOTES ON THE REMARKABLE CHANGES OF BIOTA IN THE LAKE IN RECENT YEARS (8)
- Whitefish populations are decreasing and there is some year-class inferred
evidence that the whitefish population is not reproducing.
G. SOCIO-ECONOMIC CONDITIONS
G1 LAND USE IN THE CATCHMENT AREA (15)
| Area [km2] | [%] | |
|---|---|---|
| Natural landscape | - | 37 |
| - Woody vegetation | 158 | |
| Agricultural land | - | 61 |
| - Crop field | 984 | |
| - Pasture land | 214 | |
| Others | - | 2 |
| Total | 1,356 | 100 |
- Types of important forest: Red pine.
- Main kinds of crops
- Levels of fertilizer application on crop fields: Moderate.
- Trends of changes in land use in recent years (16)
Hay, corn, small grains (wheat, oat, barley and rye) and row crops as onion and carrot.
Housing developments have increased most rapidly with agricultural developments next.
G2 INDUSTRIES IN THE CATCHMENT AREA AND THE LAKE (16)
| Gross product during the year (Canadian $=US$) | No. of establishments | Main products or major industries | |
|---|---|---|---|
| Primary industry | |||
| - Crop production | 127,000,000 | 2,500 | Vegetables, grain, milk, cheese, beef and poultry |
| - Animal husbandry | |||
| - Fisheries* | 20,000,000 | Whitefish | |
| - Others | Sport fishery* | ||
- Numbers of domestic animals in the catchment area
Cattle 63,000, sheep 11,500, swine 62,000, poultry 910,000, milk cows 20,000, horses 4,800.
G3 POPULATION IN THE CATCHMENT AREA (16)
| Population | Population density [km-2] | Major cities (population) | |
|---|---|---|---|
| Urban | 87,095*1 | 1,371 | Barrie Newmarket |
| Rural | 132,905 | 47 | |
| Total | 220,000*2 | 76*3 |
*2 This figure does not include the 50,000 seasonal residents of the cottages in the catchment area.
*3 This figure would increase to 93òÓ5 km-2 if seasonal residents were included.
H. LAKE UTILIZATION
H1 LAKE UTILIZATION (2)
- Source of water, sightseeing and tourism (no. of visitors in 1985:
50,000), recreation (swimming, sport-fishing and yachting) and fisheries.
H2 THE LAKE AS WATER RESOURCE
| Use rate* [1,000 m3 day-1] | |
|---|---|
| Domestic | |
| - Brock Township | 7.27 |
| - Mara Township | 4.0 |
| - Georgia Township | 4.56 |
I. DETERIORATION OF LAKE ENVIRONMENTS AND HAZARDS
I1 ENHANCED SILTATION
- Extent of damage: Serious.
I2 TOXIC CONTAMINATION
- Present status: Detected but not serious.
Mercury levels in L. Simcoe fish by species and size (from "Guide to Eating Ontario Sport Fish," 1978).
| Species | Fish size [cm] | |||||||||
|---|---|---|---|---|---|---|---|---|---|---|
| 15 | 15-20 | 20-25 | 25-30 | 30-36 | 36-46 | 46-56 | 56-66 | 66-76 | 76 | |
| Large mouth bass | - | A | A | A | A | A | B | - | - | - |
| Small mouth bass | - | A | A | A | A | B | B | - | - | - |
| Yellow perch | A | A | A | A | A | - | - | - | - | - |
| Northern pike | - | - | - | A | A | A | A | A | A | A |
| Walleye | - | - | - | A | A | A | B | B | C | D |
| Lake trout | - | - | - | - | A | A | A | A | A | B |
| White sucker | - | - | - | - | A | A | A | - | - | - |
| Whitefish | - | - | - | A | A | A | A | - | - | - |
| Rock bass | - | A | A | A | A | - | - | - | - | - |
| Ling | - | - | - | - | - | - | - | A | B | B |
- A: <0.5
B: 0.5-1.0
C: 1.0-1.5
D: >1.5
-: projections not made for this size class.
Spatial distribution of mercury in the surface sediments of the lake.

- Past trends (11)
Mercury concentration in fish collected in the lake.
| Species | Year | No. of fish | Hg concentration [ppm] | Length of fish [cm] | ||||
|---|---|---|---|---|---|---|---|---|
| Mean | Min. | Max. | Mean | Min. | Max. | |||
| Walleye (Pickerel) | 1970 | 22 | 0.27 | 0.07 | 0.96 | 51.9 | 30.7 | 75.2 |
| 1971 | 12 | 0.55 | 0.18 | 2.04 | 53.5 | 30.0 | 71.6 | |
| 1975 | 15 | 0.73 | 0.15 | 1.28 | 60.7 | 48.0 | 74.0 | |
| 1976 | 50 | 0.98 | 0.18 | 1.70 | 66.2 | 36.6 | 80.1 | |
| 1977 | 27 | 0.60 | 0.10 | 1.60 | 53.8 | 29.0 | 75.0 | |
| Lake trout | 1970 | 20 | 0.39 | 0.16 | 0.58 | 72.5 | 54.1 | 82.8 |
| 1975 | 16 | 0.24 | 0.13 | 0.39 | 62.3 | 55.0 | 71.0 | |
| 1976 | 12 | 0.35 | 0.18 | 0.56 | 69.9 | 57.2 | 85.3 | |
| 1977 | 20 | 0.48 | 0.20 | 0.93 | 66.6 | 49.5 | 87.0 | |
| Whitefish | 1915*1 | 6 | 2.4*2 | 1.4*2 | 4.9*2 | 38.0 | 35.4 | 44.5 |
| 1928*1 | 6 | 0.08 | 0.06 | 0.11 | 39.9 | 36.8 | 42.3 | |
| 1952*1 | 10 | 0.06 | 0.05 | 0.09 | 19.3 | 17.5 | 23.3 | |
| 1970 | 11 | 0.06 | 0.04 | 0.08 | 44.3 | 35.6 | 49.0 | |
| 1971 | 12 | 0.04 | 0.03 | 0.07 | 43.8 | 40.4 | 47.7 | |
| 1975 | 13 | 0.03 | 0.02 | 0.05 | 46.9 | 44.0 | 51.0 | |
| 1977 | 20 | 0.03 | 0.01 | 0.07 | 52.2 | 50.8 | 54.5 | |
| Large mouth bass | 1971 | 12 | 0.25 | 0.14 | 0.50 | 30.8 | 19.3 | 42.2 |
| Small mouth bass | 1970 | 24 | 0.48 | 0.17 | 1.44 | 32.1 | 22.6 | 41.4 |
| 1971 | 12 | 0.27 | 0.13 | 0.82 | 31.1 | 19.3 | 48.3 | |
| 1975 | 10 | 0.13 | 0.09 | 0.18 | 29.1 | 19.0 | 34.5 | |
| 1977 | 30 | 0.25 | 0.06 | 0.93 | 29.3 | 19.4 | 43.5 | |
| Cisco | 1928*1 | 8 | 0.16 | 0.11 | 0.21 | 25.3 | 20.7 | 29.2 |
| 1952*1 | 9 | 0.16 | 0.13 | 0.19 | 20.0 | 18.3 | 21.3 | |
| 1969*1 | 15 | 0.14 | 0.09 | 0.19 | 26.0 | 23.0 | 29.1 | |
| 1970 | 9 | 0.06 | 0.05 | 0.08 | 23.2 | 22.5 | 24.5 | |
| 1977 | 26 | 0.13 | 0.09 | 0.17 | 32.8 | 26.8 | 40.3 | |
| Rainbow smelt | 1970 | 10 | 0.08 | 0.05 | 0.11 | 20.9 | 16.8 | 24.9 |
| Emerald shiner | 1971 | 4 | 0.08 | 0.06 | 0.11 | 7.6 | 5.1 | 10.0 |
| Rock bass | 1952*1 | 3 | 0.20 | 0.18 | 0.24 | 22.2 | 21.7 | 22.7 |
| 1970 | 12 | 0.14 | 0.10 | 0.24 | 17.4 | 13.5 | 21.3 | |
| 1975 | 10 | 0.16 | 0.08 | 0.25 | 21.5 | 17.0 | 25.0 | |
| Yellow perch | 1952*1 | 4 | 0.12 | 0.10 | 0.13 | 14.5 | 13.4 | 15.5 |
| 1967*1 | 4 | 0.29 | 0.19 | 0.36 | 17.5 | 15.8 | 21.1 | |
| 1970 | 15 | 0.17 | 0.10 | 0.27 | 25.6 | 20.1 | 32.5 | |
| 1971 | 12 | 0.30 | 0.15 | 0.80 | 25.8 | 20.6 | 31.8 | |
| 1975 | 12 | 0.21 | 0.06 | 0.49 | 23.8 | 14.0 | 30.0 | |
| 1977 | 22 | 0.23 | 0.07 | 0.42 | 24.7 | 12.0 | 31.0 | |
| Northern pike | 1967*1 | 2 | 0.13 | 0.12 | 0.14 | 43.4 | - | - |
| 1971 | 12 | 0.19 | 0.12 | 0.44 | 69.8 | 54.9 | 96.5 | |
| 1975 | 3 | 0.16 | 0.05 | 0.31 | 63.0 | 43.0 | 86.0 | |
| 1977 | 22 | 0.20 | 0.07 | 0.47 | 67.4 | 51.2 105.0 | ||
| Ling (burbot) | 1970 | 10 | 0.39 | 0.14 | 0.55 | 69.8 | 33.0 | 81.3 |
| 1975 | 5 | 0.53 | 0.45 | 0.65 | 76.8 | 70.O | 86.0 | |
| 1977 | 15 | 0.44 | 0.15 | 0.98 | 59.4 | 43.7 | 79.0 | |
| White sucker | 1952 | 4 | 0.04 | 0.03 | 0.05 | 30.6 | 23.8 | 35.9 |
| 1970 | 12 | 0.17 | 0.09 | 0.23 | 43.0 | 38.4 | 46.5 | |
| 1971 | 12 | 0.09 | 0.05 | 0.14 | 41.4 | 35.0 | 48.0 | |
| 1975 | 6 | 0.14 | 0.07 | 0.19 | 43.5 | 39.0 | 46.0 | |
*2 Mercury contamination of preserving fluid suspected.
I3 EUTROPHICATION
- Nuisance caused by eutrophication (8)
- Supplementary notes (15)
Unusual algal bloom In 1971 a surface bloom of Anabaena flos-aquae was observed for the first time. This continued in the late summer and early fall of subsequent years. In 1983, the two main sewage sources were diverted from Lake Simcoe and it is believed that this will reduce by half, the algal biomass by 1990.
Cladophora is the dominant on-shore alga on the cobblestone beach just east of the Orilla sewage treatment plant. Cladophora reaches its highest densities in June, July and August at a depth of 0.5-1.0 m.
On August 1,1970, federal regulations reduced the phosphorus content as P2O5 in laundry detergents from approximately 50% to 20%. Additional regulations which were proclaimed by the federal government of Canada on January 1, 1973 further decreased the phosphorus content to 5%.
I4 ACIDIFICATION
- Extent of damage: None.
J. WASTEWATER TREATMENTS
J1 GENERATION OF POLLUTANTS IN THE CATCHMENT AREA
- (d) Measurable discharge of pollution load into the lake with limited
wastewater treatment.
J3 SANITARY FACILITIES AND SEWERAGE (19)
- Municipal wastewater treatment systems
No. of secondary treatment systems: 1 (conventional method with phosphorus removal).
No. of other types: 1 (conventional lagoon with seasonal phosphorus removal).
K. IMPROVEMENT WORKS IN THE LAKE
K1 RESTORATION
- Sewage diversion began in 1983
K2 AERATION (10)
- Aeration studies in the deep basins have been considered.
L. DEVELOPMENT PLANS
- The number of marinas and housing developments continue to expand.
M. LEGISLATIVE AND INSTITUTIONAL MEASURES FOR UPGRADING LAKE ENVIRONMENTS
M1 NATIONAL AND LOCAL LAWS CONCERNED
- Names of the laws (the year of legislation)
- Canada Fisheries Act
- Canada Navigable Waters Protection Act
- Canada Water Act
- Canada Environmental Contaminants Act
- Responsible authorities
- Ontario Ministry of the Environment (0. M. E.)
- Ontario Ministry of Natural Resources (O. M. N. R.)
- Environment Canada) Main items of control
- Main items of control
- Municipal and industrial discharges of wastes and waste waters
- Consumption withdrawal
- Sport and commercial fishery
- Habitat protection and water related resources
M2 INSTITUTIONAL MEASURES
- Environment Ontario, Central Region, and Aquatic Biology and River Systems Sections
- Lake Simcoe Region Conservation Authority
- Ontario Ministry of Natural Resources- Central Region
- Ministry of Tourism and Recreation, Ontario
M3 RESEARCH INSTITUTES ENGAGED IN THE LAKE ENVIRONMENT STUDIES
- Fisheries Research Section, Fisheries Branch, Ontario Ministry of Natural Resources
- Water Resources Branch, Ontario Ministry of the Environment
N. SOURCES OF DATA
- Questionnaire filled by Drs. K. Nicholls, J. Overton (Aquatic Biology Section, Ontario Ministry of the Environment), M. Foy (Water Quality Branch, O. M. E.) and M. Dickman (Biological Sciences Department, Brock University).
- Surveys and Mapping Branch, Department of Mines and Technical Services, 1:50,000 scale maps. Government of Canada.
- MOE (1985) Lake Simcoe Environmental Management Strategy (OMAF, OMOE and OMNR); Final report and recommendations of the steering committee. Suite 700, 150 Ferrand Dr. Don Mills, Ont. M3C 3C3.
- Garlaw, J. & Trumbly, B. (Central Region, Parks Canada) Trent-Severn Waterways Recreational Boating (705-742 9267).
- MOE (1979) The Lake Simcoe-Couching Basin Environmental Strategy.
- McCurry, P. Water Levels and Monthly Stream Flow. Water Survey of Canada (519-821 0110).
- Environment Canada. Canadian Climate Normals, 1951-1980. Atmospheric Environment Service.
- Humber, J. (1985) Lake Simcoe Environmental Management Strategy, Water Quality Characteristics of Lake Simcoe (1980-1984). Technical report #B.1. Suite 700, 150 Ferrand Dr. Don Mills, Ont. M3C 3C3.
- MOE (1979) Lake Simcoe-Couching Basin Environmental Strategy. Suite 700, 150 Ferrand Dr. Don Mills, Ont. M3C 3C3.
- MOE (1975) Lake Simcoe Basin: A Water Quality and Use Study. Ontario Ministry of the Environment. Suite 700, 150 Ferrand Dr. Don Mills, Ont.
- Lake Simcoe Conservation Authority (1987) To Determine the Predictability of Hypolimnetic Dissolved Oxygen Depletion in Lake Simcoe as Related to Water Temperature, Nutrient Loading and Other Limnological Variables. Report prepared by W. J. Snodgrass and J. Holubeshen of Beak Consultants Ltd.
- MOE (1982) Water Quality Characteristics of Lake Simcoe 1980. Ontario Ministry of the Environment, Suite 700, 150 Ferrand Dr. Don Mills, Ont.
- Wilson, J. P. (1987) The use of statistical models to document environmental change in the Lake Simcoe Basin. Ph. D Thesis, University of Toronto, Dept. of Geography.
- Lake Simcoe Environmental Management Strategy Reports. A (Land sub- group) 5 reports and B (Lake sub-group) 4 reports.
- 0. M. E. (1978) Mercury in the Lake Simcoe Aquatic Environment. Water Resources. Planning Unit, Planning and Co-ordination Section, Water Resources Branch.
- Dickman, M. (1982) Limnology class (Biol. 363) survey of the macrophytes and zooplankton of Lake Simcoe. (unpublished data).
- Michalski, M. F. P., Johnson, M. G. & Veal, D. M. (1973) Muskoka Lakes Water Quality Evaluation: 0. M. E. Report No. 3, Eutrophication of the Muskoka Lakes. Brock University Library DOC, CA2, On, EV, M74, No. 3.
- Ontario Ministry of Natural Resources (1978) Guide to Eating Ontario Sport Fish.
- Rawson, D. F. (1930) The Bottom Fauna of Lake Simcoe and Its Role in the Ecology of the Lake. Univ. of Toronto Studies. Publication No. 40 of the Ontario Fisheries Research Laboratory. 183 pp. and 5 plates.
- Ontario Ministry of the Environment (1981) Municipal Water and Wastewater Works in Ontario.
- Evans, D. O., Houston, J. J. & Meredith, G. N. (1988) Status of the Lake Simcoe whitefish, Coregonus clupeaformis, in Canada. Canadian Field Naturalist, 102: 103-113.
- MacCrimmon, H. R. & Skoke, E. (1970) The Fisheries of Lake Simcoe. Ontario Department of Lands and Forests. Toronto, Ontario. 140 pp.
- Johnson, M. G. & Nicholls, K. H. (1988) Temporal and spatial trends in metal loads to sediments of Lake Simcoe, Ontario. Water, Air and Soil Pollution, 39: 337-354.
M3C 3C3.
M3C 3C3.
