
KEZAR LAKE
An aerial view of the whole lake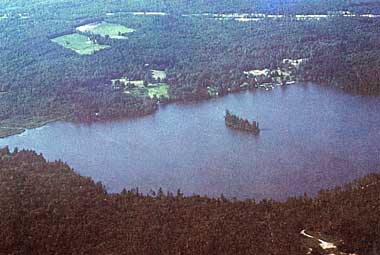
Photo: W. Howard
A. LOCATION
New Hampshire, USA.43:2 N, 71:6 W; 276.2 m above sea level.
B. DESCRIPTION
Prior to the early 1960's, Kezar Lake was an attractive and popular recreational area. The fact that Kezar Lake was chosen as the site of Wadleigh State Park in 1934 reflects the aesthetic value the lake once enjoyed.As a result of the construction of the New London Waste Water Treatment Plant in 1931, water quality deteriorated in Kezar Lake. Secondary effluent from the treatment plant contributed high concentrations of phosphorus to Lion Brook, much of which became entrapped in the sediment and biomass of Kezar Lake. As a result of this phosphorus input, massive blooms of obnoxious blue- green algae began in 1961 and deteriorated the water quality in the lake.
Remedial attempt to improve the recreational quality of Kezar Lake has been undertaken by the New Hampshire Water Supply and Pollution Control Commission. The use of copper sulfate as an algicide, as an acceptable method which was utilized with considerable success for several years, was the first attempt to improve the aesthetic lake conditions. Although this method does not reverse the eutrophication trends, it temporarily alleviates nuisance algal blooms and provides an acceptable recreational season.
In 1968, the New Hampshire Water Supply and Pollution Control Commission attempted a new method to remedy the poor aesthetic conditions of the lake. This new approach was to completely mix the lake by releasing compressed air from the deep spot of the lake. Mixing of large bodies of water was shown to alter the ecology in some way which may affect algal growth. Although destratification of Kezar Lake by mixing was initially considered a success, the procedure was abandoned in 1974, when water clarity again declined, marking the end to the effectiveness of destratification.
In 1970, tertiary treatment for phosphorus removal was added to the New London Treatment Plant, resulting in an appreciable decrease of phosphorus input to Lion Brook. In January of 1981, effluent from the plant was diverted outside the watershed to the Sunapee Wastewater Plant.
In 1981, biologists from the New Hampshire Water Supply and Pollution Control Commission began an exhaustive three-year study of Kezar Lake to identify the lake's hydrologic and nutrient budgets. As a result of these budgets, biologists were able to recommend various lake restorative techniques to limit the phytoplankton's main source of food, phosphorus (Q).
C. PHYSICAL DIMENSIONS (1)
| Surface area [km2] | 1 |
| Volume [km3] | 0.002 |
| Maximum depth [m] | 8.2 |
| Mean depth [m] | 2.8 |
| Water level | Regulated |
| Normal range of annual water | |
| level fluctuation [m] | 0.3 |
| Length of shoreline [km] | 3.4 |
| Residence time [yr] | 0.1 |
| Catchment area [km2] | 28 |
D. PHYSIOGRAPHIC FEATURES
D1 GEOGRAPHICALBathymetric map: Fig. NAM-40-01.
Names of main islands: Loon.
Number of outflowing rivers and channels (name): 1 (Lane Brook).
D2 CLIMATIC
Climatic data at Concord
Mean temp. [deg C]*1
| Jan | Feb | Mar | Apr | May | Jun | Jul | Aug | Sep | Oct | Nov | Dec | Ann. |
|---|---|---|---|---|---|---|---|---|---|---|---|---|
| -9.3 | -4.7 | 0 | 6.9 | 13.8 | 17.3 | 21.1 | 19.3 | 14.9 | 7.7 | 3.5 | -4.1 | 7.2 |
| Jan | Feb | Mar | Apr | May | Jun | Jul | Aug | Sep | Oct | Nov | Dec | Ann. |
|---|---|---|---|---|---|---|---|---|---|---|---|---|
| 102 | 74 | 64 | 79 | 48 | 198 | 71 | 64 | 117 | 165 | 89 | 107 | 1,176 |
*2 September 1981-August 1982.
Solar radiation: 32.5 MJ m-2 day-1.
- Possible sunshine [% yr-1]
| 1979 | 1980 | 1981 | 1982 |
|---|---|---|---|
| 53 | 59 | 58 | 58 |
Bathymetric map (Q).
Water temperature [deg C](1)
September 1980-Augsut 1982
[m]
| Depth | Jan | Feb | Mar | Apr | May | Jun | Jul | Aug | Sep | Oct | Nov | Dec |
|---|---|---|---|---|---|---|---|---|---|---|---|---|
| S*1 | - | - | - | 7.0 | 18.5 | 19.0 | 27.2 | 22.5 | 19.3 | 10.8 | 5.6 | 0.8 |
| 1 | - | - | - | 7.0 | 17.6 | 19.0 | 27.1 | 22.2 | 19.3 | 9.0 | 5.6 | 0.8 |
| 2 | - | - | - | 7.0 | 17.1 | 18.9 | 27.1 | 21.5 | 19.3 | 8.5 | 5.6 | - |
| 3 | - | - | - | 7.0 | 16.4 | 19.5 | 20.9 | 21.3 | 19.1 | 8.3 | 5.6 | - |
| 4 | - | - | - | 7.0 | 15.2 | 17.0 | 18.1 | 20.8 | 19.0 | 8.0 | 5.6 | 1.0 |
| 5 | - | - | - | 7.0 | 14.3 | 14.0 | 16.7 | 17.7 | 18.8 | 8.0 | 5.6 | - |
| 6 | - | - | - | 7.0 | 12.8 | 12.8 | 14.7 | 13.9 | 18.0 | 8.0 | 5.6 | - |
| B*2 | - | - | - | 7.0 | 10.5 | 11.5 | 13.0 | 13.7 | 15.0 | 7.5 | 5.6 | - |
Freezing period: December-March.
Mixing type: Dimictic.
E. LAKE WATER QUALITY
E1 TRANSPARENCY [m](1)September 1981-August 1982
[m]
| Jan | Feb | Mar | Apr | May | Jun | Jul | Aug | Sep | Oct | Nov | Dec |
|---|---|---|---|---|---|---|---|---|---|---|---|
| - | - | - | 2.6 | 2.5 | 1.8 | 1.2 | 1.5 | 2.0 | 1.8 | 2.0 | 2.0 |
September 1981-August 1982
[m]
| Depth | Jan | Feb | Mar | Apr | May | Jun | Jul | Aug | Sep | Oct | Nov | Dec |
|---|---|---|---|---|---|---|---|---|---|---|---|---|
| 2 | 6.0 | 6.0 | 6.2 | 6.2 | 6.0 | 6.7 | 8.4 | 6.7 | 6.6 | 6.9 | 6.6 | 6.4 |
| 4 | 6.2 | 5.9 | 5.9 | 6.2 | 5.9 | 6.6 | 6.4 | 6.7 | 6.7 | 6.8 | 6.7 | 6.4 |
| 6 | 6.0 | 5.9 | 6.1 | 6.2 | 6.1 | 6.2 | 6.4 | 6.4 | 6.5 | 6.7 | 5.9 | 6.5 |
| 7.5 | 6.0 | 5.9 | 6.1 | 6.3 | 6.4 | 6.8 | 6.4 | 6.2 | 6.3 | 6.6 | 6.6 | 6.4 |
| Inlet | - | - | - | 6.2 | 6.9 | 6.6 | 6.3 | 6.3 | - | - | - | - |
September 1981-August 1982
[m]
| Depth | Jan< | Feb | Mar | Apr | May | Jun | Jul | Aug | Sep | Oct | Nov | Dec |
|---|---|---|---|---|---|---|---|---|---|---|---|---|
| 2 | 0.85 | 0.40 | 0.73 | 2.1 | 2.9 | 3.7 | 6.6 | 4.0 | 2.7 | 3.4 | 4.5 | 3.3 |
| 4 | 1.5 | 1.1 | 2.2 | 2.3 | 3.4 | 4.2 | 6.9 | 5.5 | 4.7 | 3.5 | 2.5 | 2.6 |
| 6 | 2.6 | 1.3 | 2.0 | 2.2 | 4.4 | 6.0 | 11.0 | 18.0 | 2.9 | 3.9 | 2.8 | 3.9 |
| 7.5 | 4.6 | 1.1 | 6.3 | 2.9 | 5.9 | 16.0 | 9.2 | 16.0 | 4.1 | 4.2 | 2.9 | 2.8 |
| Inlet | - | - | - | 1.0 | 2.1 | 4.1 | 15.9 | 5.5 | - | - | - | - |
September 1981-August 1982
[m]
| Depth | Jan | Feb | Mar | Apr | May | Jun | Jul | Aug | Sep | Oct | Nov | Dec |
|---|---|---|---|---|---|---|---|---|---|---|---|---|
| S*1 | - | - | - | 2.4 | 10.8 | 10.2 | 8.5 | 10.4 | 8.5 | 11.6 | 13.3 | 14.8 |
| 1 | - | - | - | 2.4 | 10.4 | 10.0 | 8.5 | 10.6 | 8.5 | 11.8 | 13.5 | 14.8 |
| 2 | - | - | - | 2.4 | 10.2 | 10.0 | 8.5 | 10.2 | 8.5 | 11.6 | 13.5 | 14.8 |
| 3 | - | - | - | 2.4 | 10.0 | 9.8 | 5.5 | 9.9 | 8.4 | 11.6 | 13.5 | - |
| 4 | - | - | - | 2.4 | 9.2 | 8.0 | 0.1 | 8.8 | 8.3 | 11.2 | 13.4 | - |
| 5 | - | - | - | 2.4 | 8.8 | 3.3 | 0.1 | 0.4 | 7.3 | 11.1 | 13.4 | - |
| 6 | - | - | - | 2.4 | 8.8 | 1.4 | 0.1 | 0.3 | 1.2 | 11.2 | 13.4 | - |
| B*2 | - | - | - | 2.4 | 1.3 | 0.4 | 0.5 | 0.5 | 0.8 | 11.2 | 13.4 | - |
| Depth | Jan | Feb | Mar | Apr | May | Jun | Jul | Aug | Sep | Oct | Nov | Dec |
|---|---|---|---|---|---|---|---|---|---|---|---|---|
| S* | 3.01 | 1.95 | 1.71 | 3.54 | 7.24 | 9.14 | 14.02 | 14.07 | 13.08 | 17.31 | 12.90 | 11.42 |
E7 NITROGEN CONCENTRATION (1)
Total Kjeldahl-N [mg l-1]
November 1981-August 1982
[m]
| Depth | Jan | Feb | Mar | Apr | May | Jun | Jul | Aug | Sep | Oct | Nov | Dec |
|---|---|---|---|---|---|---|---|---|---|---|---|---|
| 2 | .42 | .29 | .34 | .39 | .56 | .63 | .73 | .29 | - | - | .46 | .34 |
| 4 | .56 | .45 | .35 | .37 | .24 | .63 | .68 | .67 | - | - | .50 | .34 |
| 6 | .72 | .48 | .41 | .39 | .60 | .44 | .94 | 1.0 | - | - | .40 | .40 |
| 7.5 | .66 | .33 | .51 | .39 | <2.0 | .94 | .72 | 1.58 | - | - | .46 | .29 |
| Inlet | - | - | - | .40 | .57 | .70 | .81 | .50 | - | - | - | - |
Total-P [micro g l-1]
September 1981-August 1982
[m]
| Depth | Jan | Feb | Mar | Apr | May | Jun | Jul | Aug | Sep | Oct | Nov | Dec |
|---|---|---|---|---|---|---|---|---|---|---|---|---|
| 2 | 13 | 18 | 14 | 15 | 22 | 23 | 11 | 15 | 25 | 26 | 21 | 22 |
| 4 | 16 | 19 | 15 | 15 | 19 | 25 | 24 | 26 | 27 | 33 | 20 | 21 |
| 6 | 23 | 26 | 21 | 16 | 30 | 34 | 33 | 22 | 24 | 38 | 26 | 33 |
| 7.5 | 30 | 32 | 31 | 17 | 52 | 50 | 27 | 43 | 46 | 61 | 28 | 20 |
| Inlet | - | - | - | 12 | 65 | - | 111 | 33 | - | - | - | - |
September 1981-August 1982
[m]
| Depth | Jan | Feb | Mar | Apr | May | Jun | Jul | Aug | Sep | Oct | Nov | Dec |
|---|---|---|---|---|---|---|---|---|---|---|---|---|
| 2 | 30 | 23 | 26 | - | 20 | 19 | 19 | 23 | 22 | - | - | 29 |
| 4 | 27 | 21 | 26 | - | 18 | 20 | 19 | 23 | 22 | - | - | 20 |
| 6 | 30 | 21 | 26 | - | 20 | 25 | 18 | 22 | 22 | - | - | 27 |
| 7.5 | 30 | 44 | 33 | - | 23 | 19 | 18 | 22 | 22 | - | - | 27 |
| Inlet | - | - | - | - | 25 | 23 | 32 | 37 | - | - | - | - |
Past trend of transparency.
Past trend of summer mean transparency.
Past trend of pH.
Past trend of chlorophyll a concentration.
Past trend of Total-P concentration (summer 2 m).
Past trend of Total-P concentration (summer 6 m).
Historical data of mean Total-P concentration.
F. BIOLOGICAL FEATURES
F1 FLORA (l)1979
Emerged macrophytes: Pontederia cordata, Typha, Myrica gale, Juncus.
Floating macrophytes: Nuphar, Nymphaea, Brasenia schreberi.
Submerged macrophytes: No submerged plants apparent at time of survey.
F2 FAUNA
1982
Zooplankton (l)
Keratella, Polyarthra, Kellicottia, Synchaeta, Bosmina, Daphnia, Calanoid copepods, Codonella.
Benthos (2)
Chaoborus larvae, Sialidae, Megaloptera, Chironomidae, Diptera, Oligochaeta, Annelida.
Fish (3, 4)
Micropterus dolomieui, M. lectalurus, Notemigonus crysoleucas, Esox niger, Perca flavescens, Anguilla rostrata, Catostomus commersoni, Lepomis gibbosus, Cyprinidae.
Distribution of aquatic plants, June 25, 1979 (1).
F6 PAST TREND: Fig. NAM-40-10.
Phytoplankton density for whole water column (3).
G. SOCIO-ECONOMIC CONDITIONS (1)
G1 LAND USE IN THE CATCHMENT AREA1983
| Area [km2] | [%] | |
|---|---|---|
| Natural land scape | ||
| Forest/abandoned field | 19.9 | 77.1 |
| Wetland | 0.95 | 3.7 |
| Agricultural land | 1.1 | 4.3 |
| Rural residential | 1.8 | 7.0 |
| Urban | 0.64 | 2.5 |
| Others* | 1.4 | 5.5 |
| Total | 25.9 | 100 |
1987
| Population | Major cities | ||
|---|---|---|---|
| Population | density [km-2] | (population) | |
| Rural | 3,440 | None | |
| Total | 3,440 | 123.3 |
H. LAKE UTILIZATION
H1 LAKE UTILIZATIONSightseeing and recreation (swimming, sport-fishing, yachting).
I. DETERIORATION OF LAKE ENVIRONMENTS AND HAZARDS (Q)
I1 ENHANCED SILTATIONExtent of damage: Serious.
I2 TOXIC CONTAMINATION
Present status: None.
I3 EUTROPHICATION
Nuisance caused by eutrophication
Unusual algal bloom (Microcystis, Anabaena, Aphanizomenon, Lyngbya) and fish kill from endotoxins.
Nitrogen and phosphorus loading to the lake [kg yr-1](Q)
| Sources | T-P |
|---|---|
| Tributaries | 260.7 |
| Direct runoff | 36.3 |
| Atmospheric | 39.6 |
| Groundwater | 7.3 |
| Septic leachate | 12.5 |
| Subtotal | 356.4 |
| Net sediment uptake (-) -123.6 | |
| Total net influx | 232.8 |
| Total outflux | |
| through outlet | 234.1 |
(1) 1981-1982: Monthly T-P load from rivers.
I4 ACIDIFICATIoN
Extent of damage: Detected but not serious.
J. WASTEWATER TREATMENTS (Q)
J1 GENERATION OF POLLUTANTS IN THE CATCHMENT AREA- e) Severe pollution with limited wastewater treatment.
| [%] | |
|---|---|
| River discharge | 72.0 |
| Direct runoff | 10.1 |
| Atmospheric | 12.2 |
| Groundwater | 1.9 |
| Septic leachate | 3.9 |
M. LEGISLATIVE AND INSTITUTIONAL MEASURES FOR UPGRADING LAKE ENVIRONMENTS (Q)
M1 NATIONAL AND LOCAL LAWS CONCERNEDMain items of control
- l) Algae & other aquatic nuisances
- Exotic weeds
- Illegal dumping & other violations
- New Hampshire Department of Environmental Services, Water Supply and Pollution Control Division, Biology Bureau
N. SOURCES OF DATA
- Questionnaire filled by Dr. W. Howard, Program Manager, U.S. Environmental Protection Agency Region I, Boston, Massachusetts, USA
- Connor, J. N. (1983) Kezar Lake Diagnostic and Feasibility Study. N. H. Water Supply & Pollution Control Commission, Staff Report No. 135.
- Connor, J. N. & Michael, R. M. (1985) An evaluation of Aluminium Salts Injection and Wetlands Management at Kezar Lake, North Sutton, New Hampshire. New Hampshire Water Supply & Pollution Control Commission, Staff Report No. 142.
- Connor, J. N. (1989) An Assessment of Wetlands Management and Sediment Phosphorus Inactivation, Kezar Lake, New Hampshire. Water Supply and Pollution Control Division, NH Department of Environmental Services, Staff Report No. 161.
- Newell, A. E. (1977) Biological Survey of the Lakes and Ponds in Sullivan, Merrimack, Belknap and Stratford Counties. State of New Hampshire Fish and Game Department, Report No. 86, p. 135.
- Scarola, J. F. (1973) Freshwater Fishes of New Hampshire. New Hampshire Fish and Game Department, Devision of Inland & Marine Fisheries.
