
WEBSTER LAKE
Routine sampling at the designated station in winter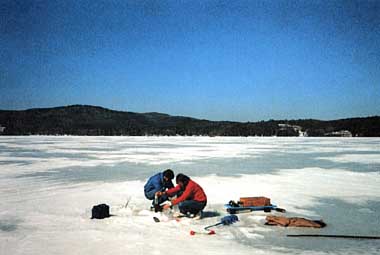
Photo: Dufresne-Hnery Inc.
A. LOCATION
New Hampshire, USA. 43:8N, 71:1W; 122.2 m above sea level.B. DESCRIPTION
The Webster Lake Watershed spans two municipals in the south-central portion of the Lakes Region of New Hampshire. The total watershed consists of approximately 11,432 acres, contains two major lakes, numerous small ponds and an extensive system of tributaries. The majority of the watershed - 8,363 acres (73.2% of the total basin) - is in the eastern portion of the town of Andover, New Hampshire. The watershed can be considered typical of the Lakes Region in New Hampshire. Vast forested areas and agricultural corn fields are broken only by scattered single-family dwellings which parallel existing road networks, with dwelling concentrations around typical "village" layouts.The watershed is dominated by Highland Lake in Andover, and Webster Lake in Franklin. The two lakes are connected by Sucker Brook, the largest of the many tributaries within the watershed. Webster Lake (612 acres) is the larger of the two lakes, being 1.6 miles in length by 1.0 mile wide.
Presently, approximately 90% of the 4.3 miles of shoreline is developed. The lake is subject to extensive recreational use. The lake, at an elevation of 401 feet above sea level, has an average depth of 19 feet, a maximum depth of 45 feet, and has two public beaches and one public launch.
A priority list developed by the Department of Environmental Services' Biology Bureau has rated Webster Lake as high for both restoration and preservation. The lake is located within 25 miles of the Capitol City of Concord and is also within 25 miles of the City of Laconia.
An earlier Water Quality Management Investigation of Wabster Lake in 1980, revealed that Sucker Brook, the main tributary to Webster Lake accounted for approximately 67% of the total water input to the lake, drains about 80% of the entire watershed area and is responsible for approximately 63% of the phosphorus loading to the lake during a normalized year.
The trophic classification of Webster Lake was determined to be mesotrophic, based on data collected and a comparison with the trophic classification System for New Hampshire Lakes and Ponds. These guidelines were formulated to classify New Hampshire lakes and ponds for the federal "Clean Lakes" program. A total of six points were awarded to Webster Lake based on this rating system. This ranked Webster Lake as number 24 on the priority list for restoration.
An on-site inspection of the Webster Lake watershed revealed several agricultural areas which were in close proximity to Sucker Brook or had feeder streams flowing into Sucker Brook as possible sources of nutrient loads.
Many of the recommendations suggested in the Water Quality Management Investigation of Webster Lake deal with stricter ordinances around the lake and best management practices. The report calls for proper agricultural management implementation at individual farms sites (1).
C. PHYSICAL DIMENSIONS (1)
| Surface area [km2] | 3 |
| Volume [km3] | 0.1405 |
| Maximum depth [m] | 13.7 |
| Mean depth [m] | 5.7 |
| Water level | Regulated |
| Normal range of annual water | |
| level fluctuation [m] | 6.0 |
| Length of shoreline [km] | 6.9 |
| Residence time [yr] | 0.6 |
| Catchment area [km2] | 43 |
D. PHYSIOGRAPHIC FEATURES
D1 GEOGRAPHICALBathymetric map: Fig. NAM-39-01.
Names of main islands: None.
Number of outflowing rivers and channels (name): 1 (Chance Pond Brook).
D2 CLIMATIC
Climatic data (1, 2)
Mean temp. [deg C]*1
| Jan | Feb | Mar | Apr | May | Jun | Jul | Aug | Sep | Oct | Nov | Dec | Ann. |
|---|---|---|---|---|---|---|---|---|---|---|---|---|
| -9.3 | -4.7 | 0.0 | 6.9 | 13.8 | 17.3 | 21.1 | 19.3 | 14.9 | 7.7 | 3.5 | -4.1 | 7.2 |
| Jan | Feb | Mar | Apr | May | Jun | Jul | Aug | Sep | Oct | Nov | Dec | Ann. |
|---|---|---|---|---|---|---|---|---|---|---|---|---|
| 50 | 45 | 54 | 67 | 76 | 89 | 98 | 86 | 84 | 75 | 67 | 54 | 845 |
*2 Burlington (VE), 1931-1960.
Bathymetric map (Q).
Water temperature [deg C]
1988
[m]
| Depth | Jan | Feb | Mar | Apr | May | Jun | Jul | Aug | Sep | Oct | Nov | Dec |
|---|---|---|---|---|---|---|---|---|---|---|---|---|
| S* | - | - | - | 8.8 | - | - | 24.1 | - | - | 13.7 | 6.5 | - |
| 1 | - | - | - | 7.6 | - | - | 24.0 | - | - | 13.7 | 6.5 | - |
| 2 | - | - | - | 7.4 | - | - | 23.9 | - | - | 13.7 | 6.5 | - |
| 3 | - | - | - | 7.6 | - | - | 23.8 | - | - | 13.7 | 6.5 | - |
| 4 | - | - | - | 7.5 | - | - | 23.6 | - | - | 13.7 | 6.5 | - |
| 5 | - | - | - | 7.6 | - | - | 21.6 | - | - | 13.7 | 6.5 | - |
| 6 | - | - | - | 7.5 | - | - | 19.2 | - | - | 13.7 | 6.5 | - |
| 7 | - | - | - | 7.5 | - | - | 17.4 | - | - | 13.6 | 6.5 | - |
| 8 | - | - | - | 7.6 | - | - | 16.3 | - | - | 13.6 | 6.5 | - |
| 9 | - | - | - | 7.7 | - | - | 14.9 | - | - | 13.6 | 6.5 | - |
| 10 | - | - | - | 7.9 | - | - | 14.2 | - | - | 13.6 | 6.5 | - |
| 11 | - | - | - | 7.7 | - | - | 13.5 | - | - | 13.5 | 6.5 | - |
| 12 | 3.0 | - | - | - | - | - | 13.2 | - | - | 13.5 | - | - |
Freezing period: November-March (Q).
Mixing type: Dimictic (Q).
Notes on water mixing and thermocline formation
Stratifies in the summer and in the winter.
E. LAKE WATER QUALITY
E1 TRANSPARENCY [m](1)November 1987-October 1988
[m]
| Depth | Jan | Feb | Mar | Apr | May | Jun | Jul | Aug | Sep | Oct | Nov | Dec |
|---|---|---|---|---|---|---|---|---|---|---|---|---|
| - | - | - | 3.4 | 4.2 | 4.1 | 4.7 | 4.5 | 4.5 | 3.9 | 2.2 | - |
Station 1, September 1979-August 1980
[m]
| Depth | Jan | Feb | Mar | Apr | May | Jun | Jul | Aug | Sep | Oct | Nov | Dec |
|---|---|---|---|---|---|---|---|---|---|---|---|---|
| 0 | 6.2 | - | - | 6.4 | 7.0 | 6.4 | 6.8 | 6.8 | 6.5 | - | 6.2 | - |
| 3 | 6.4 | 6.0 | - | 6.3 | 7.1 | 6.7 | 6.8 | 6.7 | 6.3 | - | 6.2 | - |
| 6 | 6.2 | 5.9 | - | 6.2 | 6.7 | 6.8 | 6.8 | 6.7 | 6.4 | - | 6.3 | - |
| 9 | - | - | - | 6.1 | 6.5 | 6.4 | 6.1 | 6.4 | 6.2 | - | 6.3 | - |
| 12 | - | - | - | - | - | 6.1 | 6.4 | 6.5 | - | - | - | - |
Vertical distribution of DO [mg l-1] and water temperature [deg C].
E6 CHLOROPHYLL CONCENTRATION [micro g l-1](1)
November 1987-October 1988
[m]
| Depth | Jan | Feb | Mar | Apr | May | Jun | Jul | Aug | Sep | Oct | Nov | Dec |
|---|---|---|---|---|---|---|---|---|---|---|---|---|
| - | - | - | - | 6.16 | 2.97 | 6.13 | 6.53 | 2.47 | 4.98 | 7.09 | 6.88 | - |
Total-N [mg l-1]
Station 1, September 1974-August 1980
[m]
| Depth | Jan | Feb | Mar | Apr | May | Jun | Jul | Aug | Sep | Oct | Nov | Dec |
|---|---|---|---|---|---|---|---|---|---|---|---|---|
| 0 | .20 | - | - | .25 | <.10 | .22 | .26 | .74 | .16 | - | .39 | - |
| 3 | 1.00 | .27 | - | .18 | .15 | .20 | .24 | .64 | .15 | - | .19 | - |
| 6 | 1.95 | .24 | - | .21 | .13 | <.10 | .21 | .62 | .13 | - | .13 | - |
| 9 | - | - | - | .23 | <.10 | .19 | .24 | .26 | .14 | - | .16 | - |
| 12 | - | - | - | - | - | <.10 | .28 | .37 | - | - | - | - |
Station 1, September 1979-August 1980
[m]
| Depth | Jan | Feb | Mar | Apr | May | Jun | Jul | Aug | Sep | Oct | Nov | Dec |
|---|---|---|---|---|---|---|---|---|---|---|---|---|
| 0 | .20 | - | - | .25 | <.10 | .37 | .23 | .24 | .16 | - | .39 | - |
| 3 | 1.00 | .27 | - | .18 | .15 | .39 | .27 | .22 | .15 | - | .19 | - |
| 6 | 1.95 | .24 | - | .21 | .13 | .44 | .29 | .24 | .13 | - | .13 | - |
| 9 | - | - | - | .23 | <.10 | .42 | .26 | .23 | .14 | - | .16 | - |
| 12 | - | - | - | - | - | - | .49 | - | - | - | - | - |
Station 1, September 1979-August 1980
[m]
| Depth | Jan | Feb | Mar | Apr | May | Jun | Jul | Aug | Sep | Oct | Nov | Dec |
|---|---|---|---|---|---|---|---|---|---|---|---|---|
| 0 | .010 | - | - | .014 | .010 | .012 | .021 | .006 | .010 | - | .009 | - |
| 3 | .008 | .008 | - | .014 | .011 | .015 | .020 | .009 | .011 | - | .009 | - |
| 6 | .008 | .008 | - | .013 | .012 | .005 | .008 | .014 | .010 | - | .011 | - |
| 9 | - | - | - | .012 | .016 | .003 | .022 | .021 | .013 | - | .009 | - |
| 12 | - | - | - | - | - | .142 | .057 | .068 | - | - | - | - |
F. BIOLOGICAL FEATURES
F1 FLORA (3) 1979Emerged macrophytes: Sparganium, Scirpus, Pontederia, Typha.
Floating macrophytes: Nymphaea, Nuphar.
Submerged macrophytes: Potamogeton, Vallisneria americana, Nitella.
Phytoplankton
Tabellaria, Melosira, Mallomonas, Asterionella, Dinobryon, Ceratium, Uroglenopsis, Anabaena, Fragilaria, Staurastrum, Sphaerocystis, Rhizosolenia, Peridinium, Mougeotia.
Distribution of aquatic plants, July 1979 (3).
F2 FAUNA
Zooplankton (3)
Kellicottia, Keratella, Polyarthra, Bosmina, Diaptomus, Cyclops, Vorticella,
Codonella, Arcella.
Benthos: Cironomids, tubificid worms, planarians and caddis worms (3).
Fish (4, 5)
Catostomus commersoni, Rhinichthys atratulus, Perca flavescens, Morone
americana, Micropterus dolomieui, Notemigonus crysoleucas, smelts, sunfish,
Ictalurus nebulosus, Esox.
G. SOCIO-ECONOMIC CONDITIONS
G1 LAND USE IN THE CATCHMENT AREA (1)1981
| Area [km2] | [%] | |
|---|---|---|
| Natural landscape | ||
| Forest | 3,601.8 | 83.7 |
| Agricultural land | ||
| Inactive | 195.1 | 4.5 |
| Active | 185.8 | 4.3 |
| Residential area | 127.9 | 3.0 |
| Lake front | ||
| Low density | 50.7 | 1.2 |
| Med. density | 29.1 | 0.7 |
| High density | 19.0 | 0.4 |
| Industry | 2.8 | 0.4 |
| Public | 60.3 | 1.4 |
| Conservation | 29.5 | 0.7 |
| Total | 4,302 | 100 |
Main agricultural products: Grapes, dairy products, beef.
Number of domestic animals in the catchment area: Cattle 60, horses 10.
G3 POPULATION IN THE CATCHMENT AREA (1)
| Population | Major cities | ||
|---|---|---|---|
| Population | density [km-2] | (population) | |
| Rural | 792* | ||
| 825*2 | None | ||
| Total | 1,622 | 18.4 (37.7) |
H. LAKE UTILIZATION
H1 LAKE UTILIZATIONSources of water, sightseeing and tourism and recreation (swimming, sport- fishing).
I. DETERIORATION OF LAKE ENVIRONMENTS AND HAZARDS
I1 ENHANCED SILTATION (Q)Extent of damage: Not serious.
I2 TOXIC CONTAMINATION
Present status: None.
Environmental quality standards for contamination in lake water
| Classification | |||
|---|---|---|---|
| Quality | A | B | C |
| DO [ppm] | >6 | >6 | >5-6 |
| ( >75% of saturation) | |||
| Sludge deposit | None | No reasonable kinds or quantity | |
| Oil & Greese | None | No reasonable kinds or quantity | |
| Gross radioactivity | A, B, C <1000 picocuries 1-1 | ||
| Strontium-90 | A, B, C <10 picocuries 1-1 | ||
| Phenol [ppm] | <0.001 | <0.001 | <0.002 |
Nitrogen and phosphorus loadings to the lake [kg yr-1](1)
| Sources | T-P |
|---|---|
| 14 tributaries | 45,870 |
| Natural | 6,812 |
| Dry fallout (30% of precipitation) | 2,043 |
| Sewage loading | 7,131 |
| Total | 61,956 |
Eutrophication is mainly caused by nutrient enrichment from upstream dairy farms.
J. WASTEWATER TREATMENTS (Q)
J1 GENERATION OF POLLUTANTS IN THE CATCHMENT AREA- d) Measurable pollution with limited wastewater treatment.
Percentage of rural population with adequate sanitary facilities (on-site
treatment systems): Common but exact figure not available.
Municipal wastewater treatment systems: None.
L. DEVELOPMENT PLANS (1)
Watershed population projections up to the year 2000 show an expected increase of 6.1%. Part of this growth may include conversion of secondary homes to primary, and with this accompanying impact upon the septic systems, and therefore Webster Lake. Future development is expected to be primarily of a moderate residential nature.M. LEGISLATIVE AND INSTITUTIONAL MEASURES FOR UPGRADING LAKE ENVIRONMENTS
M1 NATIONAL AND LOCAL LAWS CONCERNEDNames of the laws (the year of legislation)
- Water Supply & Pollution Control (1984) Responsible authorities
- Federal
- State
- Local Main items of control
- Algae and other aquatic nuisances
- Exotic weeds
- Illegal dumping and other violations
- New Hampshire Department of Environmental Services, Water Supply and Pollution Control Division, Biology Bureau
N. SOURCES OF DATA
- Questionnaire prepared by the editors with the support of Dufresne-Henry Inc., based on the following sources.
- Dufresne-Henry Inc. (1981) Water Quality Management Investigation, Webster Lake, Franklin, New Hampshire.
- Court, A. (1974) The Climate of the Conterminous United States. "World Survey of Climatology, Volume 11, Climates of North America" (ed. Bryson, R. A. & Hare, F. K.), p. 336. Elsevier Scientific Publishing Company, Amsterdam-London-New York.
- Department of Environmental Services, New Hampshire Water Supply and Pollution Control Division (1987) Webster Lake Diagnostic/Feasibility Study Grant Application.
- Newell, A. E. (1977) Biological Survey of the Lake and Ponds in Sullivan Merrimack, Belknap and Stratford Counties. State of New Hampshire Fish and Game Survey Report # 8b.
- Scarola, J. F. (1973) Freshwater Fishes of New Hampshire. New Hampshire Fish and Game Department, Division of Inland and Marine Fisheries.
