LAKE CHAMPLAIN
A view from a lakeside hill
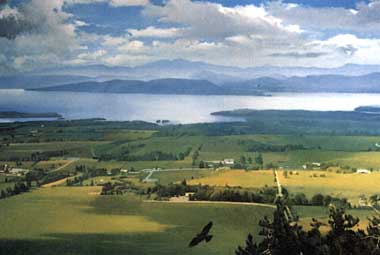
Photo: E. B. Henson
A. LOCATION
Vermont and New York, USA; and Quebec, Canada. 43:3-43:5N, 73:5-73:5W;
29.38 m above sea level.
B. DESCRIPTION
Lake Champlain has unusual characteristics. It occupies
a long, deep, and narrow valley; it has a northerly flow; and for a period
after the glaciation the lake was marine. It then became the sixth largest
lake in the United States. Lake Champlain may have the largest shore development
index of any lake in the United States.
The lake occupies a north-south fault zone, and
extends 174 km from Whitehall, N. Y. to its outlet in Canada. The lake
flows northerly through its outlet, the Richeleau River, into the St. Lawrence
River near Montreal. The maximum width of the lake is 19 km. The drainage
basin of the lake of 19,881 km2 includes portions of the States of New
York and Vermont and the Province of Quebec in Canada.
The basin was overridden by the Wisconsin glaciation
during the Pleistocene. As the ice melted towards the north, proglacial
Lake Vermont was formed and flowed south through the Hudson valley. When
the ice margin retreated north of the St. Lawrence Valley, the Champlain
basin was inundated with saline ocean water, forming the Champlain Sea.
After glacial rebound of the land to the north, the marine incursion ended
and the present Lake Champlain was formed about 12,000 years B. P. The
uplift resulted in a complex and irregular lake basin with drowned valleys
to the east and precipitous cliffs to the west. Large islands to the north,
more than 70 islands in the lake, and peninsulae have divided the lake
into five major basins. The southern lake is riverine and opens into the
main basin. The Missisquoi River delta forms Missisquoi Bay to the northeast.
The large islands to the north and natural causeways form Malletts Bay.
Between these two bays, and to the east of the islands is the Northeast
arm of the lake. Each of these five basins exhibits distinct limnological
characteristics.
Lake Champlain has been the focal point for much
of the early history of this part of North America. For nearly 150 years
after being discovered by Samuel de Champlain in 1609, the lake was the
focus of the British, French, and Indian wars; the lake was the scene of
significant naval battles during the Revolutionary War and the war of 1812.
Approximately 9.830 km3 of water drain from 19,881
km2 of land into the lake per year providing a refilling rate of 2.6 years
at average lake level. The population in the basin is approximately 500,000.
Although the lake appears to have been deteriorating since the turn of
the century, the trend for inter- governmental cooperation is increasing.
Environmental sense is strong among the inhabitants (Q).
C. PHYSICAL DIMENSIONS
|
| Basin |
Missiquoi Bay |
Northeast Region |
Malletts Bay |
|
| Surface area [km2] |
78 |
270 |
54 |
| Volume [km3] |
0.220444 |
3.982159 |
0.699319 |
| Maximum depth [m] |
- |
- |
- |
| Mean depth [m] |
2.8 |
14.7 |
12.9 |
| Normal range of annual water |
|
level fluctuation [m] |
- |
- |
- |
| Length of shoreline [km] |
- |
- |
- |
| Residence time [yr] |
- |
- |
- |
| Catchment area [km2] |
2,964 |
234 |
2,032 |
| Basin |
Main Lake |
South Lake |
Total |
| Surface area [km2] |
671 |
57 |
1,130 |
| Volume [km3] |
20.744577 |
0.155575 |
25.802074 |
| Maximum depth [m] |
- |
- |
123 |
| Mean depth [m] |
30.9 |
2.7 |
22.8 |
| Normal range of annual |
| water level fluctuation [m] |
- |
- |
0.8-2.6 |
| Length of shoreline [km] |
- |
- |
944.7 |
| Residence time [yr] |
- |
- |
2.6 |
| Catchment area [km2] |
11,577 |
3,075 |
19,881 |
| End |
D. PHYSIOGRAPHIC FEATURES (Q)
D1 GEOGRAPHICAL Bathymetric map: Fig. NAM-38-01. Names of main islands
Grand Isles* (208.4 km2), North Hero* (121.2 km2), Valcour* (4.0 km2) and
Butler (2.3 km2). * The islands are connected to the mainland by bridges
and roads. There are ca. 60 islands with areas <1 km2. Number of outflowing
rivers and channels (name) 1 (Richeleau R. draining into the St. Lawrence
R.).
D2 CLIMATIC Climatic data at Burlington, 1944-1988 Mean temp.
[deg C]
|
| Jan |
Feb |
Mar |
Apr |
May |
Jun |
Jul |
Aug |
Sep |
Oct |
Nov |
Dec |
Ann. |
|
| -8.5 |
-7.7 |
-1.6 |
5.9 |
12.9 |
18.3 |
20.9 |
19.5 |
14.9 |
8.8 |
2.6 |
-5.2 |
6.7 |
Precipitation [mm]
|
| Jan |
Feb |
Mar |
Apr |
May |
Jun |
Jul |
Aug |
Sep |
Oct |
Nov |
Dec |
Ann. |
|
| 47 |
44 |
56 |
70 |
75 |
93 |
87 |
98 |
71 |
71 |
71 |
62 |
845 |
Fig. NAM-38-01
Bathymetric map [m](Q).
Water temperature [deg C](7) Main lake, 1975 [m]
|
| Depth Jan |
Feb |
Mar |
Apr |
May |
Jun |
Jul |
Aug |
Sep |
Oct |
Nov |
Dec |
|
| 1 |
- |
- |
- |
1.25 |
6.0 |
12.5 |
23.0 |
22.0 |
15.6 |
12.3 |
10.5 |
- |
| 5 |
- |
- |
- |
- |
5.8 |
12.0 |
22.0 |
21.6 |
15.4 |
12.3 |
10.5 |
- |
| 10 |
- |
- |
- |
- |
5.7 |
11.0 |
17.0 |
21.0 |
15.2 |
12.3 |
10.5 |
- |
| 15 |
- |
- |
- |
- |
5.4 |
10.0 |
11.5 |
19.0 |
15.2 |
12.3 |
10.5 |
- |
| 20 |
- |
- |
- |
- |
5.2 |
9.0 |
9.5 |
16.0 |
15.1 |
12.3 |
10.5 |
- |
| 25 |
- |
- |
- |
- |
5.0 |
7.5 |
9.0 |
9.0 |
13.5 |
12.3 |
10.5 |
- |
| 30 |
- |
- |
- |
- |
4.8 |
6.7 |
8.0 |
8.2 |
9.5 |
12.3 |
10.4 |
- |
| 35 |
- |
- |
- |
- |
4.7 |
5.6 |
6.0 |
7.5 |
8.6 |
12.3 |
10.4 |
- |
| 40 |
- |
- |
- |
- |
4.5 |
5.5 |
5.3 |
6.8 |
8.2 |
9.4 |
10.4 |
- |
| 45 |
- |
- |
- |
- |
4.4 |
5.3 |
5.1 |
6.5 |
8.0 |
9.0 |
10.4 |
- |
| 50 |
- |
- |
- |
- |
4.2 |
5.0 |
5.0 |
6.5 |
7.5 |
8.9 |
10.4 |
- |
| 55 |
- |
- |
- |
- |
4.2 |
4.9 |
4.9 |
6.4 |
7.2 |
8.7 |
10.0 |
- |
| 60 |
- |
- |
- |
1.5 |
4.2 |
4.9 |
4.9 |
6.3 |
7.0 |
8.6 |
9.9 |
- |
| 65 |
- |
- |
- |
- |
4.2 |
4.8 |
4.9 |
6.2 |
6.8 |
8.5 |
9.6 |
- |
| 70 |
- |
- |
- |
- |
4.2 |
4.7 |
4.8 |
6.1 |
6.6 |
8.3 |
9.4 |
- |
| 75 |
- |
- |
- |
- |
4.2 |
4.6 |
4.7 |
6.1 |
6.5 |
8.3 |
9.1 |
- |
| 80 |
- |
- |
- |
- |
- |
4.4 |
4.6 |
6.1 |
6.5 |
8.3 |
9.1 |
- |
| 85 |
- |
- |
- |
- |
- |
4.3 |
4.5 |
6.1 |
6.5 |
8.0 |
9.1 |
- |
| 90 |
- |
- |
- |
- |
4.1 |
4.3 |
4.5 |
6.0 |
6.5 |
8.0 |
9.0 |
- |
| 95 |
- |
- |
- |
- |
- |
4.2 |
4.4 |
6.0 |
6.5 |
8.0 |
9.0 |
- |
| 100 |
- |
- |
- |
1.75 |
- |
4.2 |
4.2 |
5.9 |
6.5 |
8.0 |
8.9 |
- |
| 105 |
- |
- |
- |
- |
4.0 |
4.1 |
4.2 |
- |
- |
7.9 |
8.9 |
- |
Malletts Bay, 1974 [m]
|
| Depth Jan |
Feb |
Mar |
Apr |
May |
Jun |
Jul |
Aug |
Sep |
Oct |
Nov |
Dec |
|
| 1 |
- |
- |
- |
- |
6.7 |
19.0 |
19.0 |
23.0 |
- |
11.2 |
- |
- |
| 2 |
- |
- |
- |
- |
- |
19.0 |
19.0 |
22.0 |
- |
- |
- |
- |
| 4 |
- |
- |
- |
- |
- |
19.0 |
18.8 |
21.8 |
- |
- |
- |
- |
| 6 |
- |
- |
- |
- |
- |
19.0 |
18.6 |
21.7 |
- |
- |
- |
- |
| 8 |
- |
- |
- |
- |
- |
16.6 |
18.4 |
21.6 |
- |
- |
- |
- |
| 10 |
- |
- |
- |
- |
6.0 |
15.4 |
17.0 |
21.4 |
- |
- |
- |
- |
| 12 |
- |
- |
- |
- |
- |
10.0 |
14.5 |
21.0 |
- |
- |
- |
- |
| 14 |
- |
- |
- |
- |
- |
10.5 |
11.5 |
16.0 |
- |
- |
- |
- |
| 16 |
- |
- |
- |
- |
- |
9.0 |
10.0 |
9.6 |
- |
- |
- |
- |
| 18 |
- |
- |
- |
- |
- |
8.8 |
9.0 |
9.0 |
- |
- |
- |
- |
| 20 |
- |
- |
- |
- |
- |
8.8 |
8.6 |
8.8 |
- |
- |
- |
- |
| 22 |
- |
- |
- |
- |
- |
8.5 |
8.5 |
8.5 |
- |
- |
- |
- |
| 24 |
- |
- |
- |
- |
- |
8.4 |
8.4 |
8.4 |
- |
- |
- |
- |
| 26 |
- |
- |
- |
- |
- |
8.3 |
8.3 |
8.2 |
- |
- |
- |
- |
| 28 |
- |
- |
- |
- |
- |
8.2 |
8.2 |
8.0 |
- |
- |
- |
- |
| 30 |
- |
- |
- |
- |
5.5 |
- |
8.2 |
8.0 |
- |
- |
- |
- |
| 32 |
- |
- |
- |
- |
- |
- |
- |
- |
- |
10.6 |
- |
- |
Freezing period Northern and southern ends of the lake and the northeast
arm: December-late April. Main lake: 11 February-8 April (complete freezing).
With 160 years of record the lake failed to freeze over on only 12 years.
Maletts Bay: December-May. Mixing type: Dimictic. Notes on water mixing
and thermocline formation Mixing takes place in April-May and November-December
in the main lake, and in May and October in Mallets Bay.
E. LAKE WATER QUALITY
E1 TRANSPARENCY [m](7) Main lake, 1972-1975 [m]
|
| Depth Jan |
Feb |
Mar |
Apr |
May |
Jun |
Jul |
Aug |
Sep |
Oct |
Nov |
Dec |
|
|
- |
- |
- |
4.5 |
3.8 |
2.8 |
3.6 |
3.7 |
4.2 |
3.6 |
4.7 |
6.0 |
Malletts Bay, 1964-1975 [m]
|
| Depth Jan |
Feb |
Mar |
Apr |
May |
Jun |
Jul |
Aug |
Sep |
Oct |
Nov |
Dec |
|
|
- |
2.0 |
2.8 |
3.0 |
2.7 |
4.1 |
4.7 |
4.4 |
4.8 |
3.6 |
3.1 |
- |
E2 pH Main lake, 1975 (7) [m]
|
| Depth Jan |
Feb |
Mar |
Apr |
May |
Jun |
Jul |
Aug |
Sep |
Oct |
Nov |
Dec |
|
| 1 |
- |
- |
- |
8.0 |
7.4 |
8.4 |
8.4 |
8.3 |
7.5 |
7.4 |
7.6 |
- |
| 5 |
- |
- |
- |
- |
- |
8.3 |
- |
- |
- |
- |
- |
- |
| 15 |
- |
- |
- |
- |
- |
- |
- |
8.2 |
7.2 |
- |
- |
- |
| 20 |
- |
- |
- |
- |
7.4 |
7.9 |
- |
7.8 |
- |
- |
- |
- |
| 22 |
- |
- |
- |
- |
- |
- |
- |
- |
7.5 |
- |
- |
- |
| 25 |
- |
- |
8.0 |
- |
- |
- |
- |
- |
- |
7.3 |
7.5 |
- |
| 29 |
- |
- |
- |
- |
- |
- |
- |
- |
7.3 |
- |
- |
- |
| 30 |
- |
- |
- |
- |
7.1 |
- |
- |
- |
- |
- |
- |
- |
| 35 |
- |
- |
- |
- |
- |
- |
- |
7.3 |
7.2 |
- |
- |
- |
| 40 |
- |
- |
- |
- |
- |
7.5 |
7.5 |
- |
- |
- |
- |
- |
| 45 |
- |
- |
- |
- |
- |
- |
- |
- |
- |
- |
7.5 |
- |
| 46 |
- |
- |
- |
- |
- |
- |
- |
- |
6.9 |
- |
- |
- |
| 50 |
- |
- |
8.0 |
- |
- |
- |
- |
- |
- |
7.1 |
- |
- |
| 55 |
- |
- |
- |
- |
- |
- |
- |
- |
- |
- |
7.4 |
- |
| 61 |
- |
- |
- |
- |
- |
- |
- |
- |
7.2 |
- |
- |
- |
| 75 |
- |
- |
8.0 |
- |
- |
- |
- |
- |
- |
- |
- |
- |
| 76 |
- |
- |
- |
- |
- |
- |
- |
- |
7.2 |
- |
- |
- |
| 91 |
- |
- |
- |
- |
- |
- |
- |
- |
7.0 |
- |
- |
- |
| 100 |
- |
- |
- |
8.0 |
- |
- |
7.4 |
- |
- |
6.9 |
- |
- |
| 105 |
- |
- |
- |
- |
7.2 |
7.5 |
- |
7.4 |
- |
- |
- |
- |
| 108 |
- |
- |
- |
- |
- |
- |
- |
- |
- |
- |
7.3 |
- |
Malletts Bay, 1974 (7) [m]
|
| Depth Jan |
Feb |
Mar |
Apr |
May |
Jun |
Jul |
Aug |
Sep |
Oct |
Nov |
Dec |
|
| 1 |
- |
- |
- |
- |
7.2 |
7.4 |
6.5 |
8.2 |
- |
7.2 |
- |
- |
| 5 |
- |
- |
- |
- |
- |
7.3 |
- |
8.3 |
- |
- |
- |
- |
| 6 |
- |
- |
- |
- |
- |
- |
6.6 |
- |
- |
- |
- |
- |
| 10 |
- |
- |
- |
- |
7.2 |
7.1 |
- |
8.0 |
- |
- |
- |
- |
| 12 |
- |
- |
- |
- |
- |
- |
- |
- |
- |
7.2 |
- |
- |
| 15 |
- |
- |
- |
- |
- |
7.0 |
- |
6.9 |
- |
- |
- |
- |
| 20 |
- |
- |
- |
- |
7.1 |
6.9 |
- |
6.8 |
- |
- |
- |
- |
| 24 |
- |
- |
- |
- |
- |
- |
6.2 |
- |
- |
- |
- |
- |
| 25 |
- |
- |
- |
- |
- |
6.8 |
- |
6.8 |
- |
- |
- |
- |
| 28 |
- |
- |
- |
- |
- |
- |
- |
6.7 |
- |
- |
- |
- |
| 29 |
- |
- |
- |
- |
7.2 |
- |
5.6 |
- |
- |
- |
- |
- |
| 30 |
- |
- |
- |
- |
- |
6.8 |
- |
- |
- |
- |
- |
- |
| 34 |
- |
- |
- |
- |
- |
- |
- |
- |
- |
7.2 |
- |
- |
Rouses Point, N.Y., 1980-1986 (1) [m]
|
| Depth Jan |
Feb |
Mar |
Apr |
May |
Jun |
Jul |
Aug |
Sep |
Oct |
Nov |
Dec |
|
| 0 |
- |
- |
7.3 |
7.5 |
8.0 |
7.2 |
7.7 |
7.9 |
7.4 |
7.2 |
7.3 |
- |
E4 DO [mg l-1](1, 7) Main lake, 1975 [m]
|
| Depth Jan |
Feb |
Mar |
Apr |
May |
Jun |
Jul |
Aug |
Sep |
Oct |
Nov |
Dec |
|
| 1 |
- |
- |
- |
13.0 |
12.9 |
12.1 |
9.9 |
8.9 |
8.8 |
10.4 |
10.6 |
- |
| 5 |
- |
- |
- |
- |
- |
- |
9.8 |
- |
- |
- |
- |
- |
| 15 |
- |
- |
- |
- |
- |
- |
- |
8.7 |
9.1 |
- |
- |
- |
| 20 |
- |
- |
- |
- |
12.7 |
11.9 |
- |
- |
- |
- |
- |
- |
| 22 |
- |
- |
- |
- |
- |
- |
- |
- |
8.9 |
- |
- |
- |
| 25 |
- |
- |
- |
13.0 |
- |
- |
- |
- |
- |
9.3 |
9.9 |
- |
| 29 |
- |
- |
- |
- |
- |
- |
- |
- |
8.4 |
- |
- |
- |
| 30 |
- |
- |
- |
- |
12.7 |
- |
- |
- |
- |
- |
- |
- |
| 35 |
- |
- |
- |
- |
- |
- |
- |
10.3 |
- |
- |
- |
- |
| 40 |
- |
- |
- |
- |
- |
12.5 |
11.8 |
- |
- |
- |
- |
- |
| 45 |
- |
- |
- |
- |
- |
- |
- |
- |
- |
- |
10.1 |
- |
| 46 |
- |
- |
- |
- |
- |
- |
- |
- |
9.1 |
- |
- |
- |
| 50 |
- |
- |
- |
13.0 |
- |
- |
- |
- |
- |
8.6 |
- |
- |
| 55 |
- |
- |
- |
- |
- |
- |
- |
- |
- |
- |
10.2 |
- |
| 61 |
- |
- |
- |
- |
- |
- |
- |
- |
8.8 |
- |
- |
- |
| 75 |
- |
- |
13.0 |
- |
- |
- |
- |
- |
- |
- |
- |
- |
| 76 |
- |
- |
- |
- |
- |
- |
- |
- |
8.8 |
- |
- |
- |
| 91 |
- |
- |
- |
- |
- |
- |
- |
- |
9.2 |
- |
- |
- |
| 100 |
- |
- |
- |
13.0 |
- |
- |
11.8 |
- |
9.4 |
8.9 |
- |
- |
| 105 |
- |
- |
- |
- |
12.6 |
12.7 |
- |
11.0 |
- |
- |
- |
- |
| 108 |
- |
- |
- |
- |
- |
- |
- |
- |
- |
- |
9.1 |
- |
Malletts Bay, 1974 [m]
|
| Depth Jan |
Feb |
Mar |
Apr |
May |
Jun |
Jul |
Aug |
Sep |
Oct |
Nov |
Dec |
|
| 1 |
- |
- |
- |
- |
11.6 |
9.5 |
8.7 |
8.5 |
- |
10.4 |
- |
- |
| 5 |
- |
- |
- |
- |
- |
9.6 |
- |
8.5 |
- |
- |
- |
- |
| 6 |
- |
- |
- |
- |
- |
- |
8.8 |
- |
- |
- |
- |
- |
| 10 |
- |
- |
- |
- |
11.6 |
9.7 |
- |
8.1 |
- |
- |
- |
- |
| 12 |
- |
- |
- |
- |
- |
- |
- |
- |
- |
10.1 |
- |
- |
| 15 |
- |
- |
- |
- |
- |
9.6 |
- |
4.8 |
- |
- |
- |
- |
| 20 |
- |
- |
- |
- |
11.7 |
9.1 |
- |
5.1 |
- |
- |
- |
- |
| 24 |
- |
- |
- |
- |
- |
- |
7.1 |
- |
- |
- |
- |
- |
| 25 |
- |
- |
- |
- |
- |
8.9 |
- |
4.8 |
- |
- |
- |
- |
| 28 |
- |
- |
- |
- |
- |
- |
- |
2.8 |
- |
- |
- |
- |
| 29 |
- |
- |
- |
- |
11.6 |
- |
6.4 |
- |
- |
- |
- |
- |
| 30 |
- |
- |
- |
- |
- |
8.6 |
- |
- |
- |
- |
- |
- |
| 34 |
- |
- |
- |
- |
- |
- |
- |
- |
- |
10.4 |
- |
- |
Rouses Point, 1980-1986 [m]
|
| Depth Jan |
Feb |
Mar |
Apr |
May |
Jun |
Jul |
Aug |
Sep |
Oct |
Nov |
Dec |
|
| 1 |
- |
- |
11.6 |
12.1 |
11.8 |
9.4 |
8.4 |
8.7 |
8.3 |
10.7 |
11.5 |
- |
E6 CHLOROPHYLL CONCENTRATION [micro g l-1](9) Main lake, 1988 [m]
|
| Depth Jan |
Feb |
Mar |
Apr |
May |
Jun |
Jul |
Aug |
Sep |
Oct |
Nov |
Dec |
|
| - |
- |
- |
- |
- |
- |
4.3 |
1.9 |
3.0 |
- |
- |
- |
- |
E7 NITROGEN CONCENTRATION (1) NO2-N+NO3-N [mg l-1] Rouses Point,
1980-1986 [m]
|
| Depth Jan |
Feb |
Mar |
Apr |
May |
Jun |
Jul |
Aug |
Sep |
Oct |
Nov |
Dec |
|
| 1 |
- |
- |
.26 |
.20 |
.27 |
.14 |
.10 |
<.10 |
<.10 |
<.10 |
.16 |
- |
E8 PHOSPHORUS CONCENTRATION Total-P [micro g l-1] Main lake, 1988
(9) [m]
|
| Depth Jan |
Feb |
Mar |
Apr |
May |
Jun |
Jul |
Aug |
Sep |
Oct |
Nov |
Dec |
|
| - |
- |
- |
- |
- |
- |
16 |
14 |
13 |
- |
- |
- |
- |
Rouses Point, N.Y., 1980-1986 (1) [m]
|
| Depth Jan |
Feb |
Mar |
Apr |
May |
Jun |
Jul |
Aug |
Sep |
Oct |
Nov |
Dec |
|
| 1 |
- |
- |
20 |
22 |
34 |
10 |
10 |
22 |
5 |
58 |
10 |
- |
E9 CHLORIDE CONCENTRATION (1) Chlorine [mg l-1] Rouses Point, N.Y.,
1980-1986 [m]
|
| Depth Jan |
Feb |
Mar |
Apr |
May |
Jun |
Jul |
Aug |
Sep |
Oct |
Nov |
Dec |
|
| 1 |
- |
- |
8.1 |
8.7 |
8.5 |
8.0 |
8.2 |
8.3 |
8.0 |
8.5 |
8.7 |
- |
E10 PAST TRENDS (7) Transparency [m] Main lake
|
| 1965 |
1966 |
1967 |
1968 |
1969 |
1970 |
1971 |
1972 |
1973 |
1974 |
1975 |
1976 |
1977 |
|
| 5.38 |
4.33 |
5.37 |
3.75 |
4.22 |
3.87 |
3.95 |
4.01 |
3.27 |
3.55 |
4.05 |
5.05 |
4.89 |
Malletts Bay
|
| 1964 |
1965 |
1966 |
1967 |
1968 |
1969 |
1970 |
1971 |
1972 |
1973 |
1974 |
1975 |
1976 |
|
| 4.57 |
5.36 |
4.35 |
3.50 |
4.48 |
3.99 |
3.64 |
4.00 |
4.19 |
2.70 |
3.10 |
5.30 |
- |
Fig. NAM-38-02
Past trend of pH.
F. BIOLOGICAL FEATURES (Q, 1, 2, 10)
F1 FLORA Main lake Emerged macrophytes: Spartina pectinata, Zizania
aquatica. Floating macrophytes: Trapa natans, Nymphoides peltatum. Submerged
macrophytes: Vallisneria americana, Myriophyllum spicatum. Phytoplankton
Chlorophyceae (Ankistrodesmus); Bacillariophyceae (Asterionella sp., Cyclotella
sp., Fragillaria crotonensis, Melosira islandica, Stephanodiscus sp., Tabellaria
fenestrata); Cyanophyta (Anabaena planktonica, A. circinalis, Anacystis
sp., Oscillatoria sp.).
-
Filamentous algae
Cladophora glomerata, Dichotomosiphon tuberosa, Ulothrix zonata.
F2 FAUNA Main lake Zooplankton Calanoid copepods (Diaptomus minutus,
D. dregonensis, D. sicilis, Epischura lacustris, Limnocalanus macrurus,
Senecella calanoides); Cyclopoid copepods (Cyclops bicuspidatus); Cladocera
(Daphnia retrocurva, Leptodora kindtii). Benthos Mysis relicta, Pontoporeia
hoyi, Manayunkia speciosa, Limnodrilus hoffmeisteri, L. claparedianus,
Stylodrilus heringianus, Peloscolex variegatus. Fish Yellow perch*, rainbow
smelt*, lake trout, sea lamprey, lake sturgeon (endangered), atlantic salmon.
* Economically important. Supplementary notes on the biota Myriophyllum
is now common in much of the lake. The water chestnut (Trapa) and the floating
heart (Nymphoides) are now nuisances in the southern end of the lake and
in some bays. Pontoporeia was reported to be in the lake in 1966 (11),
and later by Dadswell (12). One specimen has so far been collected in an
on-going survey in 1988- 1989 (13). 49 species of fish are reported living
in the lake. Control measures are being implemented to control the sea
lamprey, a species that is damaging the cold water fisheries (4).
F5
FISHERY PRODUCTS Fishery products other than fish: None.
F7 NOTES
ON THE REMARKABLE CHANGES OF BIOTA IN THE LAKE IN RECENT YEARS Atlantic
salmon became extinct in the lake by the mid 1800's. A number of foreign
aquatic plants have invaded the lake. Three are nuisance plants: Eurasian
milfoil, water chestnut, and yellow floating heart. New York and Vermont
began cooperative stocking of the lake trout in 1958 with encouraging success.
G. SOCIO-ECONOMIC CONDITIONS
G1 LAND USE IN THE CATCHMENT AREA (4) 1968, 1972
|
|
Area [km2] |
[%] |
|
| Natural landscape |
|
Forest |
12,221 |
61.3 |
|
Scrub |
1,276 |
6.4 |
|
Lakes and ponds |
1,380 |
6.9 |
|
Wetlands |
397 |
2.0 |
| Agricultural land |
|
Crop field |
2,750 |
13.8 |
|
Orchards |
43 |
0.2 |
|
Pasture |
943 |
4.8 |
| Residential area |
727 |
3.6 |
| Others |
|
Public lands |
194 |
1.0 |
| Total |
19,931 |
100.0 |
Types of important forest vegetation Sugar maple, yellow birch, beech (6,532
km2), spruce, fir (2,168 km2), elm, oak, soft maple (1,778 km2), white
and red pine (1,702 km2), red spruce (at high elevations). Main kinds of
crops: Mostly dairy products; apple. Trends of change in land use in recent
years Conversion of farm and pasture land to scrub and forests, and the
spread of settled areas away from the population centres and along roadways
and the lake shore.
G2 INDUSTRIES IN THE CATCHMENT AREA (4) 1970
|
|
No. of persons |
[%] |
|
engaged |
|
| Primary industry |
|
Agriculture |
8,914 |
5.2 |
| Secondary industry |
|
Construction |
11,635 |
6.8 |
|
Manufacturing |
33,943 |
19.7 |
|
Mining |
1,539 |
0.9 |
| Tertiary industry |
|
Service |
46,516 |
27.0 |
|
Trade |
28,247 |
16.4 |
|
Educational service |
18,272 |
10.6 |
|
Public administration |
9,273 |
5.4 |
|
Public utilities |
8,086 |
4.7*1 |
|
Finance |
5,796 |
3.4*2 |
| Total |
172,221 |
100 |
*1 Utilities, transportation and communication. *2 Banking, insurance and
real estate. Supplementary notes The main industries in the Champlain basin
are tourism and recreation (including skiing, fishing, boating, and camping),
agriculture, and manufacture of technical durable goods. Meaningful dollar
values are not available because of reports from overlapping interest groups
and two States. The data mentioned above, extracted from the reference,
is based on a sample from the U.S. Bureau of the Census, and does not include
data from Canada. The spectrum of employment provides a perspective of
the industries within the basin. Numbers of domestic animals in the catchment
area (14): Cattle 171,602.
G3 POPULATION IN THE CATCHMENT AREA (4)
1970
|
|
[%] |
Population |
Major cities |
|
Population*1 |
density [km-2] |
(population) |
|
| Urban*2 |
202,431 |
43.6 |
N.A. |
Burlington, Vt. |
| Rural |
263,670 |
56.4 |
N.A. |
(38,633) |
| Total |
466,101 |
100 |
*1 Population in the 11 counties of New York, Vermont, and the Province
of Quebec, Canada adjacent to the lake. *2 The U.S. Census defines urban
as any incorporated place of 2,500 inhabitants or more.
H. LAKE UTILIZATION
H1 LAKE UTILIZATION (Q) Source of water, navigation and transportation,
sightseeing and tourism, recreation (swimming, sport-fishing, yachting)
and aesthetics.
H2 THE LAKE AS WATER RESOURCE (15) 1988
|
|
Use rate [m3 day-1] |
|
| Domestic* |
58,675 |
*Burlington area.
I. DETERIORATION OF LAKE ENVIRONMENTS AND HAZARDS
I1 ENHANCED SILTATION (16) Extent of damage Not serious (serious
in portion of the lake during high lake levels).
|
| Erosion status |
Length of shore [km] |
[%] |
|
| None |
212 |
26.4 |
| Slight |
188 |
23.4 |
| Moderate |
143 |
17.8 |
| Severe |
261 |
32.4 |
I2 TOXIC CONTAMINATION (17) Present status: Little information available.
Main contaminants, their concentrations and sources
|
| Name of |
Range of concentrations [ppm] |
Main Sources |
| contaminants |
Water Bottom mud |
Fish* Other organisms |
|
| Mercury |
- |
- |
0-1 |
- |
Industrial, air |
| PCB's |
- |
- |
75 |
- |
Unknown |
| DDT |
- |
- |
72 |
- |
Unknown |
| Trace metals |
- |
x |
- |
- |
Unknown |
* Fish species concerned: various species for Hg; lake trout for PCB's
and DDT (there are Canadian data for plants, mollusca and invertebrates).
Environmental quality standards for contaminants in the lake Federal Dept.
Agriculture standards for Hg, DDT, PCB's in fish tissue. Food safety standards
or tolerance limits for toxic contaminant residue Federal Dept. Agriculture
standards for Hg, DDT, PCB's in food tissue. Supplementary notes (Q) Little
is known about toxics in Lake Champlain. No data describe Hg, PCB's and
DDT in fish tissues. Some data exist concerning levels of trace metals
in lake sediments, and effluent monitoring for toxics is done at major
industrial discharge at a paper mill in the southern part of the lake.
Some toxic materials are known to exist in an abandoned canal in Burlington,
Vt. Past trends of the above concentrations Little data available to detect
trends, but limited data seem to indicate decreased mercury levels in fish
during the past ten years.
I3 EUTROPHICATION Nuisance caused by
eutrophication Cladophora aufwuchs along certain rocky shores; Excessive
weeds in certain bays. Nitrogen and phosphorus loadings to the lake (2,
14)
|
| Sources |
Industrial |
Domestic |
Agricultural |
Natural |
Total |
|
| T-P*1 |
268,000 |
38,800 |
199,030 |
128,770 |
634,600 |
| T-P*2 |
0.237 |
0.034 |
0.176 |
0.114 |
0.561 |
*1 [kg yr-1]. *2 [g m-2 yr-1]. Supplementary notes Non-point sources include
natural and agricultural sources. A report on the trophic status of Lake
Champlain was presented in 1977 (2). The natural background loading of
total phosphorus was estimated to be 0.115 g per m2 of lake surface per
year. Both New York and Vermont have enacted legislation requiring holding
tanks on boats; have banned phosphate in detergents, and Vermont is requiring
waste treatment plants to discharge no more than 1 mg l-1 of Total-P in
waste treatment effluents.
I4 ACIDIFICATION Extent of damage: None. Supplementary notes Some
lakes in the Adriondack Mountains are being severely damaged by acidification.
Acid deposition appears to be killing the source trees in the higher elevations
in Vermont. Detailed studies on mechanisms and political efforts by representation
at the State and National levels are being made.
J. WASTEWATER TREATMENTS
J1 GENERATION OF POLLUTANTS IN THE CATCHMENT AREA (Q)
d) Measurable pollution with limited wastewater treatment.
J2 APPROXIMATE PERCENTAGE DISTRIBUTION OF POLLUTANT LOADS* (2)
|
| Source |
[%] |
|
| Non-point sources |
38.0 |
| Point sources |
|
Municipal (directly into lake) |
5.2 |
|
Industrial (ditto) |
1.5 |
|
Tributary discharge |
86.8 |
|
Atmosphere |
2.7 |
* As estimated from phosphorus loadings.
J3 SANITARY FACILITIES AND SEWAGE (14) Percentage of municipal population
in the catchment area provided with adequate sanitary facilities (on-site
treatment systems) and public sewerage: 100%. Percentage of rural population
with adequate sanitary facilities (on-site treatment systems): Exact figures
not available. Municipal wastewater treatment systems No. of tertiary treatment
systems: 0. No. of secondary treatment systems: 38. No. of primary treatment
system: 20. Industrial wastewater treatment systems No.of industrial wastewater
treatment systems: 1 (pulp and paper plant).
K. IMPROVEMENT WORKS IN THE LAKE
Kl RESTORATION Vermont and New York States are attempting to control nuisance
aquatic weeds in bays and the south lake. Reduction of phosphate loading
to the lake; both States have adopted a detergent phosphate ban, and in
Vermont, selected waste treatment plants must remove phosphorus to 1 mg
l-1.
M. LEGISLATIVE AND INSTITUTIONAL MEASURES FOR UPGRADING LAKE ENVIRONMENTS
(Q)
M1 NATIONAL AND LOCAL LAWS CONCERNED Names of the laws (the year
of legislation)
-
National Rivers and Harbors Act (1899)
-
Flood Control Act (1936, and amended)
-
Federal Water Pollution Control Act (1972, and amended) Responsible authorities
-
Corps of Army Engineers
-
Corps of Army Engineers
-
U.S. Environmental Protection Agency Main items of control
-
Dredging, filling, shore construction, discharges
-
Flood control
-
Water pollution Supplementary notes Both States have enacted a number of
acts to protect the lake. These include banning phosphorus in detergent
and requiring all watercraft to have holding tanks. All waters have been
classified and no discharge is allowed to degrade the quality class.
M2 INSTITUTIONAL MEASURES
-
On August 27, 1988, the Governors of New York and Vermont, and the Premier
of Quebec signed a Memorandum of Understanding to emphasize the increased
cooperation and management of Lake Champlain.
-
In April,1989, the UNESCO Man and the Biosphere Program selected Lake Champlain
and the Adirondack Mountains as a Biosphere Reserve (Lake Champlain/Adirondack
Massif Biosphere Reserve).
-
The Lake Champlain Committee is an organization with about a thousand members
within the entire basin that examines environmental issues as they come
up, engages in study, and is effective in protecting the lake.
M3 RESEARCH INSTITUTES ENGAGED IN THE LAKE ENVIRONMENT STUDIES
-
The University of Vermont, Burlington, Vt.
-
Plattsburgh State University College, Plattsburgh, N. Y.
-
St. Micheal's College, Colchester, Vt.
N. SOURCES OF DATA
-
Questionnaire filled by Dr. E. B. Henson, Dept. of Zoology, University
of Vermont, Burlington, Vermont.
-
U.S. Geological Survey Water-Data Reports NH-VT, 1967-1986.
-
Henson, E. B., & Gruendling, G. K. (1977) The Trophic Status and Phosphorus
Loadings of Lake Champlain. U.S. Environ. Protection Agency, Environ. Res.
Lab., Office of Res. and Development, Ecological Res. Series, EPR-600/3-77-106.
141 pp.
-
Hunt, A. S. & Boardman, C. C. (1970) The Volume of Lake Champlain.
Lake Champlain Studies Centre, Univ. Vt., Res. Rep. No. 3, with 1 map.
-
New England River Basins Comm. (1976) Lake Champlain Planning Guide. 233
pp. + Appendices.
-
Dunnington, F. (1978) Lake Champlain Islands Report, Nov. 1978. Prepared
for the Water Oriented Recreation Task Force, Lake Champlain Basin Study,
New England River Basins Comm. Tech. Rep. 25. 34 pp, maps.
-
National Oceanic and Atmospheric Adm., National Weather Service.
-
Henson, E. B. & Potash, M. (1987) Sampling Strategies for Detecting
Water Quality Trends in Lake Champlain. Completion Rep., U.S. Dept. Int.,
Office of Water Res. and Tech., Proj. No. 03. 44 pp.
-
Lake Champlain Transportation Co. Lake Champlain Ferries. Burlington, Vt.
-
State of Vermont, Dept. of Environmental Conservation, Water Quality Division
(1988) Lay Monitoring Program.
-
Legge, T. N. (1969) A study of the seasonal abundance and distribution
of calanoid copepods in Burlington Bay, Lake Champlain. Unpubl. Ph. D.
Thesis, Univ. Vt., Dept. Zool. 133 pp.
-
Pantas, L. J. (1966) A study of the benthic fauna in Malletts and Shelburne
Bays. Unpubl. M. S. Thesis, Univ. Vt., Dept. Zool. 85 pp.
-
Dadswell, M. J. (1974) Distribution, Ecology, and Postglacial Dispersal
of Certain Crustaceans and Fishes in Eastern North America. Natl. Mus.
Can., Publ. in Zoo. No. 11. 110 pp.
-
Henson, E. B. (1988) Assessment of the presence of Pontoporeia in Lake
Champlain. Res. Grant, Univ. Vt. Comm. Res. and Schlor. Unpubl. Results.
-
Bogdan, K. G. (1978) Estimates of the Annual Loading of Total Phosphorus
to Lake Champlain. N. E. River Basins Comm., Lake Champlain Basin Study,
Eutrophication Task Force. 49 pp.
-
Burlington Water Dept., and Champlain Water District, personal communication.
-
Hunt, A. S. (1977) Shoreline Erosion, Lake Champlain. N. E. River Basins
Comm., Lake Champlain Basin Study, Lands in Transition Task Force. 13 pp.
-
McIntosh, A., School of Natural Resources, Univ. of Vermont, personal communication.

