
SMITH MOUNTAIN LAKE
An aerial view of the lake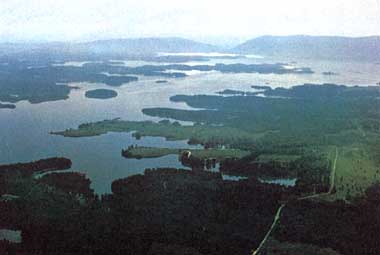
Photo: State Water Control Board, Virginia
A. LOCATION
Virginia, USA.37:2-37:1 N, 79:2-79:5W; 238 m above sea level.
B. DESCRIPTION
Since the mid-1960's, when Smith Mountain Lake was first filled, the lake has been a very popular and important multipurpose resource. An important function of Smith Mountain Lake, and the primary reason for its creation, is to provide hydroelectric power. Appalachian Power Company owns and operates Smith Mountain Dam as well as the dam on Leesville Lake just downstream from Smith Mountain. The two lakes together make it possible to operate Smith Mountain Dam as a "pumped storage" operation. In this arrangement water can be pumped from Leesvile Lake back into Smith Mountain Lake during periods of low power usage. AP Co. can thus be prepared for peak periods of power demand because the "power pool" in Smith Mountain Lake has been maintained at a high level.Smith Mountain Lake is also a very popular recreation site, serving people from throughout the western part of Virginia. Thousands enjoy boating, swimming, fishing and other activities on the lake every year. Many resort homes, condominiums and year-round residences are located on the shores of this reservoir. A significant economic impact on localities around the lake results from recreational businesses, construction of homes and resorts, and the addition of new residents to the communities growing around the shoreline.
Smith Mountain Lake is presently used as a public water supply The water and shoreline of the lake provide habitat for many aquatic plants and animals, as well as birds and other terrestrial wildlife. The protection of aquatic life and other uses already mentioned for this lake is the goal of lake management activities.
Two rivers, the Blackwater and the Roanoke, are the main tributaries to Smith Mountain Lake. The Roanoke River is the larger of the two tributaries and drains a watershed that includes the Roanoke Metropolitan area. The Blackwater River's drainage is mostly rural and agricultural. A 1980 study indicated 72% of the phosphorus loading to Smith Mountain Lake came from the Roanoke River, and that at least 90% of this load was non-point source in origin. Recommendations were made and some of these were implemented. The Blackwater River arm of the lake was also found to have a relatively high eutrophication rate in its upper reach, a result attributed largely to non- point source. Agriculture was the biggest contributor of nutrients from runoff, with dairy farms yielding the highest loads per acre. Progress has been made in controlling some agricultural sources of nutrients through the State Water Control Board agricultural no-discharge permit program. In recent years, a number of these permits, which require approved methods for storage and disposal of liquid animal wastes, have been issued in the Blackwater River drainage area (Q).
C. PHYSICAL DIMENSIONS
| Surface area [km2] | 81 |
| Volume [km3] | 2.8 |
| Maximum depth [m] | 61.0 |
| Mean depth [m] | 35.1 |
| Water level | Regulated |
| Length of shoreline [km] | 805 |
| Residence time [yr] | 3.2-3.5 |
| Catchment area [km2] | 2,570 |
D. PHYSIOGRAPHIC FEATURES
D1 GEOGRAPHICALSketch map: Fig. NAM-37-0l.
Number of outflowing rivers and channels (name): 1 (Roanoke R.).
D2 CLIMATIC
Mean temp. [deg C]
| Jan | Feb | Mar | Apr | May | Jun | Jul | Aug | Sep | Oct | Nov | Dec | Ann. |
|---|---|---|---|---|---|---|---|---|---|---|---|---|
| 3.7 | 4.4 | 8.2 | 13.9 | 19.2 | 23.7 | 25.6 | 24.7 | 21.2 | 15.1 | 9.2 | 4.3 | 14.4 |
| Jan | Feb | Mar | Apr | May | Jun | Jul | Aug | Sep | Oct | Nov | Dec | Ann. |
|---|---|---|---|---|---|---|---|---|---|---|---|---|
| 88 | 74 | 87 | 80 | 94 | 95 | 142 | 141 | 93 | 76 | 77 | 75 | 1,122 |
Sketch map of the lake.
Water temperature [deg C]
Dam station, 1987
[m]
| Depth | Jan | Feb | Mar | Apr | May | Jun | Jul | Aug | Sep | Oct | Nov | Dec |
|---|---|---|---|---|---|---|---|---|---|---|---|---|
| 1 | - | - | - | 13 | - | 26 | - | 28 | - | 17 | - | - |
| 10 | - | - | - | 13 | - | 13 | - | 16 | - | 17 | - | - |
| 20 | - | - | - | 9 | - | 11 | - | 14 | - | 16 | - | - |
| 30 | - | - | - | 7 | - | 9 | - | 13 | - | 14 | - | - |
| 40 | - | - | - | 6 | - | 7 | - | 12 | - | 13 | - | - |
| 50 | - | - | - | 6 | - | 6 | - | - | - | 12 | - | - |
| 60 | - | - | - | 5 | - | - | - | - | - | 12 | - | - |
Notes on water mixing and thermocline formation
Occasional thermocline, but pumped-storage system causes lake to be vertically homogeneous.
E. LAKE WATER QUALITY (Q)
E1 TRANSPARENCY [m]Dam station, 1987
[m]
| Depth | Jan | Feb | Mar | Apr | May | Jun | Jul | Aug | Sep | Oct | Nov | Dec |
|---|---|---|---|---|---|---|---|---|---|---|---|---|
| - | - | - | 1.3 | - | 3.0 | - | 2.6 | - | 2.9 | - | - |
| Depth | Jan | Feb | Mar | Apr | May | Jun | Jul | Aug | Sep | Oct | Nov | Dec |
|---|---|---|---|---|---|---|---|---|---|---|---|---|
| 0.3 | - | - | - | 8.2 | - | 8.7 | - | 8.3 | - | 7.6 | - | - |
| 30.0 | - | - | - | 7.8 | - | 7.7 | - | 6.6 | - | 7.4 | - | - |
| 60.0 | - | - | - | 7.7 | - | 7.7 | - | 6.8 | - | 7.4 | - | - |
Dam station, 1987
[m]
| Depth | Apr | Jun | Aug | Oct |
|---|---|---|---|---|
| 1 | 11 (13)* | 9 (26) | 9 (28) | 6 (17) |
| 10 | 10 (13) | 8 (13) | 4 (16) | 6 (17) |
| 20 | 10 (9) | 8 (11) | 3.5 (14) | 3 (15) |
| 30 | 9 (7) | 8 (9) | 3 (13) | 2 (14) |
| 40 | 9 (6) | 7 (7) | 1.5 (12) | 0 (13) |
| 50 | 9 (6) | 6 (6) | N.D. | 0 (12) |
| 55 | - | 6 (6) | 0.4 (10) | 0 (12) |
| 60 | 8 (5) | N.D. | N.D. | 0 (12) |
Dam station, 1987
[m]
| Depth | Apr | Jun | Aug | Oct |
|---|---|---|---|---|
| 0.3 | 0.31 | 0.60 | 1.5 | N.D. |
Total Kjeldahl-N [mg l-1]
Dam station, 1985-1987
| [m] | 1985 | 1986 | 1987 | |||||||||
|---|---|---|---|---|---|---|---|---|---|---|---|---|
| Depth | Apr | Jun | Aug | Oct | Apr | Jun | Aug | Oct | Apr | Jun | Aug | Oct |
| 0.3 | 0.3 | 0.3 | 0.2 | 0.3 | 0.3 | 0.5 | 0.3 | 0.2 | 0.3 | 0.3 | 0.2 | 0.2 |
Total-P [mg l-1]
Dam station, 1985-1987
| [m] | 1985 | 1986 | 1987 | |||||||||
|---|---|---|---|---|---|---|---|---|---|---|---|---|
| Depth | Apr | Jun | Aug | Oct | Apr | Jun | Aug | Oct | Apr | Jun | Aug | Oct |
| 0.3 | .01 | .01 | .01 | .01 | .02 | .01 | .01 | .03 | .02 | .01 | .01 | <.01 |
F. BIOLOGICAL FEATURES (Q)
F1 FLORAPhytoplankton
Dam station, 1973
| Sampling date | Dominant genera | Cells | Chlorophyll a |
|---|---|---|---|
| [ml l-1] | [micro g l-1] | ||
| 4 Apr 1973 | Stephanodiscus | 4,329 | 4.3 |
| Flagellates | 2,029 | ||
| Melosira | 433 | ||
| Ankistrodesmus | 352 | ||
| synedra | 189 | ||
| Others | 163 | ||
| Total | 7,495 | ||
| 16 Jul 1973 | Lyngbya | 7,994 | 3.9 |
| Chroococcus | 2,858 | ||
| Raphidiopsis | 2,501 | ||
| Flagellates | 1,474 | ||
| Synedra | 1,279 | ||
| Other | 2,679 | ||
| Total | 18,801 | ||
| 26 Sep 1973 | Flagellates | 1,325 | 3.7 |
| Raphidiopsis | 564 | ||
| Merismopedia | 536 | ||
| Dactylococcopis | 479 | ||
| Stephanodiscus | 423 | ||
| Other | 722 | ||
| Total | 4,094 |
Fish
Stripped bass* (Mofone saxatillis), large mouth bass (Micropterus salmoides), small mouth bass (Micropterus dolomieui), shad (Dorosoma alosa).
* Economically important.
F3 PRIMARY PRODUCTION RATE [mg C m3 day-1]
Dam station, 1966-1967
| [m] | 1966 | 1967 | |||
|---|---|---|---|---|---|
| Depth | May | Jul | Aug | Nov | Aug |
| Surface | 9.8 | 24.3 | 38.8 | 19.5 | 13.9 |
| 1 | 19.7 | 42.9 | 34.6 | 20.2 | 10.8 |
| 2 | 17.6 | 26.7 | 41.4 | 18.0 | 21.2 |
| 5 | 17.1 | 44.9 | 28.4 | 2.1 | 14.0 |
| 8 | 5.0 | 6.0 | 1.8 | 0.0 | 19.8 |
| 10 | 0.7 | 1.0 | 0.0 | 0.0 | 3.0 |
| 12 | 0.0 | 0.0 | 0.0 | 0.0 | 0.0 |
G. SOCIO-ECONOMIC CONDITIONS (Q)
G1 LAND USE IN THE CATCHMENT AREA*1980
| Smith Mountain Lake Basin | |||
|---|---|---|---|
| Area [km2] | [%] | Water Supply Plan [%] | |
| Natural landscape | 4,050.48 | 57.2 | |
| Forest | 60.7 | ||
| Agricultural land | |||
| Orchard, etc. | 278.28 | 3.9 | |
| Crop field | 1,954.55 | 27.6 | 8.4 |
| Pasture land | 18.6 | ||
| Residential area | 306.80 | 4.3 | |
| Urban | 10.7 | ||
| Uncategorized | 41.77 | 0.6 | |
| Water | 447.56 | 6.3 | 1.7 |
| Total | 7,079.44 | 100 |
Pine, mixed hardwood forests (most forestland has been harvested at least one time and is in a continual regrowth cycle).
Main kinds of crops
Pasture, orchards, corn, tobacco, hay, alphalfa, fallow/inactive.
Levels of fertilizer application on crop fields: Moderate.
Trends of change in land use
Development of shoreline for residential/recreational use and continuing urbanization of Roanoke area.
G2 INDUSTRIES IN THE CATCHMENT AREA AND THE LAKE
| No. of | Main products or | ||
|---|---|---|---|
| establishments | major industries | ||
| Primary industry | Wood product, tobacco, | ||
| fruits | |||
| Dairy farms | 60-70 | ||
| Secondary industry | Plastics, petroleum | ||
| Tertiary industry | Recreational |
Cattle 55,000.
G3 POPULATION IN THE CATCHMENT AREA
1984
| Population | Major cities | ||
|---|---|---|---|
| Population | density [km-2] | (population) | |
| Urban | 225,000 | Roanoke, Salem, Bedford | |
| Rural | 15,209 | ||
| Total | 240,209 | 93.5 |
H. LAKE UTILIZATION (Q)
H1 LAKE UTILIZATIONSource of water and recreation (swimming, sport-fishing and yachting).
H2 THE LAKE AS WATER RESOURCE
1988: Domestic water, irrigation, industrial water and power plant.
I. DETERIORATION OF LAKE ENVIRONMENTS AND HAZARDS
I1 ENHANCED SILTATIONExtent of damage: Not serious.
Supplementary notes: Localized development problems with runoff.
I2 TOXIC CONTAMINATION
Present status: Detected but not serious.
Environmental quality standards for contaminations in the lake
Surface Public Water Supply Standards*
| Constituent | Concentration [mg l-1] |
|---|---|
| Arsenic | 0.05 |
| Barium | 1.0 |
| Cadmium | 0.01 |
| Chloride | 250 |
| Chromium (total) | 0.05 |
| Copper | 1.0 |
| Foaming agents | |
| (as methylene blue | |
| active substances) | 0.5 |
| Iron | 0.3 |
| Lead | 0.05 |
| Manganese (soluble) | 0.05 |
| Mercury | 0.002 |
| Nitrate (as N) | 10 |
| Phenols | 0.001 |
| Selenium | 0.01 |
| Silver | 0.05 |
| Sulfate | 250 |
| Total dissolved solids | 500 |
| Zinc | 5.0 |
| Endrin | 0.0002 |
| Lindane | 0.004 |
| Methoxychlor | 0.1 |
| Toxaphene | 0.005 |
| 2, 4-D | 0.1 |
| Silvex | 0.01 |
Water quality criteria - metals in water*
| Substance | Value [micro g l-1] |
|---|---|
| Arsenic (trivalent) | 190 |
| Cadmium | 0.7852 (ln (hardness))-3.49 |
| Chromium (hexavalent) | 11 |
| Copper | 0.8545 (ln (hardness))-1.465 |
| Iron | 1000 |
| Lead | 1.266 (ln (hardness))-4.661 |
| Nickel | 0.76 (ln (hardness))+1.06 |
| Selenium (total inorganic) | 35 |
| Zinc(total) | 47 |
Fish tissue contamination standards, Water quality standards for drinking water and swimming.
I3 EUTROPHICATION
Nuisance caused by eutrophication
Algal blooms in early 1970's - attributed to sewage treatment plants in Roanoke Valley upstream.
Nitrogen and phosphorus loadings to the lake [kg yr-1] EPA document, 1973
| Sources | Industrial | Total |
|---|---|---|
| T-N (TKN) | 33,215 | 2,262,870 |
| T-P | 5,475 | 180,360 |
Complete upgrading of STP's in Roanoke River Basin, tracking through the NPDES (National Pollution Discharge Elimination System) permit system. Development of zoning regulations surrounding lake.
I4 ACIDIFICATION
Extent of damage: None.
Past trends in hydrogen ion concentration in lake water
The pH value is quite stable in many data.
J. WASTEWATER TREATMENTS (Q)
J1 GENERATION OF POLLUTANTS IN THE CATCHMENT AREA- d) Measurable pollution with limited wastewater treatment.
| [%] | |
|---|---|
| Non-point sources | 90 |
| Point sources | 10 |
| (21 industrial discharges) |
L. DEVELOPMENT PLANS
Smith Mountain Lake Shoreline Management Plan, 1985; Comprehensive Management Plan for land use sewerage system requirements, erosion and sedimentation controls; flood plain ordinances; subdivision ordinances; etc.M. LEGISLATIVE AND INSTITUTIONAL MEASURES FOR UPGRADING LAKE ENVIRONMENTS (Q)
M2 INSTITUTIONAL MEASURES- Virginia Water Control Board, West Central Regional Office
- Smith Mountain Lake Shoreline Management Plan Technical Advisory Committee and West Piedmont Planning District Commission Staff
N. SOURCES OF DATA
- Questionnaire filled by Dr. Robert T. Ray, Office of Environmental Research and Standards, Commonwealth of Virginia, State Water Control Board.
- Sligh, D. W. & Liptak, T. L. (1988) Lake Monitoring Program 1987. West Central Region. Virginia Water Control Board. 40 pp.
- Smith Mountain Lake Technical Advisory Committee & West Piedmont Planning District Commission (1985) Smith Mountain Lake Shoreline Management Plan, I & II.
- U.S. Environmental Protection Agency (1975) Report on Smith Mountain Reservoir, Bedford, Franklin and Pittsylvania Counties, Virginia. Working Paper 465.
- Simmons G. M. & Neff, S. E. (1969) The Effect of Pumped-straged Reservoir Operation on Biological Productivity and Water Quality. Water Resources Research Centre, Virginia Polytechnic Institute Bulletin 21.
- Virginia Water Control Board (1980) The Impact of Non-point Sources on the Water Quality of Smith Mountain Lake. West Central Regional Office Planning Bulletin 329.
- Court, A. (1974) The climate of the conterminous United States. "World Surveys of Climatology Volume 11, Climates of North America" (ed. Bryson, R. A. & Hare, F. K.), p. 337. Elsevier Scientific Publishing Company Amsterdam-London-New York.
