
CANIAPISCAU RESERVOIR
An aerial view of the lake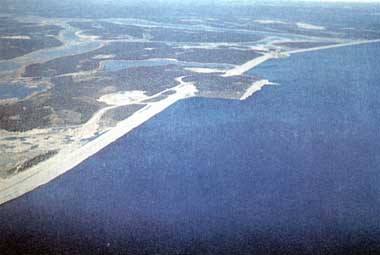
Photo: M. Kislalioglu and F. Berkes
A. LOCATION
Quebec, Canada. 53:5-54:0N, 68:5-70:0W; 535 m above sea level.B. DESCRIPTION
Caniapiscau Reservoir is a man-made lake, created as part of the La Grande Complex (James Bay) Hydro-electric Project. The reservoir incorporates several large lakes, (Delorme, Brisay, Tournon, and Vermouille) which were present before reservoir formation. Lake Caniapiscau, located at the eastern end of the complex, catches 40% of the headstream of Caniapiscau River which formerly drained into the Koksoak River and into Ungava Bay. The impoundment was initiated in October 1981. Since August 1985, waters from the Caniapiscau Reservoir were diverted toward the La Grande 4 Reservoir and thence to LG3 and LG2 Reservoirs and to James Bay.The Caniapiscau Reservoir was constructed by Societe d'Energie de la Baie James, a crown corporation of the Province of Quebec (now a subsidiary of Hydro Quebec) as part of a $16 billion (Can. $) development project called La Grande Complex Phase 1. It regularizes on an annual and interannual basis the whole complex (1) and produces 10,300 megawatts of electricity. The electricity is transported in 5 high voltage lines which are supported by 12,000 hydroelectric transmission towers spread over the longest high voltage transmission system in North America (12).
There is no human habitation near the reservoir. In the past, the area was used for hunting by Cree Amerindian people of the area. Some hunting, trapping and fishing is still carried out in the area by Cree people who travel by road from the town of Chisasibi. As well, there are some outfitting operations (none with permanent structures) for hunting (mainly caribou) and fishing (mainly by tourists).
C. PHYSICAL DIMENSIONS (1, 2, 3)
| Surface area [km2] | 1,500-4,285* |
| Volume [km3] | 14.7-53.8* |
| Maximum depth [m] | 49 |
| Water level | Regulated |
| Normal range of annual water | |
| level fluctuation [m] | 12.9 |
| Length of shoreline [km] | 4,850 |
| Residence time [yr] | 2.2 |
| Catchment area [km2] | 36,800 |
D. PHYSIOGRAPHIC FEATURES
D1 GEOGRAPHICALSketch map: Fig. NAM-35-01.
Sketch map: Fig. NAM-35-02.
Number of outflowing rivers and channels (name): 1 (La Grande R.).
D2 CLIMATIC Climatic data at Schefferville Airport*, 1951-1980 (3a)
Mean temp. [deg C]
| Jan | Feb | Mar | Apr | May | Jun | Jul | Aug | Sep | Oct | Nov | Dec | Ann. |
|---|---|---|---|---|---|---|---|---|---|---|---|---|
| -22.8 | -21.2 | -15.1 | -7.2 | 1.2 | 8.6 | 12.6 | 10.8 | 5.2 | -1.4 | -9.0 | -19.0 | -4.8 |
| Jan | Feb | Mar | Apr | May | Jun | Jul | Aug | Sep | Oct | Nov | Dec | Ann. |
|---|---|---|---|---|---|---|---|---|---|---|---|---|
| 47 | 43 | 42 | 45 | 49 | 74 | 97 | 98 | 83 | 76 | 66 | 49 | 769 |
Sketch map of La Grande Complex (Q).
Sketch map of the lake (Q).
Number of hours of bright sunshine: 1,497 hr yr-1. Solar radiation (Nitchequon)*[MJ m-2 day-1]
| Jan | Feb | Mar | Apr | May | Jun | Jul | Aug | Sep | Oct | Nov | Dec | Ann. |
|---|---|---|---|---|---|---|---|---|---|---|---|---|
| 3.71 | 7.83 | 12.98 | 18.80 | 19.63 | 19.01 | 16.98 | 14.46 | 9.30 | 5.21 | 3.26 | 2.72 | 11.2 |
Water temperature [deg C]
No systematic observations after reservoir formation. For water temperatures before reservoir formation, max. seasonal water temperatures in the Caniapiscau River were 14-16¡¦ (4).
In the present lake (1981-1985), winter 0.8¡¦, summer 11.5¡¦12.4¡¦ (5); surface water summer temperature 8-12¡¦ (2).
Freezing period: November-June.
Mixing type: Dimictic.
E. LAKE WATER QUALITY
E1 TRANSPARENCY [m](2)1981-1985*: 3-4.
* During summer.
E2 pH: Fig. NAM-35-03.
Changes of mean pH of surface water in summer and winter (under ice at the end of ice-covered period) following the impoundment of the reservoir, 1981-1985 (4).
E4 DO: Fig. NAM-35-04.
Changes of mean concentrations of dissolved oxygen [mg l-1] following the impoundment of the reservoir, 1981-1986 (4).
E6 CHLOROPHYLL CONCENTRATION: Fig. NAM-35-05.
Changes of mean concentrations of chlorophyll a [micro l-1] following the impoundment of the reservoir, 1981-1985 (4).
E7 NITROGEN CONCENTRATION (2) NO2-N + NO3-N [mg l-1]: <0.02.
E8 PHOSPHORUS CONCENTRATION Total-P: Fig. NAM-35-06.
Changes of mean concentrations of total phosphorus [micro l-1] following the impoundment of the reservoir, 1981-1985.
E10 PAST TRENDS: Cf. Fig. NAM-35-03, 04, 05 and 06.
Levels of total phosphorus and their variations measured in reservoir
and at its most remote station [micro l-1](1)
| Years after filling | ||||
|---|---|---|---|---|
| 0 | 0 | 1 | 2 | |
| Caniapiscau reservoir | 5 | 8 | 13 | 12 |
| variations | - | 3 | 8 | 7 |
| Dollier station | 5 | 11 | 13 | 13 |
| variations | - | 6 | 8 | 8 |
| Transparency [m] | 3-4 |
| Turbidity [UTN] | <1 |
| Conductivity [micro S cm-1] | 9-11 |
| Total inorganic carbon [mg l-1] | 0.5-1.2 |
| Bicarbonates [mg l-1] | 2.0-3.5 |
| Colour [Hazen unit] | 15-20 |
| Total organic carbon [mg l-1] | 3.5-7.5 |
| Tannins [mg l-1] | 1.0 |
| Nitrates and nitrites [mg l-1] | <0.02 |
| Total phosphorus [mg l-1] | 0.008-0.010 |
| Silica [mg l-1] | 1.2-1.6 |
| Temperature [deg C] | 8-12 |
| Chlorophyll a [micro l-1] | 0.8-1.5 |
F. BIOLOGICAL FEATURES
F1 FLORA Aquatic vegetation not well developed due to reservoir fluctuations in stage height (1). Phytoplankton (6, 7) Relative abundance of principal phytoplankton species found in James Bay Area in 1973 (before impoundment)(6)| Percentage of total no. of cells | |
|---|---|
| Diatomophyta | |
| Asterionella formosa | 6.7% |
| Eunotia pectinalis | 2.5 |
| Melosira granulata | 1.0 |
| M. italica var. subarctica | 0.9 |
| M. italica | 4.2 |
| Tabellaria flocculosa | 8.5 |
| T. flocculosa (f. courte) | 1.4 |
| T. flocculosa (f. longue) | 10.2 |
| T. fenestrata | 0.2 |
| Subtotal | (35.6) |
| Chrysophyta | |
| Dinobryon bavaricum | 9.6 |
| D. bavarium var. vanhoffenii | 10.4 |
| D. divergens | 1.4 |
| Subtotal | (21.4) |
| Zygophyta | |
| Spondylosium planum | 0.4 |
| Mougeotia sp. | 0.5 |
| Subtotal | (0.9) |
| Cyanophyta | |
| Anabaena flos-aquae | 5.2 |
| Aphanothece clathrata | 2.2 |
| Aphanothece sp. | 13.4 |
| Coelosphaerium kuetzingii | 1.3 |
| Microcystis aeruginosa | 0.9 |
| Microcystis minutissima | 3.9 |
| Merismopedia glauca | 1.2 |
| Subtotal | (28.1) |
| Others subtotal | (14.0) |
| Total | 100.0 |
Zooplankton (6, 7)
Relative abundance of principal zooplankton species in the James Bay Area in 1973-74 (before impoundment)(6).
| Rank | |
|---|---|
| 1 | Bosmina longirostris |
| 2 | Leptodiaptomus minutus |
| 3 | Diacyclops bicuspidatus thomasi |
| 4 | Holopedium gibberum |
| 5 | Kellicottia longispina |
| 6 | Conochilus unicornis |
| 7 | Epischura lacustris |
| 8 | Dapnnia longiremis |
| 9 | Leptodiaptomus sicilis |
| 10 | Aglaodiaptomus spatulocrenatus |
| 11 | Cyclops scutifer |
| 12 | Keratella cochlearis |
Species list before impoundment; some information in (7). After impoundment, in the early years (1981) macroinvertebrate benthic fauna coinsisted of more than 50% chironomids. Other groups recorded were Trichoptera, Ephemeroptera and Oligochaeta.
Fish
Abundance of fish species before impoundment in the Caniapiscau River basin based on a total catch of 9,015 individuals collected in 1973-1976 (6). For detailed species list by sampling station, see (7).
| Salmo salar* | 1,568 |
| Salvelinus fontinalis* | 4,804 |
| S. namaycush* | 493 |
| Coregonus clupeaformis* | 635 |
| Prosopium cylindraceum | 447 |
| Esox lucius* | 59 |
| Couesius plumbeus | 134 |
| Semotilus atromaculatus | 3 |
| Catostomus catostomus | 642 |
| C. commersoni | 158 |
| Lota lota* | 21 |
| Stizostedion vitreum* | |
| Cottus bairdi | 13 |
| C. cognatus | 8 |
| Total | 9.015 |
Annual fish catch [metric tons]
No commercial catch; subsistence fishery >l.
F7 NOTES ON THE REMARKABLE CHANGES OF BIOTA IN THE LAKE IN RECENT YEARS
Changes in biota still relatively rapid, due to recent formation of the reservoir.
G. SOCIO-ECONOMIC CONDITIONS
G1 LAND USE IN THE CATCHMENT AREA| Area [km2] | [%] | |
|---|---|---|
| Natural landscape | 100 | (breakdown not available) |
| Agricultural land | None | |
| Residential area | None | |
| Total | 100 |
This is an open lichen woodland, a park-like forest dominated by widely spaced Picea mariana with a thick under-carpet of yellow-grey lichen. Some closed coniferous forest stands occur in the more moist areas. Areas of muskeg and bog are also scattered throughout this forest. A forest-tundra transition zone in which the lichen woodland is replaced by lichen dominated tundra on more exposed land (8). In terms of ecological regions, this area is described as a combination of "mountain lichen heath" and "wooded black spruce and lichen heath" (9). G2 INDUSTRIES IN THE CATCHMENT AREA AND THE LAKE (5)
1988
| Gross product | No. of | Main products | ||
|---|---|---|---|---|
| per year | persons | or major | ||
| (US$) | engaged | industries | ||
| Primary industry | ||||
| Fur production | 50-100,000 (est.) | 30 | Skins |
1988: No permanent population in the catchment area.
H. LAKE UTILIZATION
H1 LAKE UTILIZATIONSightseeing and tourism (outfitting operations for Caribou hunting; no permanent camps), recreation (sport-fishing), fisheries (native subsistence fisheries) and others (storage reservoir for La Grande Hydro-electric Complex).
I. DETERIORATION OF LAKE ENVIRONMENTS AND HAZARDS
I1 ENHANCED SILTATIONExtent of damage: No data on rate of siltation or sedimentation.
I2 TOXIC CONTAMINATION
Present status (Q)
There has been a major mercury increase in reservoirs at the La Grande Complex as a result of impoundment. Concentrations of this metal has increased markedly since flooding at reservoirs. Mercury has been measured in Caniapiscau reservoir fish in concentrations up to 1 ppm (on wet weight basis, muscle tissue). In Canada, the allowable level for mercury in fish is 0.5 ppm. Mean levels of mercury in fish [mg kg-1] found in 1984 in the river downstream and one lake (Cambrian) unaffected by flooding ("control")(3).
| Caniapiscau region | |||
|---|---|---|---|
| species | Reservoir | River | Cambrian Lake |
| Lake Whitefish | 0.41 | 0.17 | 0.21 |
| (400 mm) | |||
| Lake Trout | 1.04 | 0.56 | 0.75 |
Natural eutrophication only (the area is naturally oligotrophic).
Nitrogen and phosphorus loadings to the lake
Increases in phosphorus concentration following the filling of the reservoir can be seen from item E8.
I4 ACIDIFICATION
No systematic data available.
I5 OTHER HAZARDS (12)
Protruding tree tops and lignified debris in water and beached along the shore.
J. WASTEWATER TREATMENTS (Q)
None in area.K. IMPROVEMENT WORKS IN THE LAKE (Q)
No wood clearing program attempted in this reservoir.M. LEGISLATIVE AND INSTITUTIONAL MEASURES FOR UPGRADING LAKE ENVIRONMENTS (Q)
M1 NATIONAL AND LOCAL LAWS CONCERNEDNames of the laws (the year of legislation)
- La Loi la Qualite de l'Environment (1978)
- James Bay and Northern Quebec Agreement (1975)
- Mercury Agreement (1980) Responsible authorities
- Government of Quebec, Ministry of Environment
- Hydro-Quebec, Governments of Quebec and Canada
- Societe d'Energie de la Baie James, Quebec and Canada
- Hydro-Quebec; Government of Quebec Main items of control
- Environmental impacts
- Impacts from reservoir management
- Impacts from reservoir construction
- High mercury levels
- Societe d'Energie de la Baie James
- Hydro-Quebec
- Environment departments of the above agencies
N. SOURCES OF DATA
(Q) Questionnaire filled by Drs. M. Kislalioglu and F. Berkes,
Institute of Urban and Environmental Studies,
Brock University, St.
Catharines,Ontario, Canada.
(1) Roy, D., Laperie, M., Bouldreault, J., Boucher, R., Schetagne, R. &
Therien, N. (1986) Ecological
Monitoring Program of the La Grande Complex
1978-1984. Summary Report.
Societe d'Energie de la Baie James, Montreal.
(2) Sur Equipment de l'Amenagement de La Grande
2. Rapport sur les Etudes
d'Avant-projet, Volume 3 (1985)
Hydro-Quebec Societe d'Energie de la Baie
James, Montreal.
(3) Boucher, R. & Schetagne, R. (1983)
Repercussions de la Mise en Eau des
Reservoirs de La Grande 2 et
Opinaca sur la Concentration de Mercure dans
les Poissons. Societe
d'Energie de la Baie James, Montreal.
(3a) Environment Canada Canadian Climate Normals,
1951-1980. Atmospheric
Environment Service.
(4) Roy, D., Boucher, R., Pinel-Alloul, B., Schetagne,
R. & Boudreault, J.
(1980) Document d'Information
per les Members du ComiteConsultatif du
Reseau de Surveillance Ecologique.
Societe d'Energie de la Baie James,
Montreal.
(5) Roy, D., Plante, M., Schetagne, R. & Boudreault,
T. (1982) Rapport
d'Etape du Reseau de Surveillance
Ecologique. Societe d'Energie de la
Baie James, Montreal.
(6) Connaissance du Milieu des Territoires de
la Baie James et du Nouveau-
Quebec (1978) Societe
d'Energie de la Baie James,Montreal.
(7) Magnin, E. (1977) Ecologie des Eaux
Douces du Territoire de la Baie
James. Societe d'Energie
de la Baie James, Montreal.
(8) Rowe, J. S. (1972) Forest Regions of
Canada. Canadian Forest Service,
Department of the Environment,
Ottawa.
(9) Environmental Studies, James Bay Territory
1972-1979; Summary Report
(1982) Societe de Developpement
de la Baie James/Environment Canada,
Ottawa.
(10) Orientation do Developpement et de l'Amenagement
du Territoire de la Baie
James (1980) Societe
de Developpement de la Baie James, Montreal.
(11) Larry, K. (1982) Quebec's northern
dynamo. National Geographic, 161
(3): 406-418.
(12) Societe d'Energie de la Baie James (1988)
La Grande Riviere: A
Development in Accord
with its Environment. 62 pp. Societe d'Energie de
la Baie James, Montreal,
Quebec.
