GREAT CENTRAL LAKE
Great Central Lake
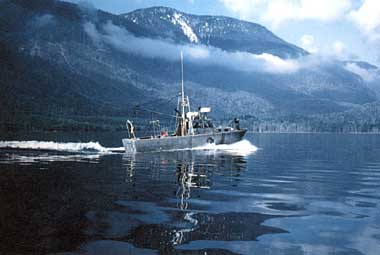
Photo: J. G. Stockner
A. LOCATION
British Columbia, Canada.* 49:2N, 125:5W; 82 m above sea level. * Vancouver Island.B. DESCRIPTION
Great Central Lake is one of many large and deep lakes which exist in the mountainous spine of Vancouver Island. Having a maximum depth of 294 m, the lake is the second deepest on the island. The mountainous terrain is composed of plutonic rocks of the Mesozoic era and the surficial deposits in the drainage basin are glacial or glacio-marine in origin. The climate is cool and wet in the winter and warm and dry during the summer. Snow is rare at the lake's elevation but there are accumulations of snow at higher elevations in some years. There is extensive logging in the watershed, but shoreline development is extremely sparse and limited to the outlet area. There are no settlements in the drainage basin. While the lake serves as an excellent place for recreational pursuits (e. g. swimming, boating, sport-fishing), its importance to the regional economy and the science of lake management rests with the initial development of the Lake Fertilization Component of the federal/provincial Salmonid Enhancement Program. One of the important species of Pacific salmon (sockeye or Onchorhynchus nerka) spends its first year of growth in many lakes in the Pacific northwest region of North America and their survival at sea (where they grow to maturity in 3 years) is dependant on their size and condition when they leave the lake after a spring and summer of feeding on zooplankton. The hypothesis that the size and condition of the sockeye during the first growing season could be enhanced through fertilization of the surface waters with inorganic nitrogen and phosphorus and that this would lead to greater returns of sockeye to be harvested in the sea when they returned was tested in Great Central by the Pacific Biological Station from 1970 to 1976 (1). The numbers of returning fish increased more than 7 times in those early trials and this success led to the fertilization of many sockeye rearing lakes along the coast of British Columbia (Q).C. PHYSICAL DIMENSIONS (Q, 1a)
| Surface area [km2] | 51 |
| Volume [km3] | 6.324 |
| Maximum depth [m] | 294 |
| Mean depth [m] | 124 |
| Water level | Regulated |
| Normal range of annual water | |
| level fluctuation [m] | 1-1.5 |
| Length of shoreline [km] | 76 (1a) |
| Residence time [yr] | 3.7 |
| Catchment area [km2] | 308 |
D. PHYSIOGRAPHIC FEATURES
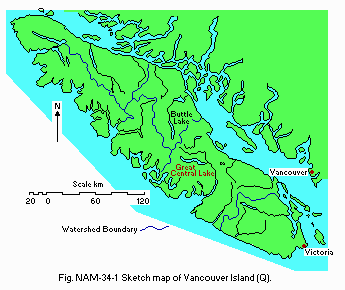
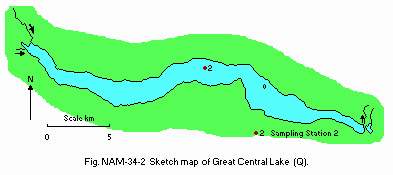
D1 GEOGRAPHICAL Sketch map: Fig. NAM-34-0l. Bathymetric map: Fig. NAM-34-02. Names of main islands: The number of main islands is one (no name). Number of outflowing rivers and channels (name): 1 (Stamp R.).D2 CLIMATIC (2) Climatic data at Port Alberni, 1951-1980 Mean temp. [deg C]
| Jan | Feb | Mar | Apr | May | Jun | Jul | Aug | Sep | Oct | Nov | Dec | Ann. |
|---|---|---|---|---|---|---|---|---|---|---|---|---|
| 0.8 | 3.0 | 4.8 | 8.1 | 11.9 | 14.9 | 17.7 | 17.7 | 14.8 | 10.0 | 4.8 | 2.4 | - |
| Jan | Feb | Mar | Apr | May | Jun | Jul | Aug | Sep | Oct | Nov | Dec | Ann. |
|---|---|---|---|---|---|---|---|---|---|---|---|---|
| 294 | 237 | 214 | 123 | 72 | 48 | 38 | 43 | 89 | 217 | 292 | 352 | 2,019 |

Sketch map of Vancouver Island (Q).

Bathymetric map [m](Q).
Number of hours of bright sunshine (Nanaimo): 1,531 hr yr-1. Solar radiation (Nanaimo)[MJ m-2 day-1]
| Jan | Feb | Mar | Apr | >May | Jun | Jul | Aug | Sep | Oct | Nov | Dec | Ann. |
|---|---|---|---|---|---|---|---|---|---|---|---|---|
| 2.95 | 5.85 | 10.47 | 15.90 | 20.96 | 22.07 | 23.66 | 19.50 | 13.61 | 7.83 | 3.74 | 2.27 | 12.3 |
GCL-2*1, 1984-1985 [m]
| Depth | Jan | Feb | Mar | Apr | May | Jun | Jul | Aug | Sep | Oct | Nov | Dec |
|---|---|---|---|---|---|---|---|---|---|---|---|---|
| S*2 | - | 4.1 | 5.3 | 8.1 | 10.4 | 15.9 | 20.8 | 20.3 | 18.3 | 13.3 | 8.3 | 5.5 |
| ME*3 | - | 4.0 | 4.2 | 7.0 | 9.1 | 13.6 | 18.0 | 19.4 | 17.8 | 11.3 | 8.7 | 5.7 |
E. LAKE WATER QUALITY
E1 TRANSPARENCY [m](3, 4) GCL-2, 1984-1985| Jan | Feb | Mar | Apr | May | Jun | Jul | Aug | Sep | Oct | Nov | Dec |
|---|---|---|---|---|---|---|---|---|---|---|---|
| - | 11.0 | 11.4 | 10.8 | 9.8 | 8.6 | 9.4 | 10.0 | 10.6 | 8.6 | 8.0 | 11.5 |
| [m] | ||||||||||||
|---|---|---|---|---|---|---|---|---|---|---|---|---|
| Depth | Jan | Feb | Mar | Apr | May | Jun | Jul | Aug | Sep | Oct | Nov | Dec |
| S* | - | 6.40 | 6.45 | 6.35 | 6.50 | 6.45 | 6.26 | 6.40 | 6.90 | 7.30 | 7.05 | 7.00 |
| [m] | ||||||||||||
|---|---|---|---|---|---|---|---|---|---|---|---|---|
| Depth | Jan | Feb | Mar | Apr | May | Jun | Jul | Aug | Sep | Oct | Nov | Dec |
| ME* | - | 22.50 | 20.80 | 21.5 | 26.70 | 26.10 | 23.15 | 19.75 21.95 - | 28.60 | 19.20 |
| [m] | ||||||||||||
|---|---|---|---|---|---|---|---|---|---|---|---|---|
| Depth | Jan | Feb | Mar | Apr | May | Jun | Jul | Aug | Sep | Oct | Nov | Dec |
| ME* | - | 0.50 | 0.47 | 0.69 | 1.05 | 1.19 | 0.52 | 0.78 | 0.99 | 1.90 | 1.49 | 0.96 |
| [m] | ||||||||||||
|---|---|---|---|---|---|---|---|---|---|---|---|---|
| Depth | Jan | Feb | Mar | Apr | May | Jun | Jul | Aug | Sep | Oct | Nov | Dec |
| ME* | - | 0.19 | 0.27 | 0.20 | 0.17 | 0.18 | 0.33 | 0.16 | 0.16 | 0.14 | 0.21 | 0.54 |
| [m] | ||||||||||||
|---|---|---|---|---|---|---|---|---|---|---|---|---|
| Depth | Jan | Feb | Mar | Apr | May | Jun | Jul | Aug | Sep | Oct | Nov | Dec |
| ME* | - | <1.0 | <1.0 | 1.0 | 1.65 | 1.80 | 1.42 | 1.73 | 1.90 | 2.23 | 1.35 | 1.40 |
E10 PAST TRENDS
Great Central remains as it always has been - oligotrophic! Chlorophyll a in the fertilized area doubled to present values. Nutrient concentration changes were not detectable (1).
F. BIOLOGICAL FEATURES
F1 FLORA (Q)Emerged macrophytes: Not surveyed (very sparse).
Floating macrophytes: Not surveyed (probably do not occur).
Submerged macrophytes
Not surveyed (because of steep litteral slope, little occurrence of any submerged macrophytes; mostly epilithic periphyton-diatom dominated).
Phytoplankton
Cyclotella, Rhizosolenia. Diatoms dominant but at low density due to low nutrient levels.
F2 FAUNA (Q) Zooplankton: Eubosmina, Holopedium, Diacyclops, miscellaneous rotifers. Fish Onchorhynchus nerka* (andromous), Salmo gairdneri* (resident and andromous), Salvelinus malma, Pungitius pungitius, cutthroat, trout.
* Economically important.
F3 PRIMARY PRODUCTION RATE [mg C m-2 day-1](3)
GCL-2, 1984 Net production*
| Ann. | ||||||||||||
|---|---|---|---|---|---|---|---|---|---|---|---|---|
| Jan | Feb | Mar | Apr | May | Jun | Jul | Aug | Sep | Oct | Nov | Dec | total |
| - | 66.2 | 19.7 | 46.9 | 72.7 | 307.6 | 163.8 | 155.5 | 176.2 | 47.4 | 54.5 | 33.3 | 1,144 |
Zooplankton [mg l-1]
GCL-2, 1984
| Jan | Feb | Mar | Apr | May | Jun | Jul | Aug | Sep | Oct | Nov | Dec |
|---|---|---|---|---|---|---|---|---|---|---|---|
| - | 4.20 | 2.20 | 2.15 | 2.25 | 3.65 | 25.5 | 11.3 | 7.70 | 3.65 | 2.40 | 1.90 |
Annual fish catch
No commercial fishery in the lake.
No creel census data available from sport-fishery.
F6 PAST TRENDS (Q)
Lake primary productivity is stable and steady at very low levels. Elevated primary production in fertilized zone of lake, about 2 times higher than in central untreated areas. Zooplankton standing stock increased 9 times in the fertilized area. Numbers of species of zooplankton increased due to fertilization.
G. SOCIO-ECONOMIC CONDITIONS (5)
G1 LAND USE IN THE CATCHMENT AREA| Area [%] | |
|---|---|
| Natural landscape | |
| Woody vegetation | 60*1 |
| 40*2 | |
| Agricultural land | |
| Crop field | None |
| Others | <1*3 |
| Total | 100 |
*2 Mature growth P. menziesii
*3 Fishing lodge-cabins, store
Types of important forest or scrub vegetation
Pseudotsuga menziesii, Tsuga heterophylla, Thuja plicata.
Trends of changes in land use in recent years
None; active logging at turn of century, then again in 1950's-1960's.
G2 INDUSTRIES IN THE CATCHMENT AREA AND THE LAKE
1988
| Main products or major industries | |
|---|---|
| Primary industry | |
| Forestry | Wood products & timber production |
| Fisheries | Recreational |
| Secondary industry | A few small tourist/recreational fishing |
| lodges are located on lake with small | |
| seasonal employment. | |
| Gross product unknown. |
G3 POPULATION IN THE CATCHMENT AREA
1988
| Population | |
|---|---|
| Rural | 30-40 permanent residents |
| (plus 20-30 summer residents) |
H. LAKE UTILIZATION (Q)
H1 LAKE UTILIZATIONSource of water, sightseeing and tourism (no. of visitors in 1988: est. 2,000- 3,000), recreation (swimming, sport-fishing) and fisheries (sport for cutthroat, rainbow trout; rearing for juvenile salmon).
H2 THE LAKE AS WATER RESOURCES
1988
| Use rate | |
|---|---|
| Domestic | N.A.*1 |
| Irrigation | N.A. |
| Others*2 |
*2 Water supply for DF & 0 salmon hatchery, Robertson Creek.
I. DETERIORATION OF LAKE ENVIRONMENTS AND HAZARDS (Q)
I1 ENHANCED SILTATIONExtent of damage: None.
I2 TOXIC CONTAMINATION
Present status
Because of its remote location, the lake is still relatively pristine and has negligible levels of those few contaminants which have been analyzed.
I3 EUTROPHICATION
Eutrophication (in terms of biological productivity) has occurred but other lake characteristics still place the lake near the ultra-oligotrophic/ oligotrophic boundary.
I4 ACIDIFICATION
Extent of damage: None.
J. WASTEWATER TREATMENTS (Q)
J1 GENERATION OF POLLUTANTS IN THE CATCHMENT AREA- a) Pristine lake environments.
K. IMPROVEMENT WORKS IN THE LAKE (Q)
K3 OTHERS (Q)Fertilization was initiated in 1970, discontinued between 1973-75 during the test phase, then begun again as a formal program, and is to continue until 1995.
Lake Fertilization in 1988: 2.9 mg (whole lake basis) P m-2 wk-1 (0.05 g m-2 yr-1); 18 weeks (May 16-Sept. 13); N:P ratio 35:1. This rate represents 100% increase in inorganic nitrogen supply and a 450% increase in the phosphate supply to the 30 m water column on an annual basis. Only about 5 km2 are treated using forest fire tanker planes.
L. DEVELOPMENT PLANS (Q)
Forecast to remain basically underdeveloped with some continuing logging and related forestry activity on drainage basin.M. LEGISLATIVE AND INSTITUTIONAL MEASURES FOR UPGRADING LAKE ENVIRONMENTS (Q)
M1 NATIONAL AND LOCAL LAWS CONCERNED Names of the laws (the year of legislation)- B. C. Waste Management Act (1982)
- B. C. Water Management Act (1979)
- Environmental Protection Act
- Federal Fisheries Act Responsible authorities
- Government of British Columbia, Ministry of Environment
- Government of British Columbia in cooperation with the Government of Canada, Department of the Environment, Department of Fisheries and Oceans Main items of control
- Discharge of waste
- Licensing water use
- Prevention of environmentally damaging activities
- Management and protection of fisheries Supplementary notes Indirect control through forestry regulation and environmental impact assessment.
Department of Fisheries and Oceans, West Vancouver Laboratory, Vancouver (monitors water quality as part of lake fertilization program).
M3 RESEARCH INSTITUTES ENGAGED IN THE LAKE ENVIRONMENT STUDIES
See above.
N. SOURCES OF DATA
- Questionnaire filled by Dr. J. G. Stockner, Department of Fisheries and Oceans, West Vancouver Laboratory, West Vancouver, B. C.
- LeBrasseur, R. J., McAllister, C. D., Barraclough, W. E., Kennedy, O. D., Manzer, J., Robinson, D. & Stephens, K. (1978) Enhancement of Sockeye Salmon (0. nerka) by lake fertilization in Great Central Lake: Summary Report. J. Fisheries Research Board of Canada, 35: 1580-1596. la) National Topographic System, 1: 50,000, Sheet 92F/6, Edition 4 (1980). Surveys & Mapping Branch, Department of Energy, Mines & Resources, Ottawa.
- Canadian Climate Normals 1951-1980, British Columbia. Environment Canada, Atmospheric Environment Service.
- Nidle, B. H. & Shortreed, K. S. (1985) Limnological Results from the 1984 British Columbia Lake Enrichment Program. Can. MS. Rep. Fish. Aquat. Sci. 1834. 202 pp. (This reference includes for 1984 at 2 stations: the surface temperature, epilimnetic temperature, Secchi depth, mean epilimnetic pH, total dissolved nitrogen, epilimnetic nitrate, epilimnetic ammonia, total phosphorus, total dissolved solids, total chlorophyll, mean euphotic zone hourly primary production, mean euphotic zone daily primary production, integrated primary production, zooplankton biomass and ash free dry weight of zooplankton).
- Nidle, B. H. & Shortreed, K. S. (1987) Limnological Results from the 1985 British Columbia Lake Enrichment Program. Can. Data Rep. Fish. Aquat. Sci. 613. 60 pp. (This reference includes for 1985 at 2 stations: the surface temperature, mean epilimnetic temperature, Secchi depth, mean epilimnetic total dissolved nitrogen, mean epilimnetic nitrate, mean epilimnetic ammonia, total phosphorus, total dissolved solids, total chlorophyll, zooplankton biomass and ash-free dry weight).
- National Topographic System, 1:250,000, Sheet 92F (1966). Surveys & Mapping Branch, Department of Energy, Mines & Resources, Ottawa.
SOURCES OF INFORMATION
- Department of Fisheries and Oceans, Canadian Manuscript Reports of Fisheries and Aquatic Sciences. No. 1635 Costella, A. C., Nidle, B., Bocking, R. & Shortreed, K. S. (1982) Limnological Results from the 1980 Lake Enrichment Program. 291 pp. No. 1706 Costella, A. C., Nidle, B. & Shortreed, K. S. (1983) Limnological Results from the 1982 British Columbia Lake Enrichment Program. 227 pp. No. 1752 Nidle, B. H., Shortreed, K. S. & Masuda, K. V. (1984) Limnological Results from the 1983 British Columbia Lake Enrichment Program. 212 pp. No. 1834 Nidle, B. H. & Shortreed, K. S. (1985) Limnological Resultsfrom the 1984 British Columbia Lake Enrichment Program. 202 p.
- Department of Fisheries and Oceans, Canadian Technical Reports of Fisheries and Aquatic Sciences. No. 924 Stockner, J. G., Shortreed, K. S. & Stephens, K. (1980) The British Columbia Lake Fertilization Program: Limnological Results from the First 2 Years of Nutrient Enrichment. 91 pp. No. 979 Stockner, J. G. & Costella, A. C. (1980) The Paleolimnology of Eight Sockeye Salmon (Oncorhynchus nerka) Nursery Lakes in British Columbia, Canada. 93 pp. No. 995 Shortreed, K. S. & Stockner, J. G. (1981) Limnological Results from the 1979 British Columbia Lake Enrichment Program. 71 pp.
- Pacific Environment Institute, Fisheries and Marine Service Technical Reports. No. 802 Shortreed, K. S. & Stockner, J. G. (1978) Response of Attached Algae to Whole-lake Fertilization Experiments in Five British Columbia Coastal Lakes. 25 pp. No. 803 Stockner, J. G., Stephens, K. & Shortreed, K. S. (1978) Artificially Induced Upwelling in Great Central Lake, British Columbia. 19 pp. No. 880 Costella, A. C., Shortreed, K. S. & Stockner, J. G. (1979) Phytoplankton Fractionation Studies in Great Central Lake, Britis Columbia: a Nutrient-enriched Sockeye Salmon (Oncorhynchus nerka) Nursery Lake. 27 pp.
ADDITIONAL REFERENCES
- Stockner, J. G. (1981) Whole-lake fertilization for the enhancement of sockeye salmon (Oncorhynchus nerka) in British Columbia, Canada. Verh. Internat. Verein. Limnol., 21: 293-299.
- Stockner, J. G. & Shortreed, K. S. (1985) Whole-lake fertilization experiments in coastal British Columbia lakes: empirical relationships between nutrient inputs and phytoplankton biomass and production. Can. J. Fish. Aquat. Sci., 42(4): 649-658.
- Stockner, J. G. (1987) Lake fertilization: the enrichment cycle and lake sockeye salmon (Oncorhynchus nerka) production. "Sockeye Salmon (Oncorhynchus nerka) Population Biology and Future Management" (ed. Smith, H. D., Margolis, L. & Wood, C. C.)(Canadian Special Publication of Fisheries and Aquatic Sciences 96), pp. 198-215. Department of Fisheries and Oceans, Ottawa.
- Shortreed, K. S., Costella, A. C. & Stockner, J. G. (1984) Periphyton biomass and species composition in 21 British Columbia lakes: seasonal abundance and response to whole-lake nutrient additions. Canadian Journal of Botany, 62(5): 1022-1031.


