
SOUTHERN INDIAN LAKE
An aerial view of the lake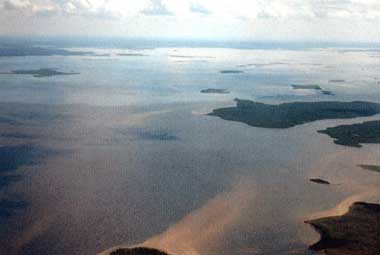
Photo: R. E. Hecky
A. LOCATION
Manitoba, Canada.56:6-57:1N, 98:9-99:9W; 258* m above sea level.
* 257-258 m Manitoba Hydro operating range.
B. DESCRIPTION
Southern Indian Lake is a widening of the Churchill River located in northern Manitoba. It has a long complex shoreline with many islands, long peninsulas and deep bays. It is 145 km long and up to 19 km wide (2). The Churchill River rises in Alberta, drains central Saskatchewan and a portion of northern Manitoba into Southern Indian Lake.Southern Indian Lake may be divided into seven regions using natural boundaries. Opachuanau Lake forms an eighth region.
The lake is situated on the Precambrian Shield. The dominant surface material is glaciolacustrine clays deposited by glacial Lake Agassiz. The relief is greater in the southern region. Prior to 1976 Southern Indian Lake drained into Hudson's Bay via the lower Churchill River. In that year Manitoba Hydro diverted the greater portion of the Churchill River flows from Southern Indian Lake at South Bay into the Nelson River drainage system and via that river into Hudson's Bay. This was accomplished by damming the Churchill River at Missi Falls, constructing a diversion channel at South Bay and then raising the lake level 3 m to permit gravity flow into the headwaters of the Rat River tributary of the Nelson River.
Before 1974 Southern Indian Lake was remote and accessible only by air and boat in the summer and by air and winter road in the winter. This remoteness permitted the lake to remain relatively immune from human influence except for a commercial whitefish fishery organized in 1942. Early in the 20th century people from the Nelson House Indian Reserve settled on Southern Indian Lake and established the community of Southern Indian Lake (population approximately 700 people in 1974). The present economy is composed of subsistence hunting and fishing, a severely damaged commercial fisheries and trapping supplemented by government services and compensation payments (Q).
C. PHYSICAL DIMENSIONS (1, 3)
| Surface area [km2] | 2,391*1 |
| Volume [km3] | 23.4 |
| Maximum depth [m] | 30 |
| Mean depth [m] | 9.8 |
| Water level | Regulated |
| Normal range of annual water | |
| level fluctuation [m] | 0.9*2 |
| Length of shoreline [km] | 3,798*1 |
| Residence time [yr] | |
| (Region 1) | 0.17 (1) |
| (Region 2) | 1.4 (1) |
| Catchment area [km2] | 242,000 |
D. PHYSIOGRAPHIC FEATURES
D1 GEOGRAPHICALSketch map: Fig. NAM-33-0l.
Sketch map: Fig. NAM-33-02.
Number of outflowing rivers and channels (name) 2 (Churchill R. and South Bay Diversion Channel).
Sketch map of Prairie Provinces drainage (Q).
Sketch map of the lake with location of sampling stations (Q).
D2 CLIMATIC Climatic data at Southern Indian Lake, 1978-1987
Mean temp. [deg C]
| Jan | Feb | Mar | Apr | May | Jun | Jul | Aug | Sep | Oct | Nov | Dec | Ann. |
|---|---|---|---|---|---|---|---|---|---|---|---|---|
| -24.1 | -20.3 | -13.6 | -3.4 | 5.3 | 11.5 | 15.7 | 14.4 | 7.4 | 0.7 | -12.0 | -21.2 | -3.3 |
| Jan | Feb | Mar | Apr | May | Jun | Jul | Aug | Sep | Oct | Nov | Dec | Ann. |
|---|---|---|---|---|---|---|---|---|---|---|---|---|
| 12 | 10 | 12 | 18 | 21 | 27 | 52 | 45 | 31 | 25 | 16 | 11 | 279 |
Solar radiation (Churchill A)[MJ m-2 day-1]
- Federal Fisheries Act Responsible authorities
- Department of Fisheries
- Manitoba Ministry of the Environment, Fisheries Branch Main items of control
- Protection of fish species
- Fishing and hunting regulations
- Monitoring mercury levels in fish muscle
- Department of Fisheries and Oceans, Freshwater Institute, Winnipeg, Manitoba (research began in 1972 and is continuing to date)
- Questionnaire filled by Dr. R. E. Hecky, Canada Department of Fisheries and Oceans, Freshwater Institute, Winnipeg, Manitoba.
- McCullough, G. K. (1981) Water Budgets for Southern Indian Lake, Manitoba, Before and After Impoundment and Churchill River Diversion, 1972-79. Can. Manuscr. Rep. Fish. Aquat. Sci. 1620. 22 pp.
- Cranstone, J. R. (1972) Geology of the Southern Indian Lake Area, Northeastern Portion. Manitoba Department of Mines, Resources and Environmental Management.
- Newbury, R. W., McCullough, G. K. & Hecky, R. E. (1984) The Southern Indian Lake impoundment and Churchill River diversion. Can. J. Fish. Aquat. Sci., 41: 548-557.
- Canadian Climate Normals (1951-80) Environment Canada, Atmospheric Environment Service.
- Hecky, R. E. (1984) Thermal and optical characteristics of Southern Indian Lake before, during and after impoundment and Churchill River diversion. Can. J. Fish. Aquat. Sci., 41: 579-590.
- Hecky, R. E. & Guildford, S. J. (1984) Primary productivity of Southern Indian Lake before, during and after impoundment and Churchill River diversion. Can. J. Fish. Aquat. Sci., 41: 591-604.
- Hecky, R. E., Kling, H. J. & Brunskill, G. J. (1986) Seasonality of phytoplankton in relation to silicon cycling and interstitial water circulation in large shallow lakes of central Canada. Hydrobiologia, 138: 117-126.
- Planas, D. & Hecky, R. E. (1984) Comparison of phosphorous turnover times in northern Manitoba reservoirs with lakes of the Experimental Lakes Area. Can. J. Fish. Aquat. Sci., 41: 605-612.
- Lysek, W. Manitoba Department of Natural Resources, Fisheries Branch, Winnipeg, Manitoba R3H 0W9 (204-945 7796).
- Patalas, K. & Salki, A. (1984) Effects of impoundment and diversion on the crustacean plankton of Southern Indian Lake. Can. J. Fish. Aquat. Sci., 41: 613-637.
- Patalas, K. (1975) The crustacean plankton communities of fourteen North American great lakes. Int. Verein. Limnol. Verh., 19: 504-511.
- Wiens, A. P. & Rosenberg, D. M. (1984) Effect of impoundment and river diversion on profundal macrobenthos of Southern Indian Lake, Manitoba. Can. J. Fish. Aquat. Sci., 41: 638-648.
- Rosenberg, D. M., Bilyj, B. & Wiens, A. P. (1984) Chironimidae (Diptera) emerging from the littoral zone of reservoirs with special reference to Southern Indian Lake, Manitoba. Can. J. Fish. Aquat. Sci., 41: 672-681.
- Bodaly, R. A., Strange, N. E. & Fudge, R. J. P. (1988) Mercury Content of Fish in the Southern Indian Lake and Issett Reservoirs, Northern Manitoba, Before and After Churchill River Diversion. Can. Data Rep. Fish. Aquat. Sci. 706. 59 pp.
- Bodaly, R. A., Hecky, R. E. & Fudge, R. J. P. (1984) Increases in fish mercury levels in lakes flooded by the Churchill River diversion, northern Manitoba. Can. J. Fish. Aquat. Sci., 41: 682-691.
- Bodaly, R. A., Johnson, T. W. D., Fudge, R. J. P. & Clayton, J. W. (1984) Collapse of the lake whitefish (Coregonus clupeaformis) fishery in Southern Indian Lake, Manitoba, following lake impoundment and river diversion. Can. J. Fish. Aquat. Sci., 41: 692-700.
- Summary report (1987) Canada-Manitoba Agreement on the Study and Monitoring of Mercury in the Churchill River Diversion.
| Jan | Feb | Mar | Apr | May | Jun | Jul | Aug | Sep | Oct | Nov | Dec | Ann. |
|---|---|---|---|---|---|---|---|---|---|---|---|---|
| 2.27 | 5.80 | 12.27 | 18.89 | 20.04 | 21.92 | 20.36 | 15.28 | 8.80 | 4.22 | 2.37 | 1.48 | 11.4 |
| [m] | ||||||||||||
|---|---|---|---|---|---|---|---|---|---|---|---|---|
| Depth | Jan | Feb | Mar | Apr | May | Jun | Jul | Aug | Sep | Oct | Nov | Dec |
| 0 | 0 | 0 | 0 | 0 | 0-7 | 7-12 | 12-15 | 15-13 | 13-9 | 9-0 | 0 | 0 |
| [m] | ||||||||||||
|---|---|---|---|---|---|---|---|---|---|---|---|---|
| Depth | Jan | Feb | Mar | Apr | May | Jun | Jul | Aug | Sep | Oct | Nov | Dec |
| 0 | 0 | 0 | 0 | 0 | 0-2 | 2-9 | 9-12 | 12-11 | 11-7 | 7-0 | 0 | 0 |
Mixing type: Polymictic.
Notes on water mixing and thermocline formation
Southern Indian Lake is polymictic; due to its shallowness it is well mixed at most times of the year and any stratification is weak.
E. LAKE WATER QUALITY
E1 TRANSPARENCY [m](4)1978
| Min | Max | Ann. | |
|---|---|---|---|
| Region 1 | 0.7 | 1.4 | 0.9 |
| Region 4 | 1.0 | 1.4 | 1.1 |
Region 1, 1975-1978: 12.
Region 4, 1975-1978: 6. * Measured after equilibration with atmosphere.
E4 DO
Oxygen saturation degree [%]
Region 1, May-September 1978: 94-102.
Region 4, May-September 1978: 95-105.
E6 CHLOROPHYLL CONCENTRATION [micro g l-1](5)
Region 1, 5 July-4 September 1978: 4.
Region 4, 5 July-4 September 1978: 3.8.
E7 NITROGEN CONCENTRATION
Total dissolved-N [micro mol l-1]
Region 1, May-September 1978: 18.6-22.1.
Region 4, May-September 1978: 17.1-24.3.
Suspended nitrogen [micro mol l-1]
Region 1, May-September 1987: 4.0-6.4.
Region 4, May-September 1987: 2.4-5.1.
E8 PHOSPHORUS CONCENTRATION
Total dissolved P [micro mol l-1]
Region 1, May-September 1978: 0.10-0.26.
Region 4, May-September 1978: 0.20-0.58.
Suspended P [micro mol l-1]
Region 1, May-September 1978: 0.29-0.52.
Region 4, May-September 1978: 0.16-0.39.
E9 CHLORIDE CONCENTRATION [micor mol l-1]
Region 1, 1978: 34.
Region 4, 1978: 34.
F. BIOLOGICAL FEATURES
F1 FLORAMacrophytes: None.
Phytoplankton
Melosira islandica and M. italica develop high biomasses in spring and late summer-fall; Anabaena spp. is visually prominent in August; see (6) for list of taxa.
F2 FAUNA
Zooplankton (8)
Cyclops bicuspidatus thomasi, Diaptomus ashlandi and Chydorus sphaericus were dominant in 1972 before impoundment; Senecella calanoides, Diaptomus sicilis and Limnocalanus macruras increased from 1977 to 1980 after impoundment but failed to replace the pre-impoundment dominants.
Benthos (9, 10)
Ablabesmyia monilis, Procladius sp., Parakiefferiella bathophila, Chironomus hyperboreus, Microtendipes pedullus var. pedellus and Paratanytarsus laccophilus were the dominant chironomids in the littoral zone of Southern Indian Lake 1977-79; a total of 158 species were identified.
Fish
Coregonus clupeaformis* (lake whitefish), C. artedii (lake cisco), Stizostedion vitreum* (walleye), S. canadense, Esox lucius* (northern pike), Salvelinus namycush (lake trout), Lota lota, Perca flavescens, Catostomus commersoni, C. catostomus, Hiodon alosoides, Pungitius pungitius, Cottus cognatus, spottail shiner, Iowa darter, Johnny darter, trout-perch, spoonhead sculpin, brook stickleback, longnose duce, lake chub.
* Economically important.
F3 PRIMARY PRODUCTION RATE [mg C m-2 day-1]
Region 4, 1975
| Jun | Jul | Aug | Sep | |
|---|---|---|---|---|
| Gross production | 200 | 200 | 500 | 580 |
F4 BIOMASS (8, 8a)
Plankton [mg l-1]
June-July: 0.1.
August-September: 1.
Crustacean zooplankton density [no l-1]
1972: 76*.
* The density value is comparable to that of Lake Ontario.
F5 FISHERY PRODUCTS
Annual fish catch: See F6.
F6 PAST TRENDS
Rates of phytoplankton primary productivity were for the most part not significantly altered by impoundment and diversion. Limiting factor however changed from phosphorus limitation before impoundment to light limitation because of siltation after impoundment (4, 5). Benthos lakewide standing stocks increased in response to impoundment but decreased shortly after (9).
Annual Commercial Fishery Yields (7a)
All yields are in marketed kilograms. The "other" category includes goldeye, cisco and lake trout. DEL = number of daily deliveries = fishing effort. No fishing in 1974.
| Year | Walleye | Pike | Whitefish | Other | Total | DEL |
|---|---|---|---|---|---|---|
| 1941 | 544 | 0 | 8,799 | 0 | 9,343 | M |
| 1942 | 590 | 0 | 70,943 | 0 | 71,533 | M |
| 1943 | 2,812 | 1,497 | 1,286 | 45 | 5,640 | M |
| 1944 | 10,886 | 3,310 | 186,247 | 0 | 200,943 | M |
| 1945 | 10,342 | 1,542 | 356,437 | 0 | 368,321 | M |
| 1946 | 10,841 | 3,719 | 408,555 | 0 | 423,115 | M |
| 1947 | 5,035 | 0 | 262,814 | 0 | 267,849 | M |
| 1948 | 6,486 | 0 | 163,295 | 0 | 169,721 | M |
| 1949 | 7,394 | 0 | 172,866 | 0 | 180,260 | M |
| 1950 | 1,905 | 45 | 271,251 | 0 | 273,201 | M |
| 1951 | 953 | 0 | 304,091 | 0 | 305,044 | M |
| 1952 | 0 | 0 | 272,340 | 0 | 272,340 | M |
| 1953 | 5,443 | 0 | 268,303 | 0 | 273,746 | M |
| 1954 | 36,605 | 0 | 221,401 | 0 | 258,006 | M |
| 1955 | 53,252 | 0 | 95,618 | 0 | 148,870 | M |
| 1956 | 32,568 | 0 | 163,749 | 0 | 196,317 | M |
| 1957 | 5,307 | 0 | 249,070 | 0 | 254,377 | M |
| 1958 | 5,942 | 0 | 243,128 | 0 | 249,070 | M |
| 1959 | 4,763 | 771 | 166,697 | 544 | 172,775 | M |
| 1960 | 3,719 | 2,359 | 262,088 | 0 | 268,166 | M |
| 1961 | 2,495 | 227 | 373,220 | 0 | 375,942 | M |
| 1962 | 1,315 | 227 | 309,353 | 0 | 310,895 | M |
| 1963 | 1,270 | 635 | 274,925 | 0 | 276,830 | M |
| 1964 | 3,629 | 2,359 | 271,705 | 0 | 277,693 | M |
| Year | Walleye | Pike | Whitefish | Other | Total | DEL |
|---|---|---|---|---|---|---|
| 1965 | 3,719 | 7,847 | 238,320 | 0 | 249,886 | M |
| 1966 | 5,489 | 5,625 | 129,457 | 0 | 140,571 | M |
| 1967 | 2,223 | 4,037 | 157,625 | 0 | 163,885 | M |
| 1968 | 363 | 1,678 | 184,977 | 0 | 187,018 | M |
| 1969 | 272 | 1,406 | 151,229 | 0 | 152,907 | M |
| 1970 | 1,270 | 227 | 141,477 | 0 | 142,974 | 3,625 |
| 1971 | 635 | 771 | 123,786 | 0 | 125,192 | 1,124 |
| 1972 | 45 | 227 | 103,738 | 0 | 104,010 | 492 |
| 1973 | 0 | 181 | 12,701 | 0 | 12,882 | 1,996 |
| 1974 | 0 | 0 | 0 | 0 | 0 | M |
| 1975 | 45 | 318 | 50,712 | 0 | 51,075 | 1,581 |
| 1976 | 63,144 | 23,378 | 349,926 | 67 | 436,515 | 3,185 |
| 1977 | 37,068 | 34,240 | 359,599 | 332 | 431,239 | 2,970 |
| 1978 | 18,941 | 36,878 | 331,852 | 84 | 387,755 | 3,292 |
| 1979 | 16,739 | 57,324 | 357,245 | 12,620 | 443,928 | 3,480 |
| 1980 | 11,913 | 25,212 | 354,192 | 7,380 | 398,697 | 3,817 |
| 1981 | 18,615 | 28,276 | 256,695 | 11,587 | 315,173 | 3,687 |
| 1982 | 16,820 | 10,329 | 96,457 | 7,831 | 131,437 | 1,500 |
| 1983 | 5,699 | 10,108 | 200,096 | 4,385 | 220,288 | 1,825 |
| 1984 | 19,674 | 13,579 | 215,522 | 6,123 | 254,898 | 2,182 |
| 1985 | 26,807 | 35,522 | 196,932 | 1,204 | 260,465 | 2,197 |
| 1986 | 19,848 | 32,512 | 135,742 | 83 | 188,185 | 1,883 |
General collapse of fishery due to effects of river diversion and impoundment over the period 1976-81 (13).
Decline in populations of burrowing mayflies (Hexagenia limbata and H. rigida) from 1979 to 1983 was attributed to a very cold year in 1978. The extended recovery period was due to the long development period of these organisms in the lake (13).
Increases in the relative abundance of Diaptomus sicilis, Senecella calanoides and Limnocalanus macruras was attributed to impoundment (8).
G. SOCIO-ECONOMIC CONDITIONS
G1 LAND USE IN THE CATCHMENT AREA| [%] | |
|---|---|
| Natural landscape | |
| Woody vegetation* | 100 |
| Total | 100 |
Boreal forest (black spruce, pine, aspen, birch).
G2 INDUSTRIES IN THE CATCHMENT AREA AND THE LAKE
Wilderness.
Number of domestic animals in the catchment area: None.
G3 POPULATION IN THE CATCHMENT AREA
Early in the 20th century native people from the Nelson House Indian Reserve settled on Southern Indian Lake. In 1974 approximately 700 people had established themselves in the community of Southern Indian Lake.
I. DETERIORATION OF LAKE ENVIRONMENTS AND HAZARDS
I1 ENHANCED SILTATIONExtent of damage: Serious.
Supplementary notes
Altered fish distribution, and caused high mortality in fish eggs.
I2 TOXIC CONTAMINATION
Mercury concentration in fish muscle [mg kg-1] (11)
Walleye: 0.80 in 1978.
Whitefish: 0.31 in 1979.
Northern pike: 1.18 in 1984.
From 1975 to 1986 the mean concentration (mg kg-1) of fish muscle mercury in whitefish taken from South Bay ranged from a low of 0.07 to a high of 0.31 with the peak concentrations occurring in 1979. During the same period northern pike muscle mercury ranged from a low of 0.67 in 1985 to a high of 1.18 in 1984. South Bay walleye muscle mercury ranged from a low of 0.47 in 1979 to a high of 0.80 in 1978. The only contaminant for which fish contaminant data are available is mercury.
Environmental quality standards for contaminations in the lake: None.
Food safety standards or tolerance limits for toxic contaminant residue
National standard for Hg is 0.5 micro g-1 in food.
Past trends of the above concentrations (11, 12, 14)
Sharp increases in mercury in fish muscle immediately after impoundment of the lake; trends in recent years are variable, depending on species.
I3 EUTROPHICATION
Nuisance caused by eutrophication
Unusual algal bloom;Anabaena becomes visually prominent in August in this pristine lake environment.
Nitrogen and phosphorus loadings to the lake [g m-2 yr-1]
| Sources | Natural |
|---|---|
| T-N | 0.25 |
| T-P | 4.8 |
J. WASTEWATER TREATMENTS
J1 GENERATION OF POLLUTANTS IN THE CATCHMENT AREA- a) Pristine lake environments.
Cottage density extremely low.
M. LEGISLATIVE AND INSTITUTIONAL MEASURES FOR UPGRADING LAKE ENVIRONMENTS
M1 NATIONAL AND LOCAL LAWS CONCERNEDNames of the laws (the year of legislation)
N. SOURCES OF DATA
Drs. R. E. Hecky, R. A. Bodaly, K. Patalas, D. M. Rosenberg, H. J. Kling, C. Allan, C. Anema, G. K. McCullough and S. J. Guilford.
