
WILLISTON LAKE
Peace Reach looking east from westside of Mabeshe Inlet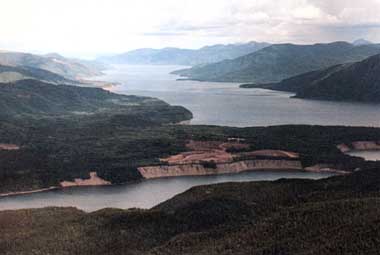
Photo: J. O. Fleming
A. LOCATION
British Columbia, Canada.55:0-56:3N, 122:0-125:0W; 672.1* m above sea level.
* Maximum normal level.
B. DESCRIPTION
Williston Lake (Reservoir), the largest freshwater body in British Columbia, was created in 1968 with the completion of the W. A. C. Bennet Dam. The dam blocked the flow of the Peace River and impounded the upper Peace and lower Parsnip and Finlay Rivers. Lake creation has resulted in three relatively discrete reaches: the Finlay and Parsnip Reaches lying in a north-south direction in the Rocky Mountain Trench and the Peace Reach passing through the Rocky Mountains in a west-east direction. Williston Lake waters pass through the W. A. C. Bennett Dam, Dinosaur Lake (reservoir) and the Peace Canyon Dam before entering the Peace River and ultimately the Mackenzie River system on their way to the Arctic Ocean.Surficial geology shows Williston Lake bounded by a variety of landforms. Geological features include a series of terraces formed by glacial outwash, moraines and lacustrine deposits as well as alluvial fans and steep slopes of sedimentary rock. The major physiographic units include the Cassiar-Columbia Mountains bounding the western edge of Williston Lake, the Rocky Mountain trench of which the Finlay and Parsnip Reaches occupy and the eastern systems including the Rocky Mountains, through which the Peach Reach passes.
Historically, the river valleys were used by native tribes of nomadic hunters and gatherers. First European contact was made by Alexander MacKenzie who used the Peace River valley as his access point through the Rocky Mountains during his journey to the Pacific Ocean in 1793. Simon Fraser further opened the region establishing a series of fur trading posts in 1805. Following the decline of the fur trade came a brief period of gold exploration. The area remained the domain of prospectors, fur traders, trappers and hunters until well into the 20th century. Approval for the creation of Williston Lake in 1962 resulted in the development of pulp-sawmill facilities beginning in 1966 in the area which has become the town of MacKenzie.
W. A. C. Bennett Dam was constructed over the period of 1962 to 1967, by the B. C. Hydro and Power Authority, a provincial crown corporation in response to projected domestic power requirements. Dam construction cost was approximately $ 421 million with all associated direct and indirect costs bringing the total cost for the project to approximately $ 764 million (dollar value in year of expenditure). The dam is one of the largest earthfill structures in the world at 183 m in height and having a crest length of 2,134 m. The Gordon M. Shrum Generating Station at Bennett Dam has the largest generating capacity in the B. C. Hydro system at 2,416,000 kW.
Williston Lake has a relatively rapid flushing rate with a water residence time of approximately 2.2 years. Bathymetric characteristics reflect the lake's reservoir origin with depths progressing from river depths of 1 to 2 meters at the head of the Finlay and Parsnip Reaches to approximately 166 meters depth at the Dam (at full pool). Deeply incised former stream valleys cut through submerged benchland/terraces leading to a central channel. Submerged standing timber covers much of the lake bottom. The lake is considered dimictic and oligotrophic with excellent water quality. The characteristic low nutrient levels and low productivity is typical of most British Columbia lakes.
A $ 10-million program to enhance local fish and wildlife resources in the Williston Lake area commenced in 1988. The work is to be carried out jointly by the Provincial Ministry of Environment and B. C. Hydro using funds provided by B. C. Hydro as compensation for the creation of the reservoir (l).
C. PHYSICAL DIMENSIONS (1, 5)
| Surface area [km2] | 1,779 |
| Volume [km3] | 70.3 |
| Maximum depth [m] | 166 |
| Mean depth [m] | 43.3 |
| Water level | Regulated |
| Normal range of annual water | |
| level fluctuation [m] | 16.8* |
| Length of shoreline [km] | 1,770 |
| Residence time [yr] | 2.2 |
| Catchment area [km2] | 72,000 |
D. PHYSIOGRAPHIC FEATURES
D1 GEOGRAPHICALSketch map: Fig. NAM-29-0l.
Sketch map: Fig. NAM-29-02.
Names of main islands: None.
Number of outflowing rivers and channels (name): 1 (Peace R.).
Sketch map of the Mackenzie Basin (Q).
Sketch map of the lake (Q).
D2 CLIMATIC (2, 3, 3a, 4) Climatic data Hudson Hope BCHPA Dam*, 1951-1980 Mean temp. [deg C]
| Jan | Feb | Mar | Apr | May | Jun | Jul | Aug | Sep | Oct | Nov | Dec | Ann. |
|---|---|---|---|---|---|---|---|---|---|---|---|---|
| -15.3 | -9.8 | -5.5 | 2.5 | 8.8 | 13.2 | 15.3 | 14.4 | 9.7 | 4.4 | -4.1 | -10.4 | 1.9 |
| Jan | Feb | Mar | Apr | May | Jun | Jul | Aug | Sep | Oct | Nov | Dec | Ann. |
|---|---|---|---|---|---|---|---|---|---|---|---|---|
| 36 | 30 | 39 | 21 | 49 | 80 | 88 | 70 | 40 | 27 | 33 | 39 | 551 |
| Jan | Feb | Mar | Apr | May | Jun | Jul | Aug | Sep | Oct | Nov | Dec | Ann. |
|---|---|---|---|---|---|---|---|---|---|---|---|---|
| -14.3 | -9.1 | -4.7 | 2.4 | 8.2 | 12.5 | 14.9 | 13.8 | 9.1 | 3.6 | -3.9 | -10.1 | 1.9 |
| Jan | Feb | Mar | Apr | May | Jun | Jul | Aug | Sep | Oct | Nov | Dec | Ann. |
|---|---|---|---|---|---|---|---|---|---|---|---|---|
| 88 | 59 | 53 | 27 | 31 | 67 | 52 | 58 | 50 | 59 | 61 | 88 | 692 |
Ingenika Point*, 1951-1980 (2)
Mean temp. [deg C]
| Jan | Feb | Mar | Apr | May | Jun | Jul | Aug | Sep | Oct | Nov | Dec | Ann. |
|---|---|---|---|---|---|---|---|---|---|---|---|---|
| -17.8 | -11.3 | -6.2 | 1.5 | 7.7 | 12.4 | 14.7 | 13.5 | 8.6 | 3.0 | -5.8 | -14.1 | 0.5 |
| Jan | Feb | Mar | Apr | May | Jun | Jul | Aug | Sep | Oct | Nov | Dec | Ann. |
|---|---|---|---|---|---|---|---|---|---|---|---|---|
| 48 | 33 | 25 | 22 | 32 | 54 | 61 | 50 | 42 | 35 | 37 | 65 | 503 |
Number of hours of bright sunshine (MacKenzie): 1,800 hr yr-1 (3a).
Solar radiation (Prince George Airport*)[MJ m-2 day-1](3a)
| Jan | Feb | Mar | Apr | May | Jun | Jul | Aug | Sep | Oct | Nov | Dec | Ann. |
|---|---|---|---|---|---|---|---|---|---|---|---|---|
| 2.73 | 5.3 | 10.09 | 15.77 | 18.15 | 21.42 | 20.81 | 17.04 | 11.12 | 6.14 | 3.07 | 1.78 | 11.1 |
Water temperature [deg C](3, 4)
Finlay Forks*1
[m]
| Depth | Feb*2 | Apr*3 | Jun*2 | Jun*4 | Jul*2 | Aug*4 | Oct*4 | Nov*2 |
|---|---|---|---|---|---|---|---|---|
| S*5 | 0.0 | 0.2 | 14.0 | 10.4 | 14.6 | 15.8 | 8.5 | 4.5 |
| 3 | 0.0 | 0.9 | - | 9.5 | - | 15.1 | 8.6 | - |
| 4 | - | - | 6.5 | - | 14.7 | - | - | 4.5 |
| 10 | 0.5 | 1.1 | 5.2 | 8.2 | 14.4 | 14.9 | 8.7 | 4.5 |
| 15 | 0.6 | 1.1 | 4.6 | 7.3 | 8.5 | 14.1 | 8.7 | 4.5 |
| 20 | 0.8 | 1.6 | 4.2 | 6.8 | 4.9 | 11.6 | 8.6 | 4.5 |
| 30 | 1.0 | 2.4 | 3.9 | 6.4 | 4.5 | 6.3 | 8.5 | 4.5 |
| 40 | 1.0 | 2.9 | 3.8 | 6.0 | 4.4 | 5.3 | 8.3 | 4.5 |
| 50 | 1.0 | - | - | 3.7 | - | 4.8 | 5.8 | - |
| 60 | - | - | 3.6 | - | 4.4 | - | - | 4.5 |
| 80 | 1.0 | - | - | 3.7 | 4.4 | 4.6 | 5.6 | 4.5 |
Freezing period: November or December-middle May (Finlay & Parsnip).
Mixing type: Dimictic.
Notes on water mixing and thermocline formation
Thermocline is poorly developed during the summer. During the winter, all Reaches typically exhibit an inverse stratification. Intense wind-generated mixing may cause the Finlay and Parsnip Reaches to approach 0¡¦ at all depths some years (data is inconclusive).
E. LAKE WATER QUALITY (3, 4)
E1 TRANSPARENCY [m]Finlay Forks, 1975 and 1988
| Jun | Jul | Aug | Oct | Nov | |
|---|---|---|---|---|---|
| 1975 | 1.5 | 4.5 | - | - | 4.0 |
| 1988 | 2.1 | - | 4.4 | 3.0 | - |
Finlay Forks, 1988
[m]
| Depth | Jun | Jul | Aug | Sep | Oct | Nov | Dec |
|---|---|---|---|---|---|---|---|
| S* | 7.5 | - | 7.0 | - | 6.6 | - | - |
| 10 | 7.4 | - | 7.0 | - | 6.6 | - | - |
| 15 | 7.4 | - | 7.0 | - | 6.6 | - | - |
| 20 | 7.4 | - | 6.6 | - | 6.6 | - | - |
| 30 | 7.4 | - | 6.1 | - | 6.5 | - | - |
| 60 | 7.3 | - | 6.6 | - | 6.1 | - | - |
| 80 | 7.4 | - | 6.5 | - | 6.0 | - | - |
E3 SS [mg l-1]
Lake sites combinated, 1974
[m]
| Depth | Sep |
|---|---|
| Surface*1 | <1 to 2 |
| 15*2 | |
| 40*1 |
[m]
| Depth | Aug | Sep | Oct |
|---|---|---|---|
| 1 | <1.0 | - | 1.0 |
| 5 | 1.0 | - | 2.0 |
| 20 | <1.0 | - | 1.0 |
| 80-85 <1.0 | - | 1.0 |
Finlay Forks, 1988
[m]
| Depth | Jun | Jul | Aug | Sep |
|---|---|---|---|---|
| S* | 12.0 | - | 10.0 | 12.0 |
| 10 | 11.2 | - | 8.9 | 11.1 |
| 15 | 11.0 | - | 8.8 | 11.0 |
| 20 | 11.1 | - | 8.7 | 10.8 |
| 30 | 11.1 | - | 9.2 | 10.6 |
| 40 | 10.9 | - | 9.6 | 10.2 |
| 60 | 10.8 | - | 9.3 | 9.4 |
| 70 | 10.7 | - | 9.4 | 9.4 |
Total organic carbon
Finlay Forks, 1988
[m]
| Depth | Jun | Jul | Aug | Sep | Oct |
|---|---|---|---|---|---|
| 1 | 1 | - | <1 | - | <1 |
| 5 | 1 | - | <1 | - | <1 |
| 20 | <1 | - | <1 | - | <1 |
| 80-85 <1 | - | <1 | - | <1 |
Finlay Forks, 1988
[m]
| Depth | Jun | Jul | Aug | Sep | Oct |
|---|---|---|---|---|---|
| 1 | 2.6 | - | 1.4 | - | 3.5 |
| 5 | 2.3 | - | 1.2 | - | 3.3 |
| 10 | 1.6 | - | 1.8 | - | 4.1 |
| 15 | 1.4 | - | 1.2 | - | 3.1 |
| 20 | 1.3 | - | 0.9 | - | 2.9 |
Total-N [mg l-1]
Finlay Forks, 1988
[m]
| Depth | Jun*1 | Jul | Aug | Sep | Oct |
|---|---|---|---|---|---|
| 1 | 0.35*2 | - | <0.10 | - | 0.16 |
| 5 | 0.37 | - | <0.09 | - | 0.11 |
| 20 | 0.24 | - | 0.13 | - | 0.12 |
| 80-85 0.45 | - | 0.10 | - | 0.12 |
E8 PHOSPHORUS CONCENTRATION
Total-P [mg l-1]
Finlay Forks, 1988
[m]
| Depth | Jun | Jul | Aug | Sep | Oct |
|---|---|---|---|---|---|
| 1 | .012 | - | 0.005 | - | 0.004 |
| 5 | .004 | - | 0.005 | - | 0.004 |
| 20 | .007 | - | 0.004 | - | 0.003 |
| 80-85 | .033 | - | 0.004 | - | 0.003 |
Described in a report entitled: "Williston Compensation Study-Limnology and Water Quality Program (1988)" available from B.C. Hydro and B.C. Ministry of Environment in 1989. The report examines changes which occurred in Williston Reservoir between 1974 and 1988.
F. BIOLOGICAL FEATURES (3, 5, 6)
Finlay Forks, 1988F1 FLORA
Macrophytes
No macrophyte data for the lake; reservoir fluctuation and low nutrient levels restrict macrophyte development. There is potentially some macrophyte growth in some river embayments.
Phytoplankton
Pennate diatoms (Achnanthes minutissima, Nitzschia sp., Synedra acus, Fragilaria crotonensis, Asterionella formosa, Tabellaria fenestra), centric diatoms (Rhizosolenia eriensis, Stephanodiscus sp., Melosira italica), Chrysomonadales (Dinobryon sp), Cryptomonadales (Chroomonas sp., Cryptomonas ovata), Chroococcales (Aphanothece sp.).
F2 FAUNA
Zooplankton
Cladocerans (Daphnia pulex, Daphnia sp. (possibly ambigua) and Bosmina sp.), copepods (Diaptomus tyrelli, Cyclops bicuspidatus, C. utipes and Espischura sp.), Rotifers (Conochilus sp.).
Benthos
Primarily Chironomidae with Annelida occurring in abundance in deeper waters, 1975.
Fish
Oncorhynchus mykiss, O. nerka, Salvelinus confluentus, S. namaycush, Thymallus arcticus, Prosopium williamsoni, Coregonus clupeaformis, Lota lota, Richardsonius bacteatus, Ptychocheilus oregonensis, Mylophoilus caurinus, Catostomus macrocheilus, C. commersoni, C. catostomus, Cottus asper.
F3 PRIMARY PRODUCTION RATE [mg C m-2 day-1](5)
Finlay Forks, 1977: 102.
F5 FISHERY PRODUCTS
No data available at this time. Williston Reservoir supports a sport-fishery. No commercial fishery has been allowed by Provincial authorities.
F7 NOTES ON THE REMARKABLE CHANGES OF BIOTA IN THE LAKE IN RECENT YEARS
1. Lake whitefish coregonus rapidly colonized the newly created reservoir becoming the most abundant "large" fish species by 1974. Reduced growth rates since 1974 have resulted in what appears to be a stunted population.
2. Kokanee (Onchorhynchus nerka) gradually increasing in numbers but are still low in overall abundance.
3. Arctic grayling Thymallus and mountain whitefish Prosopium have virtually disappeared from the lake habitat since the early 1980's.
G. SOCIO-ECONOMIC CONDITIONS (1, 7, 9, 10, 11, 12)
G1 LAND USE IN THE CATCHMENT AREA1988*
| Area [%] | |
|---|---|
| Natural landscape | >99 |
| Woody vegetation | 85-95 |
| Agricultural land | <1 |
| Residential area | <1 |
| Others | <1 |
| Total | 100 |
Types of important forest vegetation
Picea mariana, P. glauca, Pinus contorta (var. latifolia), Larix occidentalis, Populus tremuloides, P. trichocarpa, Betula papyrifera commutata, Abies lasiocarpa.
Types of the other important vegetation
Alnus tenuifolia, Lonicera involucrata, Cornus stolonifera, Salix sp. Main kinds of crops and/or cropping systems: Limited. Levels of fertilizer application on crop fields: Light to none.
G2 INDUSTRIES IN THE CATCHMENT AREA AND THE LAKE Forest industry provides the majority of employment and economic activity in the region.
| Main products or major industries | |
|---|---|
| Primary industry | Fur trapping, logging, farming, |
| hydroelectric power, mining | |
| Crop production | Limited agriculture |
| Animal husbandry | Very limited (some fur-farming, |
| cattle, horses, etc.) | |
| Fisheries | Sport fishery only |
| Secondary industry | Sawmills (2), pulp mills (3), |
| paper mill (1) | |
| Tertiary industry | Tourism |
1988
| Population | Major cities | ||
|---|---|---|---|
| Population* density [km-2]* | (population) | ||
| Total | 10,000 | 0.17 | Mackenzie (6,000) |
| (Rural) | -12,000 |
H. LAKE UTILIZATION
H1 LAKE UTILIZATIONSource of water, navigation and transportation (raw logs; access tonnage (metric) of cargo per year: approx. 2.4 million m3), sightseeing and tourism, recreation (sport-fishing), and hydro power generation (max. capacity 2,426,000 kW), and access to logging, mining and recreational sites.
H2 THE LAKE AS WATER RESOURCES
1975-1988
| Use rate [m3 day-1] | |
|---|---|
| Domestic | None |
| Irrigation | None |
| Industrial | Approx. 60-65,000 |
| Power plant | 2,416,000 kW max. capacity |
I. DETERIORATION OF LAKE ENVIRONMENTS AND HAZARDS
I1 ENHANCED SILTATION Extent of damage: None.I2 TOXIC CONTAMINATION Present status: Detected but not serious.
Supplementary notes
1. Natural geological formations with high mercury levels are present and associated with some tributaries to Williston Lake. Some monitoring of fish and local residents has been conducted by Health and Welfare Canada in past years. A program to examine fish tissue mercury levels from Williston Lake commenced in 1988, but no data available at this time.
2. Fish tissue samples were taken in 1988 to examine for dioxin levels in association with local pulp mill effluents-no data available.
3. Environmental agencies have expressed concern over the pollution effects of local mill effluents being exacerbated by maximum reservoir drawdown (this has not occurred to date). Effluent treatment currently includes primary and secondary treatment facilities.
I3 EUTROPHICATION Nuisance caused by eutrophication: None.
I4 ACIDIFICATION Extent of damage: No information.
I5 OTHER HAZARDS
1. Wood debris as a result of reservoir creation.
2. Seasonal water fluctuations in response to water storage and power requirements can result in navigation hazards (summer) and dangerous ice conditions (winter).
J. WASTEWATER TREATMENTS
J1 GENERATION OF POLLUTANTS IN THE CATCHMENT AREA- c) Limited pollution with wastewater treatment.
| [%] | |
|---|---|
| Non-point sources | 0 |
| (agricultural, natural and | |
| dispersed settlements) | |
| Point sources | |
| Industrial | 100 |
| Total | 100 |
Percentage of municipal population in the catchment area provided with adequate sanitary facilities (on-site treatment systems) or public sewerage: 100%
. Percentage of rural population with adequate sanitary facilities (on-site treatment systems): Not known.
Municipal wastewater treatment systems
No. of primary and secondary treatment systems (industrial): 2 of 2.
No. of primary treatment systems (municipal): 1 of 1.
Typical systems adopted: Settling ponds.
K. IMPROVEMENT WORKS IN THE LAKE
K3 OTHERS 1. An evaluation and enhancement program for local fish and wildlife resources commenced in 1988.2. An on-going debris clearing program has been conducted since reservoir creation.
L. DEVELOPMENT PLANS
1) B. C. Hydro is reviewing the feasibility of raising the maximum allowable water level of Williston Lake by 1.5 m.2) Local resource companies are examining the feasibility of constructing a causeway and bridge crossing the Parsnip Reach.
M. LEGISLATIVE AND INSTITUTIONAL MEASURES FOR UPGRADING LAKE ENVIRONMENTS (8, 13)
M1 NATIONAL AND LOCAL LAWS CONCERNED Names of the laws (the year of legislation)- Waste Management Act (1982)
- Fisheries Act (Amended 1977; subsequent amendment 1988)
- Canada Water Act (1970)
- Canadian Environmental Protection Act (1988)
- Water Act (1979; revision 1985) Responsible authorities
- Ministry of Environment, Prov. of British Columbia
- Fisheries & Ocean, Environment Canada
- Environment Canada
- Environment Canada
- Ministry of Environment, Prov. of B. C. Main items of control
- Pollution Control
- Fisheries protection
- Water quality and quantity regulation and protection
- Control of toxic substance
- Regulate, license & control water use
- Williston Lake Compensation Project commencing in 1988 Joint program by B. C. Hydro and Ministry of Environment, Fish & Wildlife Branch involving evaluation and enhancement of fish and wildlife resources.
N. SOURCES OF DATA
- Questionnaire compiled by Dr. J. 0. Fleming, Aquatic Biologist for B. C. Hydro Environmental Resources, Vancouver, B. C.
- B. C. Hydro (1987) Williston Reservoir Raising. Hydro Electric Division, Report No. H1908.
- Environment Canada (1981) Canadian Climate Normals, Temperature and Precipitation, 1951-1980, British Columbia. Atmospheric Environment Service, Publ. of the Canadian Climate Program.
- B. C. Hydro (1988) Williston Compensation Field Studies (unpublished/in process).
- ) Canadian Climate Normals 1951-1980. Environment Canada, Atmospheric Environment Service.
- B. C. Research (1976) Limnological Studies of Williston Lake during Summer and Fall, 1975. Water Investigations Branch, Water Resources Service, Department of Environment, Project 1171.
- B. C. Research (1977) Limnology of Arrow, McNaughton, Upper Campbell and Williston Lakes. B. C. Hydro, Project No. 1-05-807.
- Barrett, D. T. & Halsey, T. G. (1985) Fisheries Resources and Fisheries Potential of Williston Reservoir and Its Tributary Streams, Vol. 1, Fisheries Resources and Fisheries Potential of Williston Reservoir. Ministry of Environment, Prov. of B. C., Fisheries Technical Circular No. 68.
- ELUC Secretariat (1980) A Resource Management Strategy for the Williston Basin. ELUC-Environmental Land Use Committee, Prov. of B. C. (draft copy).
- Ontario Hydro (1982) A Reference Guide to Environmental Legislation in Canada (1982 update). Canadian Electrical Association, Research and Development, CEA Project No. 228 GS0A. Prep. by Env. Stud. and Assess. Dept., Ontario Hydro, Report No. 82667.
- MacKenzie Chamber of Commerce, MacKenzie, B. C. (pers. comm. 1989).
- Finlay Forest Industries Ltd., MacKenzie, B. C. (pers. comm. 1989).
- Fletcher Challenge Ltd., MacKenzie, British Columbia (pers. comm. 1989).
- Ministry of Environment, Waste Management Branch, Province of British Columbia, Prince George, B. C. (pers. comm. 1989).
- Environment Canada, Vancouver, B. C. (pers. comm. 1989).
