
MANICOUAGAN RESERVOIR
Manicouagan dam (at left) and spillway (in the middle)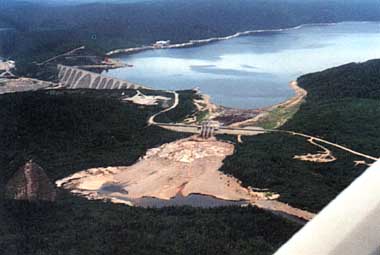
Photo: N. Chartrand
A. LOCATION
Quebec, Canada.50:8N, 68:3W; ca. 366 m above sea level.
B. DESCRIPTION
Manicouagan Reservoir is on the Canadian Shield which is Precambrian in origin and similar in type to the Scandinavian Shield. It covers more than 90% of the province and is located north of the St. Lawrence River. This region is characterized by a disorganized collection of the hills with rounded peaks rarely more than 1,500 m high. The depressions between the hills are frequently occupied by lakes and rivers. This is why, depending on the sector, 20 to 50% of the region's surface is occupied by aquatic habitats. In this region, we find all of the major reservoirs built by Hydro-Quebec (e. g. the La Grande Project Area near James Bay).The Manicouagan Reservoir is the most important reservoir of the Manicouagan Hydroelectric Complex. This reservoir is the result of the impoundment of two arched lakes (Manicouagan and Mouchalagan) and rivers. When the impoundment was completed, the reservoir took a final circle form with an island in the middle (Ile Rene-Levasseur). This circle form and the pattern of the local topography is the result of the impact of a meteorite which changed the nature of the rocks and affected the geological structure. The water of the reservoir is poor in mineral or organic elements and lightly acid. The water is as clear as all nordic lakes and has a low productivity. Situated at approximately 220 kilometers south of the reservoir, Baie-Comeau is the regional centre of this part of the North Shore (Q).
C. PHYSICAL DIMENSIONS (Q)
| Surface area [km2] | 1,950 |
| Volume [km3] | 141.6 |
| Maximum depth [m] | 350 |
| Mean depth [m] | 85 |
| Water level | Regulated |
| Normal range of annual water | |
| level fluctuation [m] | 5.6, 19.8* |
| Length of shoreline [km] | 1,322 |
| Residence time [yr] | 8 |
| Catchment area [km2] | 29,241 |
D. PHYSIOGRAPHIC FEATURES
D1 GEOGRAPHICALSketch map: Fig. NAM-26-0l.
Names of main islands: Ile Rene-Levasseur.
Number of outflowing rivers and channels (name): 1 (Manicouagan R.).
D2 CLIMATIC
Climatic data at Manic 5*, November 1975-January 1988 (l)
Mean temp. [deg C]
| Jan | Feb | Mar | Apr | May | Jun | Jul | Aug | Sep | Oct | Nov | Dec | Ann. |
|---|---|---|---|---|---|---|---|---|---|---|---|---|
| -23 | - | - | - | - | - | 14 | - | - | - | - | - | -3 |
| Jan | Feb | Mar | Apr | May | Jun | Jul | Aug | Sep | Oct | Nov | Dec | Ann. |
|---|---|---|---|---|---|---|---|---|---|---|---|---|
| - | - | - | - | - | - | - | - | - | - | - | - | 600 |
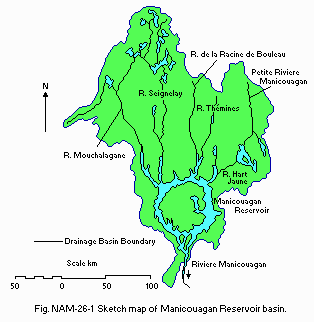
Sketch map of the lake basin.
Number of hours of bright sunshine: 1,990 hr yr-1.
Solar radiation (Iles A)[MJ m-2 day-1](2)
| Jan | Feb | Mar | Apr | May | Jun | Jul | Aug | Sep | Oct | Nov | Dec | Ann. |
|---|---|---|---|---|---|---|---|---|---|---|---|---|
| 4.32 | 8.04 | 11.78 | 14.86 | 18.36 | 20.6 | 18.47 | 17.05 | 11.69 | 7.14 | 4.13 | 3.16 | 11.6 |
Station 1, 1972
[m]
| Depth | Jun | Jul | Aug |
|---|---|---|---|
| S* | - | 8-14 | - |
[m]
| Depth | Jun | Jul | Aug |
|---|---|---|---|
| S | 2.7-3.4 | - | 11.0-16.0 |
| 2 | 2.9-3.5 | - | 12.0-14.6 |
| 10 | 2.9-3.3 | - | 9.5-14.5 |
| B* | 2.9-4.5 | - | 4.0-5.5 |
Mixing type: Monomictic.
Notes on water mixing and thermocline formation
The thermocline was located between 6 and 7 m in June of 1985 in one basin which was protected from the wind by high banks. In another one near the centre of the lake, the thermocline was located between 10 and 15 m.
E. LAKE WATER QUALITY
E1 TRANSPARENCY [m]Six stations, June and August 1985
[m]
| Depth | Jun | Aug |
|---|---|---|
| 6.5òÐ67 | 4.9òÐ67 |
Six stations, June and August 1985
[m]
| Depth | Jun | Aug |
|---|---|---|
| S*1 | 6.10-6.46 | 5.20-6.50 |
| 2 | 6.17-6.45 | 6.12-6.47 |
| 10 | 6.12-6.45 | 6.10-6.49 |
| B*2 | 6.00-6.50 | 6.02-6.37 |
Six stations, August 1985
[m]
| Depth | Aug |
|---|---|
| S*1 | 10.3-11.9 |
| 2 | 10.3-12.3 |
| 10 | 9.9-12.1 |
| B*2 | 10.0-12.2 |
NO3-N [mg l-1]
Six stations, June and August 1985
[m]
| Depth | Jun | Aug |
|---|---|---|
| S*1 | 0.40-0.42 | 0.17-0.26 |
| 2 | 0.42-0.52 | 0.18-0.45 |
| 10 | 0.42-0.80 | 0.15-0.42 |
| B*2 | 0.42-0.66 | 0.40-0.52 |
PO4-P [mg l-1]
June and August 1985
[m]
| Depth | Jun | Aug |
|---|---|---|
| S*1 | <0.05 | <0.05 |
| 2 | <0.05 | <0.05 |
| 10 | <0.05 | <0.05 |
| B*2 | <0.05 | <0.05 |
Six stations, June and August 1985
[m]
| Depth | Jun | Aug |
|---|---|---|
| S*1 | 0.13-0.24 | 0.16-0.26 |
| 2 | 0.16-0.22 | 0.14-0.17 |
| 10 | 0.16-0.25 | 0.14-0.22 |
| B*2 | 0.16-0.22 | 0.14-0.18 |
F. BIOLOGICAL FEATURES (Q)
1972F1 FLORA
Phytoplankton
Dominant taxa: Anabaena sp., Glenodinium pulvisculus and Peridinium
sp. (4). Chrysophyta (Dinobryon divergens, D. bavaricum, D. sertularia,
D. cylindricum, D. vanhoeffenii, Mallomonas unaformis), Bacillariophyta
(Asterionella formosa, Ceratoneis arcus, Cyclotella stalligera, Melosira
granulata, Rhizosolenia eriensis, Stephanodiscus binderanus, Synedra rumpens,
Tabellaria fenestrata, T. flocculosa), Chlorophyta (Ankistrodesmus sp.,
Arthrodesmus sp., Dictyosphaerium pulchellum, Gloecystis sp., Microspora
pachyderma, Mougeotia sp., Oocystis sp., Staurastrum sp.).
F2 FAUNA
Zooplankton (4)
Zooplankton quality and quantity (no m-3), for May, June and July,
1972
| Stations | M-1 | M-2 | M-3 | M-4 | M-5 | ||||||
|---|---|---|---|---|---|---|---|---|---|---|---|
| Dates | 10/5 | 10/7 | 9/5 | 19/6 | 17/5 | 14/7 | 17/5 | 14/7 | 17/5 | ||
| Cladocerans | * | ||||||||||
| Holopedium gibberum | 34 | ||||||||||
| Holopedium sp. | |||||||||||
| Daphnia longiremis | |||||||||||
| 95 | 42 | 10 | 6 | 117 | 20 | 84 | 150 | ||||
| Daphnia catawba | 6 | ||||||||||
| Bosmina longispina | 11 | 20 | 12 | ||||||||
| Bosmina sp. | 6 | ||||||||||
| Polyphemus pediculus | 6 | ||||||||||
| Sida crystallina | |||||||||||
| Total | 95 | 48 | 10 | 6 | 128 | 40 | 142 | 150 | |||
| Copepods | |||||||||||
| Diaptomus minutus | 36 | 36 | 6 | 54 | 10 | 130 | 20 | ||||
| Diaptomus sanguineus | 5 | ||||||||||
| Diaptomus sp. | 5 | 5 | |||||||||
| Epischura lacustris | 64 | 17 | |||||||||
| Epischura sp. | |||||||||||
| Cyclops scutifer | 1 | 12 | 15 | 190 | 2 | 280 | 3 | ||||
| Cyclops capillatus | 2 | ||||||||||
| Cyclops vernalis | |||||||||||
| Cyclops bicuspidatus lubbocki | 3 | ||||||||||
| Cyclops sp. | 843 | 72 | |||||||||
| Total | 884 | 1 | 48 | 20 | 83 | 308 | 14 | 417 | 26 | ||
| Immatures | |||||||||||
| Cladocerans | 53 | ||||||||||
| Copepods | 964 | 3 | 222 | 250 | 60 | 1105 | 200 | 792 | 1960 | ||
| M-6 | M-7 | M-8 | M-9 | M-10 | M-11 | ||||||
| 17/5 | 14/7 | 17/5 | 14/7 | 13/7 | 12/7 | 17/5 | 12/7 | 17/5 | >11/7 | ||
| Cladocerans | |||||||||||
| Holopedium gibberum | 63 | 11 | |||||||||
| Holopedium sp. | 2 | 2 | |||||||||
| Daphnia longiremis | |||||||||||
| 50 | 280 | 30 | 150 | 192 | 188 | 120 | 713 | 10 | 69 | ||
| Daphnia catawba | |||||||||||
| Bosmina longispina | |||||||||||
| 2 | 107 | 20 | 95 | 132 | 82 | 2 | 32 | 2 | |||
| Bosmina sp. | 5 | ||||||||||
| Polyphemus pediculus | 2 | ||||||||||
| Sida crystallina | 12 | ||||||||||
| Total | 52 | 450 | 50 | 257 | 326 | 285 | 122 | 745 | 12 | 74 | |
| Copepods | |||||||||||
| Diaptomus minutus 20 | 630 | 40 | 320 | 4 | 21 | ||||||
| Diaptomus sanguineus | 50 | 135 | 11 | ||||||||
| Diaptomus sp. | 2 | 2 | 10 | ||||||||
| Epischura lacustris | 75 | 11 | 24 | ||||||||
| Epischura sp. | 114 | ||||||||||
| Cyclops scutifer | 10 | 430 | 2 | 565 | 2 | 41 | 2 | 100 | 48 | ||
| Cyclops capillatus | 140 | ||||||||||
| Cyclops vernalis | 16 | ||||||||||
| Cyclops bicuspidatus lubbocki | |||||||||||
| Cyclops sp. | 2 | ||||||||||
| Total | 32 | 1214 | 44 | 960 | 15 | 75 | 52 | 156 | 160 | 59 | |
| Immatures | |||||||||||
| Cladocerans | 24 | 55 | 250 | ||||||||
| Copepods | 1020 | 3040 | 970 | 2083 | 354 | 397 | 950 | 652 | 80 | 554 |
Kellicottia, Monstyla, Polyarthra, Synchaeta, Trichocerca.
Fish
Information not available because the commercial fishing started last year as a new project. Whitefish was the principal species caught (4,500-5,440 kg) in 1987.
G. SOCIO-ECONOMIC CONDITIONS
G1 LAND USE IN THE CATCHMENT AREA1987*
Types of important forest or scrub vegetation
A mixed forest with Abies balsamea, Picea mariana, Betula papyrifera, Populus tremuloides, and Pinus divaricata.
Main kinds of crops and/or cropping systems
There are no field crops in this region; wildlife (e. g. moose, caribou, lynx) are harvested through sport hunting and trapping.
*Comments on land use refer only to the shoreline and not to the watershed as a whole.
G3 POPULATION IN THE CATCHMENT AREA
1986: Total 506 max. No information for whole catchment area.
H. LAKE UTILIZATION
H1 LAKE UTILIZATIONRecreation (sport-fishing), fisheries (a project was started in 1987 (1)) and others (outfitting, cottages on public lands and traditional uses of the land and lake by native people).
H2 THE LAKE AS WATER RESOURCES
1986
| Use rate [m3 sec-1] | |
|---|---|
| Power plant | 580* |
I. DETERIORATION OF LAKE ENVIRONMENT AND HAZARDS
I1 ENHANCED SILTATIONExtent of damage: Not serious.
Supplementary notes
During the reservoir filling stages, the erosion of till, rock, sand, cobbles, pebbles and blocks on the shorelines caused an increase in the concentration of suspended solids and enhanced the rates of mineralization. This stimulated primary productivity in the reservoir once the level of suspended solids had settled permitting better light penetration through the water column of the reservoir.
I2 TOXIC CONTAMINATION
Present status: Detected but not serious.
Supplementary notes
Significant levels of mercury were detected in fish which is normal
for reservoirs in this type of terraine and geological setting.
Main contaminants, their concentrations and sources in 1985
- Questionnaire filled by Dr. N. Chartrand, Manager,Environmental Research and Public Health, Environment Branch, Hydro-Quebec,Montreal.
- Demers, C. D. The Importance of Geographical Aspects in Environmental Studies of Hydro-Quebec Reservoirs. Montreal, Quebec.
- Canadian Climate Normals (1951-1980) Environment Canada,Atmospheric Environment Service.
- Jones H. G. & Onge, J. S. (1985) InventairePhysico-Chemique et Ichtyologique des Eaux du Reservoir Manicouagan 5 (Quebec).
- Jones, G., Leclerck, M., Meybeck, M., Quellet, M. &Rousseau,A. (1973) Etude Limnologique Preminaire du Reservoir Manicouagan,Quebec. Univ. du Quebec, INRS-Eau, Quebec.
Name of
Range of concentration [ppm]*1 Main sources
contaminant
Fish*2
Mercury
Whitefish 0.217-0.772
Northern pike 0.4-2.37
Long nose sucker 0.241-0.433 Geological
White sucker 0.17-0.61
*1 Wet weight basis.
*2 The mercury level in the fish refers to the standards
fillet.
> Food safety standards or tolerance limits for toxic
contamination residue
For mercury, the commercial level is 0.5 ppm for the fish.
J. WASTEWATER TREATMENTS (Q)
J1 GENERATION OF POLLUTANTS IN THE CATCHMENT AREA
(a) Pristine lake environments.
L. DEVELOPMENT PLANS (Q)
No development plans apart from permitting logging, cottage
development and
fishing and hunting outfitters will be permitted to establish
bases in the
area.
M. LEGISLATIVE AND INSTITUTIONAL MEASURES FOR UPGRADING
LAKE
ENVIRONMENTS (Q)
M1 NATIONAL AND LOCAL LAWS CONCERNED
> Names of the laws (the year of legislation)
(1) Loi sur la qualite de l'environnement, L. R. Q., c. Q-2
> Responsible authorities
(1) Government of Quebec
> Main items of control
(1) All kinds of pollution
M2 INSTITUTIONAL MEASURES
(1) Ministere du Loisir, de la Chasse et de la Peche (Quebec),
Ministere de
l'Environnement (Quebec), Environment Canada
N. SOURCES OF DATA
