
MUSKOKA LAKE
East shore of the lake with a steamboat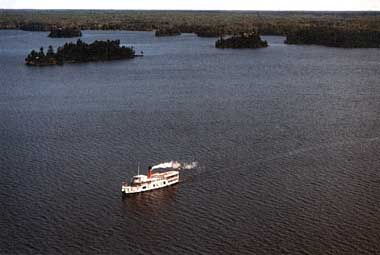
Photo: Ontario Ministry of Tourism and Recreation
A. LOCATION
Muskoka District, Ontario, Canada.45:0N, 79:5W; 225.2 m above sea level.
B. DESCRIPTION
Muskoka Lake is the largest of a group of scenic lakes in the rocky uplands of southern Ontario located 200 to 240 km north of Toronto and 20 km east of Georgian Bay. The term "Muskoka" may come from the Huron Indian names "musquash" and "ooka" meaning "the place where the large rocks are red" (17).The swift flowing Muskoka River empties the combined discharges of the Muskoka District Lakes into Lake Muskoka which discharges into the Moon River which empties into Georgian Bay. Between Precambrian Shield outcrops of igneous metamorphic rocks are dense forests of balsam fir, pine and spruce, as well as numerous bogs, and some farm pasture fields. The many birch and maple trees add color to the annual autumn display which attracts thousands of visitors to the area each year. The Muskoka Lakes District is one of the most famous summer cottage and resort areas in Canada. Well known resort areas include Bala, Baysview, Bracebridge, Dorset, Gravenhurst, and Port Sydney.
In 1850, the government of what was then Upper Canada, opened the 1,620 km2 Muskoka Lakes District for settlement but very few people came. Eighteen years later the new government of Ontario offered 40 hectares of Muskoka land free to individuals and another 40 free to families on condition that they cleared 6 ha and built a substantial log house within 5 years (17). Americans and Canadians began visiting the Muskoka Lakes in increasing numbers in the 1870's when rail and paddlewheel ships provided access to many of the larger Muskoka Lakes. The lower Muskoka Lakes, including Muskoka, Rosseau and Joseph, were water connected by a small lock which allowed boat deliveries to resort hotels along the 480 km of combined shoreline.
Initially, logging of vast stands of white pine provided a mainstay for the economy of the area but by 1910 the vast majority of the white pine had been logged out. While there was in the past some industry in the towns, (e. g. textile mills in Bracebridge and boat builders in some of the lower lakes), limited farming and servicing the influx of tourists to the area each summer became the main economic activity and it remains so to this day. Today there are more than 20,000 cottages (average cost $ 250,000) and 130 hotels and motels crowded into the Muskoka Lakes District. The number of visitors to the district is now approaching 1.5 million per year (17).
Gravenhurst Bay on Lake Muskoka has been sampled every year from 1969 to 1985 by the Ontario Ministry of Environment. During the "70's" Gravenhurst Bay experienced periodic algal blooms associated with excessive nutrient inputs (2). In 1971 the Gravenhurst Bay Sewage Treatment Plant became one of the first sewage treatment plants in Ontario to be equipped with phosphorus removal technology. As a result, phosphorus loading and chlorophyll concentrations declined until 1975 when a second sewage treatment plant in Gravenhurst Bay began discharging nutrient rich effluent into the bay. This was corrected in April of 1976 and further improved by diverting sewage from the bay in 1989. While most of Lake Muskoka maintains oligotrophic conditions, restricted areas such as Gravenhurst Bay at the southern end of the lake near the town of Gravenhurst have shown deterioration of water quality. However, today the levels of enrichment are low (mean annual phosphorus = 5.3 micro g l-1) as are whole lake chlorophyll concentrations (1.52 æg- 1)(1).
The Muskoka lake drainage basin receives between 30 and 40 kg ha-1 yr-1 of sulfate from acid precipitation. The alkalinity of Muskoka Lake is low and therefore the lake has been placed in the moderate risk class with regard to its potential for lake acidification (1).
There is sport-fishing for lake trout, rock bass and small mouth bass but the presence of mercury in all three of these species has resulted in their limited consumption as recommended by the provincial government. These limits suggest that lake trout larger than 45 cm and small mouth bass larger than 35 cm should not be eaten. It is believed that the mercury enters the lake from the natural weathering of mercury-rich soils in the drainage basin and from long range transport. Both phenomena are currently under investigation by the Ontario Ministry of the Environment.
C. PHYSICAL DIMENSIONS (1, 2, 7)
| Surface area [km2] | 89 |
| Volume [km3] | 1.387 |
| Maximum depth [m] | 67 |
| Mean depth [m] | 15.5 |
| Water level | Regulated |
| Normal range of annual water | |
| level fluctuation [m] | 1.0 |
| Length of shoreline [km] | 285.3 |
| Catchment area [km2] | 409 (2), 1,780 (7) |
D. PHYSIOGRAPHIC FEATURES
D1 GEOGRAPHICALSketch map: Fig. NAM-24-0l.
Bathymetric map: Fig. NAM-24-02.
Names of main islands
Acton (4.4 km2), Bala Park (4.3 km2), Browning (4.2 km2), Eilean Gowan (1.8 km2) and Tonderson (1.4 km2).
Number of outflowing rivers and channels (name): 1 (Moon R.).
D2 CLIMATIC
Climatic data at Muskoka Airport, 1951-1980 (3)
Mean temp. [deg C]*
| Jan | Feb | Mar | Apr | May | Jun | Jul | Aug | Sep | Oct | Nov | Dec | Ann. |
|---|---|---|---|---|---|---|---|---|---|---|---|---|
| -10.4 | -9.6 | -3.8 | 4.5 | 10.9 | 15.9 | 18.3 | 17.4 | 13.2 | 7.5 | 1.1 | -7.1 | 4.8 |
| Jan | Feb | Mar | Apr | May | Jun | Ju | Aug | Sep | Oct | Nov | Dec | Ann. |
|---|---|---|---|---|---|---|---|---|---|---|---|---|
| 86 | 62 | 66 | 73 | 78 | 82 | 78 | 89 | 102 | 94 | 101 | 98 | 1,009 |
Sketch map (Q).
Bathymetic map (Q).
Number of hours of bright sunshine (Lindsay): 1,843 hr yr-1.
Solar radiation: 13.4 MJ m-2 day-1.
Water temperature: Fig. NAM-24-03.
Isotherms [deg C] at a centrally located station in Gravenhurst Bay based on weekly measurements May-October, 1973 and 1974 (10).
Mixing type: Dimictic.
Notes on water mixing and thermocline formation
In 1973 and again in 1974 Gravenhurst Bay became isothermic at 8øC
in late October (fall turnover). Spring overturn occurred in late April
or early May (7).
E. LAKE WATER QUALITY
Gravenhurst Bay, South Bay, Stephens Bay, Birch Island, Walker's Point, Pine Needle Point, Bala Point, Dudley Bay, North Bay, East Bay, Crown Island, Pudding Rock, and Muskoka Bay in 1969-1986.E1 TRANSPARENCY Mean annual Secchi transparency in 1986 was 4.9 m with a range from 4.1 to 5.7 m (1). In 1969 the minimum Secchi transparency was 2.6 m and the maximum was 6.4 m with a mean of 4.3 m (7)(cf. Fig. NAM-24-04).
Seasonal variations in Secchi disc visibility [m] at a centrally-located station in Gravenhurst Bay during the ice-free periods, 1969-1974 (10).
E2 pH
Mean annual pH in 1986 ranged from 6.7 to 6.9 (one standard deviation)
with a mean of 6.82 (1). Alkalinity = 92.7E.6 micro g l-1 as CaCO3 (1).
E4 DO Hypolimnetic dissolved oxygen concentrations were <5
mg l-1 at the Gravenhurst and Stevens Bay sampling stations during the
summer of 1986 (1). In 1969 anaerobic or near anaerobic conditions developed
in the hypolimnion of Gravenhurst Bay. The oxygen deficit was particularly
extreme in Gravenhurst Bay where as early as July 15, 1969, the dissolved
oxygen concentrations fell to 4 mg l-1 (7).
Seasonal isopleths of dissolved oxygen [mg l-1] in Gravenhurst Bay based on weekly measurements, May-October 1969, 1973 and 1974 (10).
E6 CHLOROPHYLL CONCENTRATION [micro g l-1]
Gravenhurst Bay, 1969-1986: 1.52 E0.26.
Seasonal distribution of chlorophyll a [micro g l-1] in the euphotic zone at a centrally located station in Gravenhurst Bay during ice-free periods, 1972 -1974 (10).
E7 NITROGEN CONCENTRATION [micro g l-1]
NO3-N: 213.1 E24.9.
NH4-N: 9.9 E3.8.
Total Kjeldahl N: 210.2 E17.8.
Seasonal distributions of total inorganic nitrogen (expressed as mg l-1 free ammonia, nitrate and nitrite nitrogen) in the euphotic zone and at 1 m or 2 m above bottom at a centrally located station in Gravenhurst Bay during ice-free periods, 1969-1974 (10).
E8 PHOSPHORUS CONCENTRATION
Total P [micro g l-1]
1986: 11.4 E2.3.
Seasonal distributions of total phosphorus [micro g l-1] in the euphotic zone and at 1 m or 2 m above bottom at a centrally located station in Gravenhurst Bay during ice-free periods, 1969-1974 (10).
E9 CHLORIDE CONCENTRATION [mg l-1](1) 1986: 3.81.
E10 PAST TRENDS: Fig. NAM-24-09 and 10.
Past trend of the average concentration of total phosphorus. Data based on tables from reference (1).
Past trend of the average concentration of total chlorophyll. Data based on tables from reference (1).
F. BIOLOGICAL FEATURES (Q)
Gravenhurst Bay and Central Lake, 1969-1986F1 FLORA
Emerged macrophytes (12)
Pontederia cordata, Scirpus validus, Scirpus sp., Sagittaria latifolia, Typha spp.
Floating macrophytes (12)
Lemna minor, Potamogeton natans, Nuphar advena, Nymphaea tuberosa, Brasenia schreberi
Submerged macrophytes (12)
Potamogeton pectinatus, P. amplifolius, P. richardsonii, Najas flexilis, Elodea canadensis, Myriophyllum sp., Vallisneria americana
Phytoplankton
Asterionella formosa is the most abundant euplanktonic diatom in Lake Muskoka (7). Tabellaria fenestrata and Rhizosolenia eriensis are the major subdominants (ibid.). The class Cryptophyceae was dominated by Rhodomonas minutas and Cryptomonas erosa which became abundant only after remedial measures were taken to reduce phosphorus loading to Gravenhurst Bay (7). During the late 60's and early 70's when Gravenhurst Bay was eutrophic, nuisance blooms of Aphanizomenon flos-aquae and Anabaena spp. formed in mid.summer and early fall (7). The abundance of these nuisance algae and a number of chroococalean blue-greens declined following phosphorus removal at the Gravenhurst Sewage Treatment Plant (7).
Seasonal distribution of phytoplankton stocks and composition in the euphotic zone at a centrally-located station in Gravenhurst Bay during ice-free periods, 1969, 1972 and 1973. Quantitative results are expressed as Areal Standard Units (A.S.U) ml-1 (10).
Phytoplankton stocks and composition in the euphotic zone at Station M-l during the ice-free seasons of 1969 and 1970 (7).
F2 FAUNA
Zooplankton
Because Lake Muskoka is relatively shallow, calanoid copepods such
as Senecella calanoides, Epischura lacustris and Diaptomus sicilis were
relatively rare while cyclopoid copepods such as Cyclops bicuspidatus thomasi
and Mesocyclops edax were far more abundant (7). Cyclops bicuspidatus thomasi
reached a maximum density of 289 organisms 1-1 on 6 June, 1969 (7). Daphnia
galeata mendotae was the dominant cladoceran in the lake while Bosmina
coregoni coregoni was subdominant (7).
Seasonal changes in relative abundance of zooplankton populations at Station M-l in Gravenhurst Bay for the sampling period from May 22 to September 24, 1969 (7).
Benthos
The macroinvertebrate densities in Lake Muskoka ranged between 150
and 390 m-2 which is indicative of an oligotrophic system (7). Prior to
phosphorus removal at the sewage treatment plants in Gravenhurst Bay, the
benthic invertebrate densities reached two to three times these levels
(ibid.). The presence of the tubificid (sludge) worms Limnodrillus hoffmeisteri
and Tubifex tubifex in Gravenhurst Bay in 1969 added further support to
the concern that it was undergoing rapid eutrophication (7). Conditions
never became sufficiently enriched to support the eutrophic indicator assemblage
of midges which is typically dominated by Chironomus plumosus group. Areas
of the lake outside of Gravenhurst Bay were dominated by the moderately
oligotrophic indicators, Micropsectra sp. and Phaenopsectra sp. (ibid.).
The absence of spherids from Gravenhurst Bay (M-l) in 1969 was attributed
to its overenrichment, while the presence of Pisidium conventus and P.
casertanum in other parts of the lake was consistent with the more oligotrophic
character of the major part of this large body of water (7).
Fish (14)
Salvelinus namaycush*, Micropterus salmoides*, M. dolomieui*, Stizostedion
vitreum, Coregonus clupeaformis*, Esox lucius, Catostomus commersoni, Osmerus
mordax, Perca flavescens.
* Economically important.
G. SOCIO-ECONOMIC CONDITIONS (15)
G1 LAND USE IN THE CATCHMENT AREA1986
| Area [km2] | [%] | |
|---|---|---|
| Natural landscape | ||
| Woody vegetation | 4,500 | 94 |
| Swamp | 230 | 4.8 |
| Agricultural land | ||
| Crop field | negligible | |
| Pasture land | 50 | 1.0 |
| Residential area | 5 | 0.1 |
| Total | 4,785 | 100 |
Coniferous forest and wetland vegetation.
Types of important herbaceous vegetation
Some commercial pasture and fodder lands.
Main kinds of crops and/or cropping systems: Some fodder crops.
Levels of fertilizer application on crop fields: Light.
Trends of change in land use in recent years (17)
Increased tourist visits and construction of summer (seasonal) houses along the shore. Some of these houses have been winterized for year round occupancy, primarily by retirees. To date there are approximately 40,000 year-round residents in the Muskoka Lakes District.
G2 INDUSTRIES IN THE CATCHMENT AREA AND THE LAKE
1986
| No. of | Main products or | |
|---|---|---|
| persons engaged | major industries | |
| Primary industry | ||
| Animal husbandry | 495 | Dairy products & forestry |
| Secondary industry | 10,630 | Construction & manufacturing |
| Tertiary industry | 7,965 | Government & tourism |
| Total | 19,090 |
Manufacturing 2,455, construction 2,215, service 3,515, government 1,190, other 9,715, total 19,090.
G3 POPULATION IN THE CATCHMENT AREA (16)
1986
| Population | Major cities | ||
|---|---|---|---|
| Population | density [km-2] | (population) | |
| Urban | 21,055 | - | Bracebridge (12,130) |
| Rural | 18,180 | - | Gravenhurst (8,925) |
| Total | 39,235 | 22.0 |
H. LAKE UTILIZATION
H1 LAKE UTILIZATION (17)Recreation (swimming, sport-fishing, yachting*).
* A recent survey reported an average of 6.2 boats per cottage.
I. DETERIORATION OF LAKE ENVIRONMENT AND HAZARDS
I1 ENHANCED SILTATIONExtent of damage: Not serious.
I2 TOXIC CONTAMINATION
Present status: Mercury in fish.
Supplementary notes
Fish consumption advisories have been declared for lake trout, rock bass and small mouth bass due to their elevated muscle mercury content. It is believed that the mercury enters the lake from the natural weathering of mercury-rich soils in the drainage basin and from long range transport.
I3 EUTROPHICATION Nuisance caused by eutrophication
Unusual algal blooms from 1970's no longer occur Dominant species of algae at that time; Aphanozomenon flos-aquae and Anabaena spp.
Nitrogen and phosphorus loadings to the lake (7)
1969
| Sources | [t yr-1] | [%] |
| Land drainage | 68.7 | |
| Cottage input | 5.6 | |
| Resort input | 0.4 | |
| Municipal input | 21.2 | |
| Rainfall | 2.3 | |
| From upstream | 1.8 | |
| Total | 95.6 | 100.0 |
I4 ACIDIFICATION
Extent of damage: Acid rain impact on lake detected but not serious.
J. WASTEWATER TREATMENTS (Q)
J1 GENERATION OF POLLUTANTS IN THE CATCHMENT AREA- d) Significant development of the catchment area with some provision
for municipal and/or industrial wastewater treatment or agricultural runoff
control, resulting in measurable discharge of pollution load into the lake.
M. LEGISLATIVE AND INSTITUTIONAL MEASURES FOR UPGRADING LAKE ENVIRONMENTS (Q)
A 1970 questionnaire indicated that 30% of the cottages in the Muskoka Lakes have automatic dishwashers which use phosphorus-based detergents. On the other hand, federal regulations reduced the phosphorus content as P2O5 in laundry detergents from approximately 50% to 20% in 1970. Additional regulations which were proclaimed by the federal government of Canada on January 1, 1973 further decreased the phosphate content to 5% (7). Whether this reduction in phosphorus levels in dishwasher detergents has been effective is not known because most cottages on the lake have septic tank and drainage tile systems which retain a large part of the phosphorus if operating effectively.M1 NATIONAL AND LOCAL LAWS CONCERNED
Names of the laws (the year of legislation)
- Canada Fisheries Act
- Canada Navigable Waters Protection Act
- Canada Water Act
- Canada Environmental Contaminants Act Responsible authorities
- Ontario Ministry of the Environment (O. M. E.)
- Ontario Ministry of Natural Resources (O. M. N. R.)
- Environment Canada (Federal Department of Environment) Main items of control
- Municipal and industrial discharges of waters & waste waters
- Consumption withdrawal division
- Sport and commercial fishery
- Habitat protection and water related resources
- Muskoka Lakes Association (1894)(17)
- Gravenhurst Town Council
- OME Dorset Limnology Lab
N. SOURCES OF DATA
- Questionnaire filled by Dr. M. Dickman, Biological Sciences Dept., Brock University, St. Cathrines, Ontario and Dr. M. Foy Water Quality Branch, Central Region, Ministry of the, Environment, Toronto, Ontario.
- Reid, R. A. & Girard, R. (1988) Muskoka Lakes Project: A Progress Report of the 1986 Data. Data Report #88/1, Water Resources Branch, Ontario Ministry of Environment, Dorset, Ontario.
- Cox, E. T. (1978) Counts and Measurements of Ontario Lakes. Ontario Ministry of Natural Resources.
- Canadian Climate Normals (1951-1980) Environment Canada, Atmospheric Environment Service.
- ) McKay, D. C. & Morris, R. J. (1985) Solar Radiation Data Analyses for Canada (1967-1976) Vol. 3: Ontario. Environment Canada, Atmospheric Environment Service.
- Unpublished data by Ken Nicholls, OME, Rexdale, Ontario.
- Dilon, P. J., Nicholls, K. H. & Robinson, G. W. (1978) Phosphorus removal at Gravenhurst Bay, Ontario: An eight year study on water quality changes. Verh. Intern. Verein. Limnol., 20: 263-271.
- O. M. E. (1986) Estimations of the Presence and Impact of Filamentous and Odour-producing Algae. A Survey Cottagers on 214 Ontario Recreation Lakes, SPR Assoc. Inc. Nat'l Mail Surveys Inc., Toronto Dec. 17, 1986.
- Michalski, M. F. P., Johnson, M. G. & Veal, D. M. (1973) Muskoka Lakes Water Quality Evaluation. O. M. E. Report No. 3, Eutrophication of the Muskoka Lakes. Available from Brock University Library DOC, CA2, ON, EV, M74, No. 3.
- Boelens, R. G. V. & Rumsey, C. (1972) DDT Residues in the Muskoka Lakes System. Ontario Ministry of the Environment Report. 76 pp.
- Michalski, M. F. P. & Robinson, G. W. (1971) Muskoka Lakes Eutrophication Study, Report No. 1, Background Information and Survey of Cottagers. 21 pp. Ontario Water Resources Commission, Division of Laboratories.
- Michalski, M. F. P. & Nicholls, K. H. (1975) Phosphorus Removal and Water Quality Improvements in Gravenhurst Bay, Ontario. Ontario Ministry of the Environment. 36 pp. Available from Brock University Library DOC, CA2, ON, EV, 85 No. 5.
- Vollenweider, R. & Kerekes, J. (1980) The loading concept as a basis for controlling eutrophication. Philosophy and preliminary results of the OECD programme on eutrophication. Prog. Water Technol., 12: 5-18.
- Dickman, M. (1984) Limnology class (Biol. 363) survey of the macrophytes of Bracebridge and Gravenhurst areas of Lake Muskoka. Unpublished data.
- Mckay, H. H. (1969) Fishes of Ontario. Department of Lands and Forests, Ontario Fish and Wildlife Branch.
- Hubbs, C. L. & Lagler, K. F. (1985) Fishes of the Great Lakes Region. Cranbrook Institute Scientific Bulletin, no. 26.
- National Topographic System, 1:50,000. Surveys & Mapping Branch, Dept. of Energy, Mines & Resources, Ottawa (1981). Sheets M31 E-F.
- Statistics Canada (1986) Census Profiles: Ontario, pp. 438-441.
- Gorrie, P. (1989) Muskoka: Growing pains in cottage country. Canadian Geographic, 109: 12-23.
