
LAKE DILLON
A view from the lakeside hill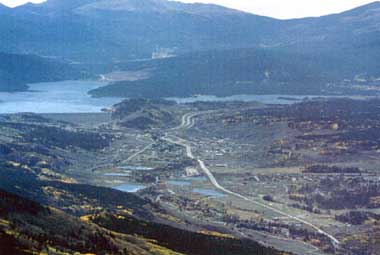
Photo: J. Klobucar
A. LOCATION
Colorado, USA.39:5N, 106:3W; 2,750 m above sea level.
B. DESCRIPTION
Lake Dillon is an impoundment of the Blue River just below its confluence with the Snake River and Tenmile Creek. The watershed drains elevations between lake level at about 2,750 m and the mountainous headwaters of the three inflowing rivers at elevations as high as 4,300 m. For at least the first decade after its creation in 1963, Lake Dillon was considered unequivocally oligotrophic, as shown by its high transparency. Because of its location, Lake Dillon would be expected to remain oligotrophic indefinitely if the watershed were uninhabited or very sparsely inhabited. Watersheds at high elevations in the Central Rockies are seldom rich in phosphorus because the parent material, which lies relatively close to the surface, consists mostly of hard crystalline rock that is resistant to weathering and poor in phosphorus. In addition, the natural vegetative cover effectively holds the particulate phosphorus inventory, as shown by the clarity of stream in undisturbed areas, even at times of peak runoff.The water of Lake Dillon is under the direct control of the Denver Water Department, which uses the lake as the main storage facility for the city of Denver. Recreational activities on the lake are managed by the U.S. Forest Service. The lake is a popular sport-fishing site for rainbow trout, brown trout and kokanee salmon, and, because of a significant spawning run of brown trout up the Blue River, is of use to the state as a source of brown trout eggs. Numerous permanent homes and vacation homes lie within sight of the lake and most of the owners of these properties would probably regard the blue color and high transparency of the lake as an aesthetically or economically valuable amenity.
The background total phosphorus concentrations for the watershed in complete absence of human activity would be only about 5 æg/l P. Such low background phosphorus concentrations can maintain lakes of very low algal standing crop and thus of high transparency and beautifully blue water. Reservoirs and natural lakes in the midwestern and southeastern United States, while thoroughly studied, are less similar to Dillon in these important respects. Lake Tahoe comes to mind as a good comparison for Dillon and will occasionally be useful, but Lake Tahoe is considerably more oligotrophic than Lake Dillon, owing largely to its great mean depth and small ratio of watershed area to lake volume (1).
C. PHYSICAL DIMENSIONS (1)
| Surface area [km2] | 13 |
| Volume [km3] | 0.323 |
| Mean depth [m] | 24.1 |
| Water level | Regulated |
| Length of shoreline [km] | 39.4 |
| Catchment area [km2] | 852 |
D. PHYSIOGRAPHIC FEATURES
D1 GEOGRAPHICAL (1)Bathymetric map: Fig. NAM-22-0l.
Number of outflowing rivers and channels (name): 1 (Blue R.).
D2 CLIMATIC Climatic data at Denver (2)
Mean temp. [deg C]
| Jan | Feb | Mar | Apr | May | Jun | Jul | Aug | Sep | Oct | Nov | Dec | Ann. |
|---|---|---|---|---|---|---|---|---|---|---|---|---|
| -1.1 | 0.3 | 3.3 | 8.6 | 13.7 | 19.4 | 23.0 | 22.2 | 17.5 | 11.3 | 4.0 | 0.6 | 10.2 |
| Jan | Feb | Mar | Apr | May | Jun | Jul | Aug | Sep | Oct | Nov | Dec | Ann. |
|---|---|---|---|---|---|---|---|---|---|---|---|---|
| 14 | 18 | 31 | 54 | 69 | 37 | 39 | 33 | 29 | 26 | 18 | 12 | 380 |
Bathymetric map (1).
Water temperature: Fig. NAM-22-02.
Time-depth diagram for water temperature [deg C](1).
Freezing period: January-April (1).
Mixing type: Dimictic (1).
E. LAKE WATER QUALITY
E1 TRANSPARENCY: Fig. NAM-22-03.
Secchi depth and 1% light depth [m].
E2 pH: Fig. NAM-22-04.
Seasonal change of pH value.
E3 SS: Fig. NAM-22-05.
Time-depth diagram for SS [mg l-1].
E4 DO
Station II: cf. Fig. NAM-22-06.
Time-depth diagram for DO [mg l-1].
E6 CHLOROPHYLL CONCENTRATION: Fig. NAM-22-07.
Time-depth diagram for chlorophyll a [micro g l-1].
E7 NITROGEN CONCENTRATION
NO3-N: Fig. NAM-22-08.
Time-depth diagram for NO3-N [micro g l-1].
Total-N: Fig. NAM-22-09.
Total nitrogen and nitrogen fractions in the top 5 m.
E8 PHOSPHORUS CONCENTRATION: Fig. NAM-22-10 and 11.
Total phosphorus and phosphorus fractions in the top 5 m.
Total phosphorus and phosphorus fractions in deep water (40-45 m).
F. BIOLOGICAL FEATURES (1)
F1 FLORAPhytoplankton
Synechococcus lineare, Lyngbia limnetica, Monoraphidium contortum, Scenedesmus granulatus, Asterionella formosa, Synedra radians, Rhizosolenia eriensis, Rhodomonas minuta.
F2 FAUNA
Zooplankton
Polyarthra vulgaris, Keratella cochlearis, K. quadrata, Diacyclops bicuspidatus thomasi, Mysis reticta.
F3 PRIMARY PRODUCTION RATE: Fig. NAM-22-12.
Primary production per unit area.
F4 BIOMASS: Fig. NAM-22-13 and 14.
Total zooplankton biomass (wet weight).
Zooplankton abundance.
I. DETERIORATION OF LAKE ENVIRONMENTS AND HAZARDS (1)
I1 ENHANCED SILTATIONExtent of damage: Not serious.
I2 TOXIC CONTAMINATION
Present status: None.
I3 EUTROPHICATION
Nitrogen and phosphorus loadings to the lake [kg yr-1]
T-N: 151,400, T-P: 4,800.
I4 ACIDIFICATION
Extent of damage: None.
I5 OTHER HAZARDS: Not detected.
J. WASTEWATER TREATMENTS (1)
J1 GENERATION OF POLLUTANTS IN THE CATCHMENT AREA- c) Limited pollution with wastewater treatment.
Natural vs. man-made
| P load [%] | N load [%] | |||
|---|---|---|---|---|
| 1981 | 1982 | 1981 | 1982 | |
| Natural | 47 | 54 | 36 | 50 |
| Man-made | 53 | 46 | 64 | 50 |
| P load [%] | N load [%] | |
|---|---|---|
| Background runoff | 45 | 45 |
| Major treatment plants | 16 | 12 |
| Septic | 8 | 15 |
| Precipitation | 13 | |
| Molybdenum mining | 16 | |
| All other sources | 18 | 12 |
| Total | 100 | 100 |
Municipal wastewater treatment systems
No. of tertiary treatment systems: 3.
K. IMPROVEMENT WORKS IN THE LAKE (1)
None.L. DEVELOPMENT PLANS (1)
None.M. LEGISLATIVE AND INSTITUTIONAL MEASURES FOR UPGRADING LAKE ENVIRONMENTS (1)
M1 NATIONAL AND LOCAL LAWS CONCERNEDResponsible authorities
- Denver Water Department, Colorado
- U.S. Forest Service
N. SOURCES OF DATA
- Lewis, Jr., W. M., Saunders, III, J. F., Crumpacker, D. W. & Brendecke, C. (1984) Eutrophication and Land Use. 202 pp. Springer-Verlag, New York- Berlin-Heidelberg-Tokyo.
- Muller, M. J. (1982) Selected Climatic Data for a Global Set of Standard Stations for Vegetation Science. 306 pp. Dr. W. Junk Publishers, the Hague.
