
LAKE OKEECHOBEE
In the Hydrilla of the lake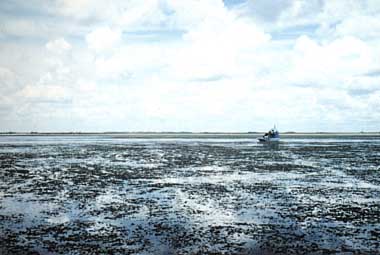
Photo: T. R. Batterson
A. LOCATION
Florida, USA. 26:0 - 27:2 N, 80:7 - 81:8 W; 4 m above sea level.B. DESCRIPTION
Lake Okeechobee ranks as the second largest freshwater lake in the United States after Lake Michigan. The lake is centrally located in South Florida. The lake originated by gentle epeirogenetic uplift of an irregular marine surface. Uneven sedimentation by currents formed the original submarine depression during the Pliocene. Recession of the sea during the Pleistocene probably formed the lake itself. The original lake was increased greatly by organic peat accumulation along the southern rim of the lake about 6,300 years ago. This natural dam reached its maximum elevation less than 2,000 years ago. In its natural state Lake Okeechobee had no channelized outflows. The 382 km2 emergent marsh represents a resource of regional significance that is heavily utilized by both feeding and nesting wading birds during the latter part of the dry season, when most other interior South Florida wetlands have dried. In years of below average rainfall, the lake marshes may provide critical habitat which supports nesting colonies from other locations.Since the early 1900's major channel improvements and canal systems have been introduced. Most of the present drainage and water supply system was designed and constructed by the U.S. Army Corps of Engineers and is maintained and operated by the South Florida Water Management District. Erection of low muck levees along the south and southwest shores eliminated sheet flow into the Everglades in the early 1920's. These original levees were breached by the 1926 and 1928 hurricanes with the resultant loss of over 2,100 lives. This catastrophe resulted in the Corps of Engineers building a larger levee around the southern end of the lake. Construction of this section of levee was completed in 1937. Later, between 1960 and 1964, the levee was raised several additional feet and extended around the entire lake. Today the lake is completely surrounded by a large levee.
Lake Okeechobee contains highly mineralized water for an eastern lake which is dominated by calcium, sodium, chloride and bicarbonate ions. The lake also has moderately high and variable color levels, high daytime dissolved oxygen concentrations and an average percent O2 saturation of 100 percent. The geological formations in the lake's watershed are naturally rich in phosphorus and nitrogen; thus edaphic factors seem to provide the basis for the lake's eutrophic condition (8, 9).
C. PHYSICAL DIMENSIONS (1, 2, 3)
| Surface area [km2] | 1,894 |
| Maximum depth [m] | 4.5 |
| Water level | Regulated |
| Normal range of annual water | |
| level fluctuation [m] | 1.1 |
| Length of shoreline [km] | 216 |
| Residence time [yr] | 3.5 |
| Catchment area [km2] | 12,394 |
D. PHYSIOGRAPHIC FEATURES
D1 GEOGRAPHICAL Sketch map: Fig. NAM-20-0l. Names of main islands: Kreamer, Ritta, Torry and Observation (3). Number of outflowing rivers and channels (name) 6 (Three Mile Canal, North New River Canal, Palm Beach Canal, Hillsboro Canal, Miami Canal and St. Lucie Canal)(3, 4). All inflows and outflows are completely regulated except for one creek and some canals are required to provide drainage into the lake.D2 CLIMATIC Climatic data at Miami Mean temp. [deg C]
| Jan | Feb | Mar | Apr | May | Jun | Jul | Aug | Sep | Oct | Nov | Dec | Ann. |
|---|---|---|---|---|---|---|---|---|---|---|---|---|
| 19.4 | 19.9 | 21.4 | 23.4 | 25.3 | 27.1 | 27.7 | 27.9 | 27.4 | 25.4 | 22.4 | 20.1 | 23.9 |
Sketch map (2, 4).
| Station | 1 | 2 | 3 | 4 | 5 | 6 | 7 | 8 | Whole lake |
|---|---|---|---|---|---|---|---|---|---|
| 24.1 | 24.3 | 25.9 | 25.8 | 25.1 | 25.1 | 25.3 | 25.3 | 25.1 |
Sampling stations set up in the lake.
E. LAKE WATER QUALITY (5)
E1 TRANSPARENCY [m] October 1985-September 1986| Station | 1 | 2 | 3 | 4 | 5 | 6 | 7 | 8 | Whole Lake |
|---|---|---|---|---|---|---|---|---|---|
| .5 | .5 | .5 | .4 | .7 | .4 | .5 | .9 | .5 |
| Station | 1 | 2 | 3 | 4 | 5 | 6 | 7 | 8 | Whole Lake |
|---|---|---|---|---|---|---|---|---|---|
| 8.0 | 8.0 | 7.9 | 7.9 | 8.3 | 8.1 | 7.9 | 7.9 | 8.0 |
| Station | 1 | 2 | 3 | 4 | 5 | 6 | 7 | 8 | Whole Lake |
|---|---|---|---|---|---|---|---|---|---|
| 13 | 15 | 15 | 14 | 11 | 19 | 12 | 7 | 13 |
| Station | 1 | 2 | 3 | 4 | 5 | 6 | 7 | 8 | Whole Lake |
|---|---|---|---|---|---|---|---|---|---|
| 8.6 | 8.9 | 8.7 | 8.7 | 9.0 | 9.0 | 8.6 | 8.6 | 8.8 |
| Station | 1 | 2 | 3 | 4 | 5 | 6 | 7 | 8 | Whole Lake |
|---|---|---|---|---|---|---|---|---|---|
| 25.9 | 27.8 | 19.7 | 18.4 | 31.2 | 35.0 | 13.4 | 11.4 | 22.9 |
| Station | 1 | 2 | 3 | 4 | 5 | 6 | 7 | 8 | Whole lake |
|---|---|---|---|---|---|---|---|---|---|
| .02 | .02 | .01 | .03 | .02 | .02 | .02 | .02 | .02 |
| Station | 1 | 2 | 3 | 4 | 5 | 6 | 7 | 8 | Whole lake |
|---|---|---|---|---|---|---|---|---|---|
| .038 | .020 | .078 | .074 | .007 | .041 | .108 | .088 | .057 |
| Station | 1 | 2 | 3 | 4 | 5 | 6 | 7 | 8 | Whole lake |
|---|---|---|---|---|---|---|---|---|---|
| 1.47 | 1.39 | 1.48 | 1.56 | 1.61 | 1.75 | 1.61 | 1.44 | 1.54 |
| Station | 1 | 2 | 3 | 4 | 5 | 6 | 7 | 8 | Whole lake |
|---|---|---|---|---|---|---|---|---|---|
| .017 | .010 | .014 | .015 | .006 | .007 | .022 | .017 | .014 |
| Station | 1 | 2 | 3 | 4 | 5 | 6 | 7 | 8 | Whole lake |
|---|---|---|---|---|---|---|---|---|---|
| .071 | .063 | .064 | .071 | .040 | .071 | .069 | .055 | .063 |
| Station | 1 | 2 | 3 | 4 | 5 | 6 | 7 | 8 | Whole lake |
|---|---|---|---|---|---|---|---|---|---|
| 78.7 | 84.7 | 87.5 | 86.2 | 84.3 | 87.3 | 88.8 | 89.0 | 85.8 |
Past trend of Total-N [mg l-1].
Past trend of Total-P [mg l-1].
F. BIOLOGICAL FEATURES
F1 FLORA Emerged macrophytes (2) Eleocharis cellulosa, Typha domingensis, Echinochloa walteri. Phytoplankton (6) Lyngbya limnetica, Aphanocapsa delicatissima, Raphidiopsis curvata, Merismopedia tenuissima, Scenedesmus quadricauda, Fragilaria pinnata, F. construens, F. capucina, Melosira granulata var. angustissima, Nitzschia lorenziana.F3 PRIMARY PRODUCTION RATE: Fig. NAM-20-05.
Gross primary productivity, 1981-1982 [mg C m-3 day-1](6).
Phytoplankton biovolume by class at station 8 in 1974 [(ml-1)x1.0E+6](7).
G. SOCIO-ECONOMIC CONDITIONS
G1 LAND USE IN THE CATCHMENT AREA (8) 1974-1980| Area [km2] | [%] | |
|---|---|---|
| Natural landscape | ||
| Woody vegetation | 930.2 | 7.5 |
| Herbaceous vegetation | 27.6 | 0.2 |
| Swamp | 1,694.2 | 13.7 |
| Idle | 438.2 | 3.5 |
| Range | 2,467.6 | 19.9 |
| Native | 1,254.2 | 10.1 |
| Others | 2.3 | 0.02 |
| Agricultural land | ||
| Crop field | 26.1 | 0.21 |
| Pasture land | 1,175.5 | 9.5 |
| Orchard | 443.3 | 3.6 |
| Others | 3,672.5 | 29.6 |
| Residential area | 253.5 | 2.1 |
| Others | 9.0 | 0.07 |
| Total | 12,394.2 | 100 |
| Population | Major cities | ||
|---|---|---|---|
| Population | density [km-2] | (population) | |
| Total | 522,865 | 42.2 | Okeechobee,Clewiston, |
| Belle Glade |
H. LAKE UTILIZATION (8)
H1 LAKE UTILIZATION Source of water, navigation and transportation, recreation (sport-fishing) and fisheries.I. DETERIORATION OF LAKE ENVIRONMENTS AND HAZARDS (5)
Il ENHANCED SILTATION Extent of damage: Not serious.I2 TOXIC CONTAMINATION Present status: Detected but not serious. Generalized distribution of contaminants in the lake water and sediments at river mouths 1986
| Station | Zinc phosphide in water [mg l-1] |
|---|---|
| 1 | .006 |
| 2 | .002 |
| 3 | .001 |
| Station | Aldrin | Diazinon | Malathion [mg kg-1] |
|---|---|---|---|
| 1 | N.D. | 1.1 | 3.2 |
| 2 | N.D. | 1.4 | 2.6 |
| 3 | 0.6 | 1.0 | 3.8 |
Sampling stations set up at the river mouth.
| Sources | Industrial+Domestic | Natural | Total |
|---|---|---|---|
| +Agricultural | |||
| T-N | 5,697.1 | 1,817.5 | 7,514.6 |
| T-P | 503.4 | 100.9 | 604.3 |
| '73 | '74 | '75 | '76 | '77 | '78 | '79 | |
|---|---|---|---|---|---|---|---|
| T-N | 6,792.6 | 8,067.1 | 6,410.3 | 6,659.9 | 6,475.9 | 9,142.0 | 8,277.0 |
| T-P | 547.5 | 743.5 | 371.4 | 533.5 | 524.4 | 687.1 | 810.4 |
J. WASTEWATER TREATMENTS (8)
J1 GENERATION OF POLLUTANTS IN THE CATCHMENT AREA- d) Measurable pollution with limited wastewater treatment.
M. LEGISLATIVE AND INSTITUTIONAL MEASURES FOR UPGRADING LAKE ENVIRONMENTS (8)
M3 RESEARCH INSTITUTES ENGAGED IN THE LAKE ENVIRONMENT STUDIES- Lake Okeechobee Technical Advisory Committee
- South Florida Water Management District
N. SOURCES OF DATA
- Questionnaire prepared by the editors with the support of Dr. T. R. Batterson, Michigan State University, based on the following sources. l) Hayashi, T. (ed.)(1981) World Encyclopedia. Vol. 4, p. 269, Heibon-sha, Tokyo.
- South Florida Water Management District (1987) Technical Memorandom: Vegetation Changes in the Lake Okeechobee Littoral Zone 1972 to 1982. 33 pp.
- Ibid. (1977) Technical Publication No. 77-1: The Major Plant Communities of Lake Okeechobee, Florida, and Their Associated Inundation Characteristics as Determined by Gradient Analysis. 68 pp.
- South Florida Water Management District (1983) Technical Memorandom: Lake Okeechobee Water Quality April 1981-March 1982, p. 8.
- South Florida Water Management District (1988) Technical Memorandom: Lake Okeechobee Water Quality Monitoring Program Annual Report Year Three October 1985-September 1986. 140 pp.
- South Florida Water Management District (1984) Technical Publication 84 - 4: Phytoplankton, Chlorophyll a, and Primary Production in Lake Okeechobee. 33 pp.
- South Florida Water Management District (1977) Technical Publication 77 - 2: Phytoplankton and Primary Productivity Studies in Lake Okeechobee during 1974, p. 46.
- South Florida Water Management District (1981) Technical Publication 81 - 2: Lake Okeechobee Water Quality Studies and Eutrophication Assessment. 270 pp.
- South Florida Water Management District (1984) Technical Publication 84 - 9: Wading Bird Utilization of Lake Okeechobee Marshes 1977-1981. 38 pp.
- U.S. Department of Commerce, Bureau of the Census (1978) County and City Data Book, 1977. A Statistical Abstract Supplement. 956 pp.
