LAKE CHICOT
A helicopter view of the blue water of upper lake and the muddy
water of lower lake
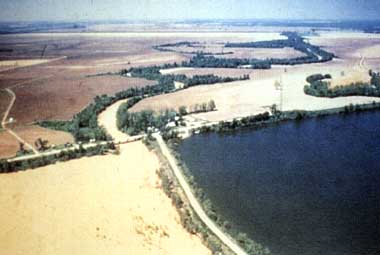
Photo: B. Morrison
A. LOCATION
Arkansas, USA. 33:6 - 33:3 N, 91:0 - 91:7 W; 31.5 m above sea level.
B. DESCRIPTION
Lake Chicot is an oxbow lake that was created more
than 600 years ago by the meandering of the Mississippi River. It is located
in Chicot County in southeastern Arkansas adjacent to the present Mississippi
River. As the largest natural lake in Arkansas, it earned an early reputation
for its good fishing and recreational value.
A flood in 1927 partially created a natural earth
dam dividing the lake into a large lower lake and a considerably smaller
upper lake. This dam was completed by the State of Arkansas. Development
of a levee system forced the enlargement of the lake's watershed to its
present 350 square miles.
Initially this alteration affected only the volume
flow through the lake, drastically reducing the water residence time. Because
the watershed was located in one of the most agriculturally productive
regions in the world, the land, predominantly comprised of clay and fine
silts, quickly became more intensively farmed. The use of agricultural
chemicals increased, large amounts of sediments were produced and the lake
began to become severely impacted by this activity.
In the early 1960's Congress enacted legislation
authorizing the Corps of Engineers to begin planning a method of restoring
the lake. Plans were made to construct three structures; a dam to prevent
poor quality water from entering the lake, a combination gravity flow-pump
facility to divert the poor quality water through the levee into the Mississippi
River, and a dam on the outflow to regulate lake levels and regulate discharge.
The structures were placed into operation during March 1985 and are operational
according to a plan to improve the water quality in the lake. These structures
and plans have resulted in a nearly complete restoration of the lake (Q).
C. PHYSICAL DIMENSIONS (1)
| Surface area [km2] |
17 |
| Volume [km3] |
0.0625 |
| Maximum depth [m] |
|
| (Upper lake) |
4.5 |
| (Lower lake) |
8.3 |
| Mean depth [m] |
|
| (Upper lake) |
3.0 |
| (Lower lake) |
3.8 |
| Water level |
Regulated |
| Length of shoreline [km] |
58.2 |
| Residence time [yr] |
0.4 |
| Catchment area [km2] |
906 |
D. PHYSIOGRAPHIC FEATURES (1)
D1 GEOGRAPHICAL Bathymetric map: Fig. NAM-19-01. Names of main islands:
None. Number of outflowing rivers and channels (name): 1 (Ditch Bayou).
D2 CLIMATIC Climatic data at Stoneville, 1983-1987
Mean temp [deg C]
|
|
|
|
|
|
|
|
|
|
|
|
|
| Jan |
Feb |
Mar |
Apr |
May |
Jun |
Jul |
Aug |
Sep |
Oct |
Nov |
Dec |
Ann. |
|
|
|
|
|
|
|
|
|
|
|
|
|
| 3.71 |
7.96 |
11.79 |
16.71 |
22.23 |
26.03 |
27.37 |
27.02 |
23.41 |
18.03 |
12.45 |
6.9 |
16.97 |
|
|
|
|
|
|
|
|
|
|
|
|
|
| Precipitation [mm] |
|
|
|
|
|
|
|
|
|
|
|
|
|
|
|
|
|
|
|
|
|
|
|
|
|
|
| Jan |
Feb |
Mar |
Apr |
May |
Jun |
Jul |
Aug |
Sep |
Oct |
Nov |
Dec |
Ann. |
|
|
|
|
|
|
|
|
|
|
|
|
|
| 66 |
144 |
115 |
106 |
168 |
112 |
52 |
53 |
47 |
118 |
197 |
128 |
1,306 |
Solar radiation: 16.47 MJ m-2 day-1.
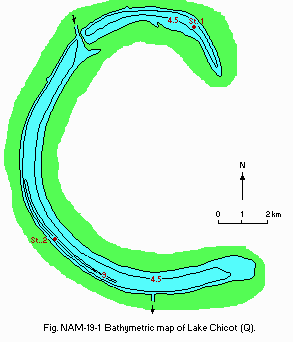
Fig. NAM-19-01
Bathymetric map (Q).
Water temperature [deg C] Station 1, January 1983-September 1987
|
|
|
|
|
|
|
|
|
|
|
|
|
| Depth[m] |
Jan |
Feb |
Mar |
Apr |
May |
Jun |
Jul |
Aug |
Sep |
Oct |
Nov |
Dec |
|
|
|
|
|
|
|
|
|
|
|
|
|
|
6.7 |
9.7 |
15.7 |
21.2 |
25.0 |
28.9 |
30.4 |
31.2 |
26.1 |
22.5 |
17.0 |
11.3 |
Station 2, January 1983-September 1987
|
|
|
|
|
|
|
|
|
|
|
|
|
| Depth[m] |
Jan |
Feb |
Mar |
Apr |
May |
Jun |
Jul |
Aug |
Sep |
Oct |
Nov |
Dec |
|
|
|
|
|
|
|
|
|
|
|
|
|
|
6.2 |
8.8 |
14.9 |
19.8 |
23.9 |
28.6 |
29.5 |
31.0 |
26.9 |
22.7 |
16.7 |
11.2 |
Freezing period: None. Mixing type: Polymictic. Notes on water mixing and
thermocline formation The lake stratifies during the summer and is in a
continuous mixing state from late fall to early spring.
E. LAKE WATER QUALITY (1)
In March 1985 the U.S. Army Corps of Engineers placed three structures
into operation. A downstream dam and gate regulates the lake level, an
upstream dam and gate prevents poor quality water from entering the lake
and a combination pump-gravity flow facility diverts poor quality water
to the adjacent Mississippi River. This changed the water quality in the
lower lake (station 2) after this date. For this reason, the water quality
data over the past five years is separated into two time-frames.
E1 TRANSPARENCY [m] Station 1, September 1982-March 1985
|
|
|
|
|
|
|
|
|
|
|
|
|
| Depth |
Jan |
Feb |
Mar |
Apr |
May |
Jun |
Jul |
Aug |
Sep |
Oct |
Nov |
Dec |
|
|
|
|
|
|
|
|
|
|
|
|
|
|
.20 |
.40 |
.21 |
.36 |
.33 |
.52 |
.43 |
.39 |
.45 |
.33 |
.47 |
.35 |
Station 2, September 1982-March 1985
|
|
|
|
|
|
|
|
|
|
|
|
|
| Depth[m] |
Jan |
Feb |
Mar |
Apr |
May |
Jun |
Jul |
Aug |
Sep |
Oct |
Nov |
Dec |
|
|
|
|
|
|
|
|
|
|
|
|
|
|
.17 |
.08 |
.11 |
.10 |
.08 |
.10 |
.12 |
.32 |
.45 |
.38 |
.31 |
.15 |
Station 1, April 1985-September 1987
|
|
|
|
|
|
|
|
|
|
|
|
|
| Depth[m] |
Jan |
Feb |
Mar |
Apr |
May |
Jun |
Jul |
Aug |
Sep |
Oct |
Nov |
Dec |
|
|
|
|
|
|
|
|
|
|
|
|
|
|
.60 |
.40 |
.28 |
.38 |
.55 |
.58 |
.31 |
.29 |
.27 |
.30 |
.48 |
.48 |
Station 2, April 1985-September 1987
|
|
|
|
|
|
|
|
|
|
|
|
|
| Depth[m] |
Jan |
Feb |
Mar |
Apr |
May |
Jun |
Jul |
Aug |
Sep |
Oct |
Nov |
Dec |
|
|
|
|
|
|
|
|
|
|
|
|
|
|
.53 |
.78 |
.80 |
.51 |
.75 |
.70 |
.50 |
.56 |
.51 |
.46 |
.57 |
.51 |
E2 pH Station 1, September 1982-March 1985
|
|
|
|
|
|
|
|
|
|
|
|
|
| Depth[m] |
Jan |
Feb |
Mar |
Apr |
May |
Jun |
Jul |
Aug |
Sep |
Oct |
Nov |
Dec |
|
|
|
|
|
|
|
|
|
|
|
|
|
|
7.3 |
7.6 |
7.5 |
7.9 |
7.3 |
7.7 |
8.4 |
7.4 |
7.8 |
7.6 |
7.2 |
7.3 |
Station 2, September 1982-March 1985
|
|
|
|
|
|
|
|
|
|
|
|
|
| Depth[m] |
Jan |
Feb |
Mar |
Apr |
May |
Jun |
Jul |
Aug |
Sep |
Oct |
Nov |
Dec |
|
|
|
|
|
|
|
|
|
|
|
|
|
|
6.8 |
7.1 |
6.9 |
7.6 |
6.6 |
7.2 |
7.7 |
7.5 |
8.5 |
7.9 |
6.8 |
6.7 |
Station 1, April 1985-September 1987
|
|
|
|
|
|
|
|
|
|
|
|
|
| Depth[m] |
Jan |
Feb |
Mar |
Apr |
May |
Jun |
Jul |
Aug |
Sep |
Oct |
Nov |
Dec |
|
|
|
|
|
|
|
|
|
|
|
|
|
|
8.0 |
8.2 |
8.2 |
8.0 |
8.2 |
8.4 |
8.9 |
8.5 |
8.4 |
8.2 |
8.0 |
8.0 |
Station 2, April 1985-September 1987
|
|
|
|
|
|
|
|
|
|
|
|
|
| Depth[m] |
Jan |
Feb |
Mar |
Apr |
May |
Jun |
Jul |
Aug |
Sep |
Oct |
Nov |
Dec |
|
|
|
|
|
|
|
|
|
|
|
|
|
|
7.7 |
8.6 |
8.5 |
7.7 |
7.9 |
8.0 |
8.0 |
8.3 |
8.2 |
8.0 |
8.2 |
8.0 |
E3 SS [mg l-1] September 1982-March 1985 Station 1
|
|
|
|
|
|
|
|
|
|
|
|
|
| Depth[m] |
Jan |
Feb |
Mar |
Apr |
May |
Jun |
Jul |
Aug |
Sep |
Oct |
Nov |
Dec |
|
|
|
|
|
|
|
|
|
|
|
|
|
|
34.7 |
92.2 |
112.3 |
41.7 |
49.8 |
12.3 |
17.0 |
13.0 |
20.2 |
48.0 |
56.2 |
71.3 |
Station 2
|
|
|
|
|
|
|
|
|
|
|
|
|
| Depth[m] |
Jan |
Feb |
Mar |
Apr |
May |
Jun |
Jul |
Aug |
Sep |
Oct |
Nov |
Dec |
|
|
|
|
|
|
|
|
|
|
|
|
|
|
143.6 |
283.2 |
325.3 |
330.3 |
324.3 |
267.3 |
138.3 |
39.6 |
27.8 |
67.7 |
44.0 |
208.7 |
April 1985-September 1987 Station 1
|
|
|
|
|
|
|
|
|
|
|
|
|
| Depth[m] |
Jan |
Feb |
Mar |
Apr |
May |
Jun |
Jul |
Aug |
Sep |
Oct |
Nov |
Dec |
|
|
|
|
|
|
|
|
|
|
|
|
|
|
26.0 |
30.0 |
56.0 |
31.4 |
51.9 |
25.5 |
20.7 |
17.0 |
30.5 |
24.3 |
51.2 |
114.2 |
Station 2
|
|
|
|
|
|
|
|
|
|
|
|
|
| Depth[m] |
Jan |
Feb |
Mar |
Apr |
May |
Jun |
Jul |
Aug |
Sep |
Oct |
Nov |
Dec |
|
|
|
|
|
|
|
|
|
|
|
|
|
|
10.0 |
85.5 |
23.0 |
117.9 |
66.1 |
37.3 |
18.6 |
14.8 |
18.1 |
31.3 |
19.3 |
38.8 |
E4 DO [mg l-1] Station 1, September 1982-March 1985
|
|
|
|
|
|
|
|
|
|
|
|
|
| Depth[m] |
Jan |
Feb |
Mar |
Apr |
May |
Jun |
Jul |
Aug |
Sep |
Oct |
Nov |
Dec |
|
|
|
|
|
|
|
|
|
|
|
|
|
|
11.7 |
11.6 |
10.2 |
10.3 |
9.6 |
8.0 |
8.7 |
7.2 |
5.2 |
9.2 |
9.9 |
11.3 |
Station 2, September 1982-March 1985
|
|
|
|
|
|
|
|
|
|
|
|
|
| Depth[m] |
Jan |
Feb |
Mar |
Apr |
May |
Jun |
Jul |
Aug |
Sep |
Oct |
Nov |
Dec |
|
|
|
|
|
|
|
|
|
|
|
|
|
|
7.7 |
5.7 |
8.3 |
8.7 |
8.2 |
7.6 |
6.7 |
7.8 |
9.3 |
9.3 |
8.6 |
8.7 |
Station 1, April 1985-September 1987
|
|
|
|
|
|
|
|
|
|
|
|
|
| Depth[m] |
Jan |
Feb |
Mar |
Apr |
May |
Jun |
Jul |
Aug |
Sep |
Oct |
Nov |
Dec |
|
|
|
|
|
|
|
|
|
|
|
|
|
|
11.2 |
10.2 |
11.4 |
9.5 |
10.1 |
11.5 |
12.0 |
8.7 |
8.8 |
7.7 |
7.9 |
10.6 |
Station 2, April 1985-September 1987
|
|
|
|
|
|
|
|
|
|
|
|
|
| Depth[m] |
Jan |
Feb |
Mar |
Apr |
May |
Jun |
Jul |
Aug |
Sep |
Oct |
Nov |
Dec |
|
|
|
|
|
|
|
|
|
|
|
|
|
|
11.3 |
11.5 |
11.9 |
9.1 |
9.0 |
8.5 |
8.3 |
9.3 |
7.5 |
8.4 |
8.8 |
10.5 |
E6 CHLOROPHYLL CONCENTRATION [micro g l-1] Station 1, September
1982-March 1985
|
|
|
|
|
|
|
|
|
|
|
|
|
| Depth[m] |
Jan |
Feb |
Mar |
Apr |
May |
Jun |
Jul |
Aug |
Sep |
Oct |
Nov |
Dec |
|
|
|
|
|
|
|
|
|
|
|
|
|
|
25.3 |
45.4 |
46.2 |
41.2 |
36.7 |
44.0 |
69.0 |
82.4 |
95.8 |
110.5 |
72.0 |
41.6 |
Station 2, September 1982-March 1985
|
|
|
|
|
|
|
|
|
|
|
|
|
| Depth[m] |
Jan |
Feb |
Mar |
Apr |
May |
Jun |
Jul |
Aug |
Sep |
Oct |
Nov |
Dec |
|
|
|
|
|
|
|
|
|
|
|
|
|
|
1.8 |
4.2 |
1.8 |
2.8 |
1.7 |
20.3 |
16.3 |
13.4 |
39.0 |
24.8 |
5.6 |
1.6 |
Station 1, April 1985-September 1987
|
|
|
|
|
|
|
|
|
|
|
|
|
| Depth[m] |
Jan |
Feb |
Mar |
Apr |
May |
Jun |
Jul |
Aug |
Sep |
Oct |
Nov |
Dec |
|
|
|
|
|
|
|
|
|
|
|
|
|
|
47.5 |
0.2 |
0.8 |
19.2 |
32.2 |
25.5 |
91.0 |
100.4 |
120.0 |
142.0 |
82.3 |
48.7 |
Station 2, April 1985-September 1987
|
|
|
|
|
|
|
|
|
|
|
|
|
| Depth[m] |
Jan |
Feb |
Mar |
Apr |
May |
Jun |
Jul |
Aug |
Sep |
Oct |
Nov |
Dec |
|
|
|
|
|
|
|
|
|
|
|
|
|
|
27.7 |
26.3 |
16.8 |
14.3 |
15.1 |
11.0 |
35.7 |
47.6 |
53.5 |
56.5 |
35.2 |
18.3 |
E7 NITROGEN CONCENTRATION Total-N [mg l-1] Station 1, September
1982-March 1985
|
|
|
|
|
|
|
|
|
|
|
|
|
| Depth[m] |
Jan |
Feb |
Mar |
Apr |
May |
Jun |
Jul |
Aug |
Sep |
Oct |
Nov |
Dec |
|
|
|
|
|
|
|
|
|
|
|
|
|
|
1.3 |
1.4 |
1.4 |
1.3 |
1.7 |
1.8 |
1.6 |
1.8 |
1.6 |
1.6 |
1.4 |
1.2 |
Station 2, September 1982-March 1985
|
|
|
|
|
|
|
|
|
|
|
|
|
| Depth[m] |
Jan |
Feb |
Mar |
Apr |
May |
Jun |
Jul |
Aug |
Sep |
Oct |
Nov |
Dec |
|
|
|
|
|
|
|
|
|
|
|
|
|
|
0.8 |
1.2 |
1.3 |
1.5 |
1.2 |
1.2 |
1.2 |
0.9 |
0.8 |
0.8 |
0.6 |
1.1 |
Station 1, April 1985-September 1987
|
|
|
|
|
|
|
|
|
|
|
|
|
| Depth |
Jan |
Feb |
Mar |
Apr |
May |
Jun |
Jul |
Aug |
Sep |
Oct |
Nov |
Dec |
|
|
|
|
|
|
|
|
|
|
|
|
|
|
1.0 |
0.6 |
0.8 |
0.9 |
1.0 |
1.6 |
2.4 |
2.6 |
2.9 |
2.4 |
2.0 |
1.4 |
Station 2, April 1985-September 1987
|
|
|
|
|
|
|
|
|
|
|
|
|
| Depth[m] |
Jan |
Feb |
Mar |
Apr |
May |
Jun |
Jul |
Aug |
Sep |
Oct |
Nov |
Dec |
|
|
|
|
|
|
|
|
|
|
|
|
|
|
0.7 |
0.4 |
0.5 |
0.7 |
0.7 |
0.7 |
1.0 |
1.3 |
1.3 |
1.0 |
1.0 |
0.7 |
E8 PHOSPHORUS CONCENTRATION Total-P [mg l-1] Station 1, September
1982-March 1985
|
|
|
|
|
|
|
|
|
|
|
|
|
| Depth[m] |
Jan |
Feb |
Mar |
Apr |
May |
Jun |
Jul |
Aug |
Sep |
Oct |
Nov |
Dec |
|
|
|
|
|
|
|
|
|
|
|
|
|
|
.125 |
.105 |
.157 |
.095 |
.146 |
.109 |
.104 |
.125 |
.151 |
.165 |
.133 |
.128 |
Station 2, September 1982-March 1985
|
|
|
|
|
|
|
|
|
|
|
|
|
| Depth[m] |
Jan |
Feb |
Mar |
Apr |
May |
Jun |
Jul |
Aug |
Sep |
Oct |
Nov |
Dec |
|
|
|
|
|
|
|
|
|
|
|
|
|
|
.246 |
.219 |
.354 |
.342 |
.593 |
.389 |
.202 |
.106 |
.097 |
.149 |
.118 |
.314 |
Station 1, April 1985-September 1987
|
|
|
|
|
|
|
|
|
|
|
|
|
| Depth[m] |
Jan |
Feb |
Mar |
Apr |
May |
Jun |
Jul |
Aug |
Sep |
Oct |
Nov |
Dec |
|
|
|
|
|
|
|
|
|
|
|
|
|
|
.074 |
.191 |
.108 |
.087 |
.088 |
.111 |
.146 |
.223 |
.266 |
.183 |
.148 |
.166 |
Station 2, April 1985-September 1987
|
|
|
|
|
|
|
|
|
|
|
|
|
| Depth[m] |
Jan |
Feb |
Mar |
Apr |
May |
Jun |
Jul |
Aug |
Sep |
Oct |
Nov |
Dec |
|
|
|
|
|
|
|
|
|
|
|
|
|
|
.044 |
.035 |
.035 |
.193 |
.128 |
.105 |
.096 |
.140 |
.335 |
.138 |
.072 |
.069 |
G. SOCIO-ECONOMIC CONDITIONS (3)
G1 LAND USE IN THE CATCHMENT AREA 1987
|
|
|
[%] |
|
|
| Natural landscape |
|
| Others |
8 |
| Agricultural land |
90 |
| Residential area |
2 |
| Total |
100 |
Main kinds of crops: Cotton, soybean, rice, wheat, milo. Levels of fertilizer
application on crop fields: Moderate.
G3 POPULATION IN THE CATCHMENT AREA 1987
|
|
|
|
|
|
Population |
Major cities |
|
Population |
density [km-2] |
(population) |
|
|
|
|
| Rural |
19,000 |
21.0 |
Lake Village |
H. LAKE UTILIZATION (2)
H1 LAKE UTILIZATION Sightseeing and tourism, recreation (swimming,
sport-fishing) and fisheries.
H2 THE LAKE AS WATER RESOURCE 1987
|
|
|
Use rate [m3 sec-1] |
|
|
| Irrigation |
1.4-2.5 |
M. LEGISLATIVE AND INSTITUTIONAL MEASURES FOR UPGRADING LAKE ENVIRONMENTS
M1 NATIONAL AND LOCAL LAWS CONCERNED (2) Names of the laws (the
year of legislation)
-
Flood Control Act of 1968 Responsible authorities
-
U.S. Army Corps of Engineers (Dept. of Army) Main facilities of control
-
6500 CFS Pumping Plant
-
Control Dam
-
Regulating Dam
M2 INSTITUTIONAL MEASURES (the year of establishment) (2)
-
Lake Chicot Rural Development Authority, Lake Village, Arkansas (1973)
M3 RESEARCH INSTITUTES ENGAGED IN THE LAKE ENVIRONMENT STUDIES (1)
Primary research conducted by
-
Agricultural Research Laboratory at Durant, Oklahoma
-
Army Engineer District, Vicksburg, Mississippi Supplementary research by
-
Agricultural Research Laboratory at Oxford, Mississippi
-
Agricultural Research Laboratory at Beltsville, Maryland
-
Ouachita Baptist University at Arkadelphia, Arkansas
-
University of Minnesota at Minneapolis, Minnesota
-
University of Mississippi at Oxford, Mississippi
-
University of Oklahoma at Norman, Oklahoma
-
Northeast Louisiana University at Monroe, Louisiana
-
University of Arkansas at Monticello, Arkansas
N. SOURCES OF DATA
-
Questionnaire filled by Hydrologic Technician B. Morrison, Water Quality
and Watershed Research Laboratory, Durant, Oklahoma, with the support of
J. E. Wesson, Secretary/Treasurer, Lake Village Chamber of Commerce, based
on the following sources.
-
The USDA Agricultural Research Laboratory.
-
Goodson, L., U.S. Army Corps of Engineers Vicksburg District.
-
Keener, B., Soil Conservation Service.

