
CAYUGA LAKE
A view over looking the western shore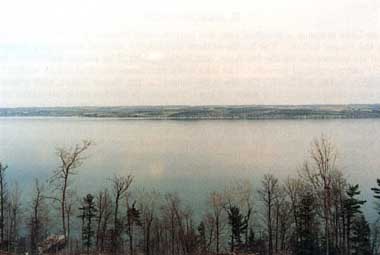
Photo: C. Rossano
A. LOCATION
New York, USA. 42:2 N, 76:1 W; 116.4 m above sea level.B. DESCRIPTION
Cayuga Lake is one of a group of long and narrow lakes located in western New York State known as the Finger Lakes. The basins of these north-south oriented lakes were formed by the advance of ice masses during the Ice Ages, and further sculpted by glacial meltwater during the interglacial and postglacial periods. The lake has a maximum depth of 132 m, with the deepest point extending below sea level. Cayuga is the longest of the Finger Lakes, with a length of 61.4 km, yet the average width is a mere 2.8 km. The lake is the lowest in elevation among the Finger Lakes, and this has resulted in the formation of extensive marshes around its northern end.Although the Finger Lakes region is now well-known for its many vineyards and orchards, it had been densely forested up until the early 1800's when large areas were cleared for agriculture by white settlers. The forests are now in the process of expanding as marginal farmland is abandoned and gradually invaded by trees. In the drainage basin, approximately half the land area is in active agriculture, one-third is forested, and 2% is residential.
The water level of the lake is regulated by Mud Lock at the north end. The lake has been connected to Lake Ontario by the Erie Barge Canal system since 1828. The lake is also connected by the Seneca River to Seneca Lake. Cayuga Lake is drawn down in mid-December to minimize ice damage and for maximizing storage during the period of heavy spring runoff. The lake is a major recreational resource for the region, and its waters are also used for both drinking and waste disposal. Industrial development is low and does not constitute a substantial pollution hazard. The fish population is managed to maximize salmonid production. Significant sport-fishing also exist for smelt, smallmouth bass, and other species (2).
C. PHYSICAL DIMENSIONS (2, 3)
| Surface area [km2] | 172 |
| Volume [km3] | 9.4 |
| Maximum depth [m] | 132.6 |
| Mean depth [m] | 54.5 |
| Water level | Regulated |
| Length of shoreline [km] | 153.4 |
| Residence time [yr] | 18.2* |
| Catchment area [km2] | 2,033 |
| * From Singley (1973). |
D. PHYSIOGRAPHIC FEATURES
D1 GEOGRAPHICAL (2) Bathymetric map: Fig. NAM-17-01. Names of main islands: None. Number of outflowing rivers and channels (name): 1.D2 CLIMATIC Climatic data at Ithaca, 1942-1962 (2)
Mean temp [deg C]
| Jan | Feb | Mar | Apr | May | Jun | Jul | Aug | Sep | Oct | Nov | Dec | Ann. | |
|---|---|---|---|---|---|---|---|---|---|---|---|---|---|
| -4.4 | -3.9 | 0.6 | 7.2 | 12.8 | 18.3 | 20.5 | 20.0 | 16.1 | 10.6 | 3.9 | -2.8 | 8.3 |
| Jan | Feb | Mar | Apr | May | Jun | Jul | Aug | Sep | Oct | Nov | Dec | Ann. |
|---|---|---|---|---|---|---|---|---|---|---|---|---|
| 52 | 56 | 68 | 77 | 94 | 89 | 95 | 98 | 79 | 84 | 74 | 58 | 924 |
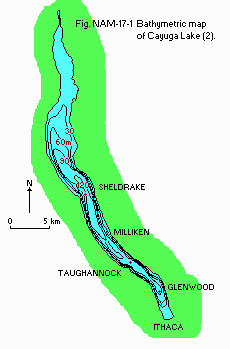
Bathymetric map (2).
Water temperature: Fig. NAM-17-02.
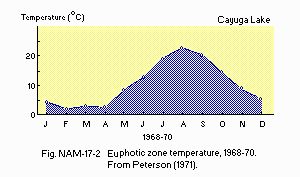
Euphotic zone temperature, 1968-1970 (5).
Freezing period: Maximum coverage in February (2). Mixing type: Monomictic (2).
E. LAKE WATER QUALITY
E1 TRANSPARENCY (2) Light extinction coefficient K [m-1] 1968-1970| Depth | Jan | Feb | Mar | Apr | May | Jun | Jul | Aug | Sep | Oct | Nov | Dec |
|---|---|---|---|---|---|---|---|---|---|---|---|---|
| .250 | .292 | .250 | .463 | .301 | .370 | .854 | .598 | .403 | .321 | .286 | - |
| Min | Max | Ann. | |
|---|---|---|---|
| Epilimnion | 8.0 | 8.8 | 8.4 |
| Hypolimnion | 7.5 | 8.2 | 8.1 |
| Min | Max | Ann. | |
|---|---|---|---|
| Epilimnion | 7.5 | 8.7 | 8.2 |
| Hypolimnion | 7.7 | 8.2 | 8.0 |
| Late May-early Jun | Sep | Nov | |
|---|---|---|---|
| Hypolimnion | 12 | 6.2*1 - | |
| Near the bottom | - | - | 6.8-9.6*2 |
| - | - | 7.9*1 |
| Depth[m] | Jun | Aug | Sep | Oct | Nov | Jan | Feb |
|---|---|---|---|---|---|---|---|
| 00-09 | 3.7 | 3.8 | 1.9 | 1.6 | 2.5 | 1.3 | 1.4 |
| 10-19 | 2.1 | 0.9 | 1.3 | 2.5 | 2.0 | - | - |
| 20-29 | 1.2 | 0.5 | 0.7 | 1.1 | 1.4 | - | - |
| 30-39 | 0.7 | 0.4 | 0.2 | 0.5 | 0.6 | 1.1 | 1.5 |
| 40-49 | 0.2 | 0.3 | 0.2 | 0.8 | 0.2 | 0.6 | 1.6 |
| 50-59 | - | - | - | 0.2 | 1.4 | - | 1.4 |
| 60-69 | - | 0.4 | 0.3 | 0.3 | 0.9 | 1.4 | 1.6 |
| 70-79 | - | 0.2 | 0.2 | - | 1.0 | 0.4 | 1.3 |
| 80-89 | - | - | 0.2 | 0.2 | 0.2 | - | - |
| 90-99 | - | - | 0.2 | - | 0.2 | 0.9 | 1.6 |
| 100- | - | - | - | - | 0.2 | 0.8 | 1.4 |
| Depth[m] | May | Jul | Nov |
|---|---|---|---|
| S*1 | 0 | 43 | - |
| *2 | 0 | 36 | 0 |
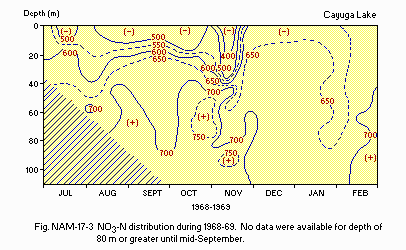
NO3-N distribution during 1968-69.
E8 PHOSPHORUS CONCENTRATION (2) PO4-P [micro g l-1] 1968-1969
| Depth[m] | Jul | Aug | Sep | Oct | Nov | Jan | Feb |
|---|---|---|---|---|---|---|---|
| 00 -09 | 3.7 | 1.3 | 1.0 | 1.0 | 1.8 | 12.2 | 11.4 |
| 10 -19 | 3.3 | 3.2 | 2.6 | 1.2 | 2.6 | - | - |
| 20 -29 | 4.5 | 4.0 | 1.4 | 1.3 | 5.7 | - | - |
| 30 -39 | 5.4 | 6.0 | 5.7 | 3.1 | 7.3 | 16.0 | 12.7 |
| 40 -49 | 6.2 | 6.2 | 6.0 | 6.6 | 4.4 | 12.5 | 10.3 |
| 50 -59 | - | - | - | 9.6 | 8.1 | - | 12.1 |
| 60 -69 | - | 11.4 | 10.8 | 13.3 | 10.0 | 13.1 | 13.0 |
| 70 -79 | - | 12.9 | 10.5 | - | 17.7 | 12.2 | 12.6 |
| 80 -89 | - | - | 10.2 | 14.0 | 20.1 | - | - |
| 90 -99 | - | - | 9.7 | - | 21.9 | 12.7 | 11.6 |
| 100- | - | - | - | - | - | 12.9 | 12.7 |
| 1969 | 1970 | |||||
|---|---|---|---|---|---|---|
| Winter | Jul | Nov | Apr | May | Jun | Jul |
| 1.74 | 1.64 | 1.86 | 2.21 | 1.67 | 1.50 | 1.46 |
| 1927*2 | 1950*3 | 1951*3 | 1952*3 | ||
|---|---|---|---|---|---|
| Epilimnion | |||||
| Minimum | 7.9 | 8.1 | 8.1 | 8.1 | |
| Maximum | 9.0 | 8.3 | 8.5 | 8.4 | |
| Annual | 8.5 | 8.2 | 8.3 | 8.2 | |
| Hypolimnion | |||||
| Minimum | 7.8 | 7.5 | 7.6 | 7.8 | |
| Maximum | 8.8 | 8.1 | 8.1 | 8.1 | |
| Anual | 8.2 | 7.9 | 7.9 | 7.9 |
F. BIOLOGICAL FEATURES
F1 FLORA (2) Submerged macrophytes Myriophyllum exalbescens, Heteranthera dubia, Potamogeton crispus, P. pectinatus, Ceratophyllum demersum, Vallisneria americana. Phytoplankton Coelastrum microporum, Dictyosphaerium pulchellum, Scenedesmus bijuga, S. quadricauda, Asterionella formosa, Fragilaria crotonensis, Stephanodiscus astraea, Synedra spp., Peridinium cinctum, Aphanizomenon flos-aquae.F2 FAUNA (2) Zooplankton Diaptomus minutas, Cyclops bicuspidatus, Bosmina longirostris, Ceriodaphnia laticaudata, Codonella cratera, Ascomorpha sultans, Chonochilus unicornis, Keratella cochlearis, Polyarthra major. Benthos Mysidea (Mysis relicta), Amphipoda (Gammarus linnaeus), Diptera (Ablabesmyia spp., Paralauterborniella nigrohalterale, Paratendipes albimanus, Cryptochironomus nais, Stitochironomus devinctus, Tribelos jucundus, Microspectra deflecta). Fish Salvelinus namaycush, Micropterus dolomieui, Osmerus mordax, Alosa pseudoharengus, Salmo gairdneri, S. salar, Perca flavescens, Petromyzon marinus, Coregonus artedii. Supplementary notes on the biota The composition of the phytoplankton is especially illustrative of the intermediate trophic status of Cayuga.
F3 PRIMARY PRODUCTION RATE (2) Primary production rate [mg C m-2 day-1] 1969-1970: 366-418.
F4 BIOMASS (2) Total number of phytoplankton cells [cells l-1] 1972
| June: ca. 200,000. |
| July: 7800,000. |
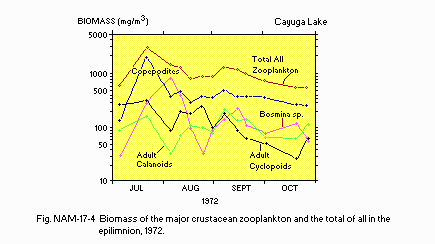
Biomass of the major crustacean zooplankton and the total of all in the epilimnion, 1972.
F5 FISHERY PRODUCTS Annual fish catch [kg]: 5.675*. * Lake trout.
F7 NOTES ON THE REMARKABLE CHANGES OF BIOTA IN THE LAKE IN RECENT
YEARS (2) Since the early 1940's marked decreases have occurred in
the abundance and/or the areal distribution of submerged macrophytes. Anacharis
canadensis, Potamogeton richarsonii, Najas flexilis, Nitella sp., Vallisneria
americana, Potamogeton pectinatus, Zannichellia palustris, and the alga
Chara sp. Increases occurred in Myriophyllum exalcescens, Heteranthera
dubia, Potamogeton crispus, and Ceratophyllum demersum and were particularly
large for the first two.
G. SOCIO-ECONOMIC CONDITIONS (2)
G1 LAND USE IN THE CATCHMENT AREA| Area [km2] | [%] | |
|---|---|---|
| Natural landscape | ||
| Forest | 582.44 | 37.1 |
| Agricultural land | ||
| Active agriculture | 903.96 | 58 |
| Residential area | 36.85 | 2.3 |
| Others | ||
| Commercial | 3.55 | 0.2 |
| Industrial | 1.56 | 0.1 |
| Outdoor recreation | 13.14 | 0.8 |
| Extractive | 3.85 | 0.2 |
| Public | 15.52 | 1.0 |
| Transportation | 4.91 | 0.3 |
| Total | 1,565.78 | 100 |
G3 POPULATION IN THE CATCHMENT AREA 1970
| Population | Major cities | ||
|---|---|---|---|
| Population | density [km-2] | (population) | |
| Total | 90,221 | 43.9 | Ithaca (26,226) |
H. LAKE UTILIZATION
H1 LAKE UTILIZATION Source of water, fisheries, tourism and recreation (swimming, sport-fishing, boating).I. DETERIORATION OF LAKE ENVIRONMENTS AND HAZARDS
I3 EUTROPHICATION (2) Nitrogen and phosphorus loadings to the lake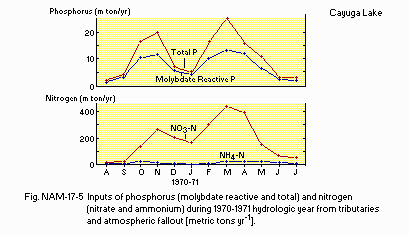
Inputs of phosphorus (molybdate reactive and total) and nitrogen (nitrate and ammonium) during the 1970-1971 hydrologic year from tributaries and atmospheric fallout [metric tons yr-1].
J. WASTEWATER TREATMENTS (2)
J2 APPROXIMATE PERCENTAGE DISTRIBUTION OF POLLUTANT LOADS Nitrogen and phosphorus inputs and loadings (excluding the Seneca River) for 1970-71 with waste discharges calculated and land runoff determined by difference [t yr-1]| Soluble-N | Total- P | |
|---|---|---|
| Waste discharge | 200.3 | 88.6 |
| Land runoff | 1,694.1 | 47.4 |
| Precipitation | 565.6 | 3.4 |
| Groundwater | - | - |
| Other | - | - |
| Volumetric loading [micro g 1-1 yr-1] | 262 | 14.9 |
| Areal loading [g m-2 yr-1] | 14.2 | 0.54 |
| Land use | Runoff factor | Runoff of total-P |
|---|---|---|
| [g km-2 yr-1] | [1,000 kg yr-1] | |
| Active agriculture | 46 | 41.6 |
| Forest | 11.7 | 6.8 |
| Inactive agriculture and other | 23.3 | 9.0 |
Percentage of rural population with adequate sanitary facilities (on-site treatment systems): ca. 52%.
N. SOURCES OF DATA
- Greeson, P. E. & Williams, G. E. (1970) U.S., Geol. Surv. N. Y. State Dep. Environ. Conserv. Bull. 68B, 1-122.
- Oglesby, R. T. (1978) The limnology of Cayuga Lake, "Lakes of New York State 1, Ecology of the Finger Lakes" (ed. Bloomfield, J. A.), pp. 1-120. Academic Press, New York, San Francisco, London.
- Singley, G. W. (1973) Report prepared for New York State Electric and Gas Corporation by NUS Corp., Rockville, Maryland.
- Court, A (1974) The climate of the conterminous United States. "World Surveys of Climatology, Volume 11, Climates of North America" (ed. Bryson, R. A. & Hare, F. K.), p. 312. Elsevier Scientific Publishing Company, Amsterdam-London-New York.
- Peterson, B. J. (1971) Ph. D. Thesis, Cornell University, Ithaca, New York.
