
LAC SAINT-JEAN (LAKE SAINT-JOHN)
A view on the lakeshore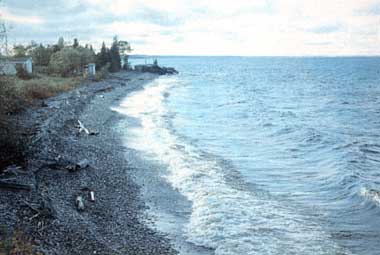
Photo: M. Quelett
A. LOCATION
Quebec, Canada. 48:5 -48:5 N, 71:5 -72:0 W; 99.6 m above sea level.B. DESCRIPTION
The Saguenay-Lake-Saint-Jean hydrographic system located within the south- central part of the Province of Quebec (Canada), has been since 1926 an important source of hydro-electric power. From the late twenties to the end of the fifties six hydro-electric power dams were built on the Peribonca and the Saguenay Rivers for a total installed capacity of 2,700 MW. These are owned and operated by the Aluminium Company of Canada (ALCAN) which uses this energy for the electrolysis of alumina in its three nearby aluminium smelters having a total annual metal production of 606,000 t. The whole hydrographic system covers a total area of 85,000 km2 within the northern latitudes of 47¡¦0' to 52¡¦1' and the western longitudes of 69¡¦1' to 74¡¦0'. The catchment, of typical Canadian Shield landforms, is made up of three distinct physiographic units. The forested head water unit, varying in altitude from a maximum of 1,500 m to a minimum of 180 m, drains 80% of the whole system. In its northern part, it is drained by several large rivers (Peribonca, Mistassini, Mistassibi, Chamouchouane, Ouasienmsca, Samaqua) all running in a southern direction through nearly parallel glacier-carved valleys. The southern smaller part of the Highlands is drained by the Metabetchouane, the Ouiatchouane and the Ouiatchouaniche. All these converge toward Lake Saint- Jean which acts as the main central reservoir for power dams located on the head of the Saguenay River.Although the Saguenay Fiord physiographic unit is very rugged, it is of majestic beauty and this has recently lead our governments to create national parks within that part of the country. Moreover, it is the most southerly fiord of the North Hemisphere and has been sustaining since postglacial times a typical arctic inland-entrapped fauna within its cold water which reaches a depth over 350 m. The white whale (Delphinapterus leucan) has been, till lately, the most important species representative of this northern fauna. Presently, because of industrial pollution originating since half a century largely from the aluminium smelters, their numbers are rapidly diminishing. From its asymmetric population age structure, it is only a matter of time before being completely wiped out from that peculiar range habitat.
The climate of the area is humid continental, with cold summer but without dry season. At near the lake level (Roberval), July mean temperature of the area is 17¡¦ while January average is -17¡¦. The growing season lasts from May 18th to October 4th, for a period of about 100 days without frost.
Because of the large volume of low mineralized waters (1,457 m3 sec-1) originating from unpopulated forested areas and the short retention time (93 days) within the lacustrine basin, the water quality of the pelagic zone is almost unaffected by anthropogenic activities (Q).
C. PHYSICAL DIMENSIONS
| Surface area [km2] | 1,053 |
| Volume [km3] | 11.9 |
| Maximum depth [m] | 63.1 |
| Mean depth [m] | 11.4 |
| Water level | Regulated |
| Normal range of annual water | |
| level fluctuation [m] | 5.5 |
| Residence time [yr] | 0.3 |
| Catchment area [km2] | 71,947 |
D. PHYSIOGRAPHIC FEATURES
D1 GEOGRAPHICAL (Q) Bathymetric map: Fig. NAM-10-0l. Number of outflowing rivers and channels (name) 2 (Yarge and a small discharge).D2 CLIMATIC (Q) Climatic data at Roberval* Mean temp. [deg C]
| Jan | Feb | Mar | Apr | May | Jul | Jul | Aug | Sep | Oct | Nov | Dec | Ann. |
|---|---|---|---|---|---|---|---|---|---|---|---|---|
| -16.1 | -15.8 | -2.0 | 1.9 | 10.1 | 15.1 | 20.1 | 16.6 | 11.8 | 4.2 | -1.2 | -12.8 | 2.66 |
| Jan | Feb | Mar | Apr | May | Jul | Jul | Aug | Sep | Oct | Nov | Dec | Ann. |
|---|---|---|---|---|---|---|---|---|---|---|---|---|
| 61 | 52 | 54 | 54 | 66 | 91 | 118 | 101 | 103 | 78 | 78 | 73 | 929 |
Bathymetric map (Q).
Water temperature [deg C] Lake centre, 1979
| Depth[m] Jan | Feb | Mar | Apr | May | Jun | Jul | Aug | Sep | Oct | Nov | Dec | |
|---|---|---|---|---|---|---|---|---|---|---|---|---|
| 0 | - | - | 0.9 | 0.3 | - | 11.1 | 20.4 | 18.4 | 15.6 | 9.8 | 7.8 | 0.3 |
| 5 | - | - | 0.2 | 0.5 | - | 9.4 | 16.5 | 17.7 | 15.3 | 9.6 | 7.8 | 0.3 |
| 10 | - | - | 0.5 | 0.3 | - | 9.2 | 16.5 | 17.5 | 15.1 | 9.6 | 7.8 | 0.5 |
| 20 | - | - | 0.5 | 0.5 | - | 8.5 | 12.4 | 17.0 | 15.3 | 9.6 | 7.75 | 2.0 |
| 30 | - | - | 0.5 | 1.5 | - | 6.7 | 11.0 | 12.5 | 15.1 | 9.6 | 7.75 | 3.0 |
| 40 | - | - | 1.5 | 1.5 | - | 6.3 | 9.7 | 11.5 | 14.8 | 9.6 | 7.1 | 4.0 |
| 50 | - | - | 1.5 | 2.0 | - | 5.6 | 9.0 | 10.5 | 14.8 | 9.6 | 7.0 | 4.0 |
| 60 | - | - | 1.5 | 2.0 | - | 5.8 | 8.5 | 10.0 | 12.5 | 9.5 | 6.5 | 4 |
| Depth[m] | Jan | Feb | Mar | Apr | May | Jun | Jul | Aug | Sep | Oct | Nov | Dec |
|---|---|---|---|---|---|---|---|---|---|---|---|---|
| 0 | - | - | - | - | - | 1 | 1 | 1 | 1 | 1 | - | - |
| 10 | - | - | - | - | - | 1 | 1 | 1 | 1 | 1 | - | - |
| 20 | - | - | - | - | - | 1 | 1 | 1 | 1 | 1 | - | - |
| 30 | - | - | - | - | - | 1 | 1 | 1 | 1 | 1 | - | - |
| 40 | - | - | - | - | - | 1 | 1 | 1 | 1 | 1 | - | - |
| 50 | - | - | - | - | - | 1 | 2 | 2 | 2 | 1 | - | - |
| 60 | - | - | - | - | - | 1 | 2 | 2 | 3 | 1 | - | - |
| Depth[m] | Jan | Feb | Mar | Apr | May | Jun | Jul | Aug | Sep | Oct | Nov | Dec |
|---|---|---|---|---|---|---|---|---|---|---|---|---|
| 0 | - | - | - | - | 12.5 | 12.5 | 9 | 8 | 8.7 | 8.8 | 9 | - |
| 10 | - | - | - | - | 12.5 | 12.5 | 9 | 8 | 8.5 | 8.8 | 9 | - |
| 20 | - | - | - | - | 12.5 | 12.5 | 9 | 7.7 | 8.5 | 8.7 | 9 | - |
| 30 | - | - | - | - | 12.5 | 13 | 9 | 7.7 | 8.4 | 8.7 | 9 | - |
| 40 | - | - | - | - | 12.5 | 13 | 9 | 7.6 | 8.0 | 8.6 | 9 | - |
| 50 | - | - | - | - | 12.5 | 13 | 9 | 7.5 | 7.5 | 8.6 | 9 | - |
| 60 | - | - | - | - | 12.5 | 13 | 9 | 7.5 | 7.5 | 8.5 | 9 | - |
| Depth[m] | Jan | Feb | Mar | Apr | May | Jun | Jul | Aug | Sep | Oct | Nov | Dec |
|---|---|---|---|---|---|---|---|---|---|---|---|---|
| 0 | - | - | - | - | - | - | 11 | 13.5 | 12.5 | 12 | - | - |
| 10 | - | - | - | - | - | - | 11 | 13.5 | 12.5 | 12 | - | - |
| 20 | - | - | - | - | - | - | 11 | 13.5 | 12.5 | 12 | - | - |
| 30 | - | - | - | - | - | - | 11 | 13.5 | 12.5 | 12 | - | - |
| 40 | - | - | - | - | - | - | 11 | 13.0 | 12.5 | 13 | - | |
| 50 | - | - | - | - | - | - | 11 | 12.5 | 13 | 12 | - | - |
| 60 | - | - | - | - | - | - | 11 | 12.5 | 13 | 13 | - | - |
| Depth[m] | Jan | Feb | May | Apr | May | Jun | Jul | Aug | Sep | Oct | Nov | Dec |
|---|---|---|---|---|---|---|---|---|---|---|---|---|
| 0 | - | - | - | - | - | - | 0.5 | 1.0 | 0.5 | 1.0 | - | - |
| 10 | - | - | - | - | - | - | 0.5 | 1.0 | 0.5 | 1.0 | - | - |
| 20 | - | - | - | - | - | - | 0.5 | 1.0 | 0.5 | 1.0 | - | - |
| 30 | - | - | - | - | - | - | 0.5 | 1.0 | 0.5 | 1.0 | - | - |
| 40 | - | - | - | - | - | - | 0.5 | 1.0 | 0.5 | 1.0 | - | - |
| 50 | - | - | - | - | - | - | 0.5 | 0.8 | 0.5 | 1.0 | - | - |
| 60 | - | - | - | - | - | - | 0.5 | 0.8 | 0.5 | 1.5 | - | - |
| Depth[m] | Jan | Feb | Mar | Apr | May | Jun | Jul | Aug | Sep | Oct | Nov | Dec |
|---|---|---|---|---|---|---|---|---|---|---|---|---|
| 0 | - | - | - | - | - | - | 11.0 | 0.65 | 0.5 | 0.3 | - | - |
| 10 | - | - | - | - | - | - | 0.87 | 0.65 | 0.45 | 0.3 | - | - |
| 20 | - | - | - | - | - | - | 0.4 | 0.6 | 0.4 | 0.3 | - | - |
| 30 | - | - | - | - | - | - | 0.25 | 0.3 | 0.35 | 0.3 | - | - |
| 40 | - | - | - | - | - | - | 0.2 | 0.25 | 0.3 | 0.3 | - | - |
| 50 | - | - | - | - | - | - | 0.1 | 0.2 | 0.2 | 0.3 | - | - |
| 60 | - | - | - | - | - | - | 0.08 | 0.1 | 0.1 | 0.3 | - | - |
E7 NITROGEN CONCENTRATION (Q) Total Kjeldahl-N [mg l-1] Lake centre, 1979
| Depth[m] | Jan | Feb | Mar | Apr | May | Jun | Jul | Aug | Sep | Oct | Nov | Dec |
|---|---|---|---|---|---|---|---|---|---|---|---|---|
| 0 | - | - | - | - | - | - | - | 0.08 | 0.1 | 0.15 - | - | |
| 10 | - | - | - | - | - | - | - | 0.08 | 0.1 | 0.15 - | - | |
| 20 | - | - | - | - | - | - | - | 0.08 | 0.1 | 0.15 - | - | |
| 30 | - | - | - | - | - | - | - | 0.08 | 0.1 | 0.15 - | - | |
| 40 | - | - | - | - | - | - | - | 0.08 | 0.1 | 0.15 - | - | |
| 50 | - | - | - | - | - | - | - | 0.08 | 0.1 | 0.15 - | - | |
| 60 | - | - | - | - | - | - | - | 0.08 | 0.1 | 0.15 - | - |
| Depth[m] | Jan | Feb | Mar | Apr | May | Jun | Jul | Aug | Sep | Oct | Nov | Dec |
|---|---|---|---|---|---|---|---|---|---|---|---|---|
| 0 | - | - | - | - | - | - | - | 6 | 6 | - | - | - |
| 10 | - | - | - | - | - | - | - | 6 | 6 | - | - | - |
| 20 | - | - | - | - | - | - | - | 6 | 6 | - | - | - |
| 30 | - | - | - | - | - | - | - | 6 | 6 | - | - | - |
| 40 | - | - | - | - | - | - | - | 6 | 6 | - | - | - |
| 50 | - | - | - | - | - | - | - | 6 | 6 | - | - | - |
| 60 | - | - | - | - | - | - | - | 6 | 6 | - | - | - |
| Area [km2] | [%] | |||
|---|---|---|---|---|
| Natural landscape | ||||
| Woody vegetation | 56,262 | 75.2 | ||
| Herbaceous vegetation | 0 | 0 | ||
| Swamp | 9,928 | 13.3 | ||
| Others | 1,719 | 2.3 | ||
| Agricultural land | Crop | |||
| field | 685 | 0.9 | ||
| Pasture land | 400 | 0.5 | ||
| Residential area | 5,750 | 7.7 | ||
| Others | 119 | 0.2 Total | 74,863 | 100 |
G2 INDUSTRIES IN THE CATCHMENT AREA AND THE LAKE (Q) 1975
| Gross product | No. of | No. of | Main products | |
|---|---|---|---|---|
| per year | per persons establish- | or major | ||
| [US$] | engaged | ments | industries | |
| Primary industry | 25 | Lumber | ||
| Secondary industry | ||||
| Pulp, paper | 60 mill. | Paper, metal | ||
| Aluminium | 14 mill. | 3,500* | 13* | (Al), |
| Dairy | ||||
| Others | products, beef |
G3 POPULATION IN THE CATCHMENT AREA (Q) 1971
| Population | Major cities | ||
|---|---|---|---|
| Population | density [km-2] | (population) | |
| Rural | 103,308 | 18.1 | Alma |
H. LAKE UTILIZATION
H1 LAKE UTILIZATION (Q) Source of water, navigation, transportation (wood floating), sightseeing, tourism (no. of visitors in 1985: 5,000), recreation (swimming, sport-fishing, yachting) and hydroelectric generation.H2 THE LAKE AS WATER RESOURCE (Q) 1987
| Use rate | |
|---|---|
| Domestic | Negligible |
| Irrigation | None |
| Industrial | For pulp and paper |
| Power plant | 1,453,000 [kW] |
I. DETERIORATION OF LAKE ENVIRONMENTS AND HAZARDS
I1 ENHANCED SILTATION (Q) Extent of damage: Serious. Supplementary notes Landslide of marine clay and severe erosion of shoreline due to the artificial maintenance of high water level (+5.5 m) for power generation.I2 TOXIC CONTAMINATION (Q) Present status: Detected but not serious. Main contaminants, their concentrations and sources Lake centre, 1977
| Name of | Concentrations [ppm] | Main |
|---|---|---|
| contaminants | Bottom mud | sources |
| As | 4 | Natural |
| Zn | 120 | Natural |
| Hg | 0.25 | Natural |
| Pb | 30 | Car |
Acid soluble Zn distribution in surface sediments [ppm].
Total Hg distribution in surface sediments [ppm].
Acid soluble Pb distribution in surface sediments.
Past trends Trace metals increased in the lake sediments since 1840
(at 16 cm level).
I3 EUTROPHICATION (Q) Nuisance caused by eutrophication Unusual
algal bloom: Rhodomonas sp. Nitrogen and phosphorus loadings to the lake
[kg km-2 day-1] 1976
| Sources | Industrial | Domestic | Agricultural | Natural | Total |
|---|---|---|---|---|---|
| T-N | - | Minor | Major | 5.3 | 16.5 |
| T-P | - | Minor | Major | 0.6 | 1.08 |
I4 ACIDIFICATION (Q) Extent of damage: None. Not for that large lake, but detected in many small ones in the same catchment.
I5 OTHER HAZARDS Pulp and paper mills, log floating and hydroelectric dam operation.
J. WASTEWATER TREATMENTS
J1 GENERATION OF POLLUTANTS IN THE CATCHMENT AREA- c) Limited pollution with wastewater treatment.
| [%] | |
|---|---|
| Non-point sources | 95 |
| Point sources | |
| Industrial sources | 5 |
K. IMPROVEMENT WORKS IN THE LAKE
K3 OTHERS Artificial shoreline structure to prevent erosion. Filling nice sandy beaches with coarse gravel and stones, etc. to prevent erosion.M. LEGISLATIVE AND INSTITUTIONAL MEASURES FOR UPGRADING LAKE
ENVIRONMENTS M1 NATIONAL AND LOCAL LAWS CONCERNED Names of the laws (the year of legislation)- Law related to the Quality of the Environment of the Quebec Province Government. Responsible authorities
- Quebec Ministry of Environment Main items of control
- Urban waste treatment
- Service de la Protection de l'Environment in 1979, Quebec city
- Ministry of Environment, Quebec city
- Quebec University
N. SOURCES OF DATA
- Questionnaire filled by Dr. M. Ouelett, Institut National de la Recherche Scientifique, Universite du Quebec, Canada, based on the following sources.
- Ouellett, M. & Jones, H. G. (1987) Verh. Intern. Verein Limnol., 23 (in press).
- Jones, H. G., Ouellett, M., Leclerc, M., Cluis, D., Couture, P., Potvin, L. & Sochanska, W. (1980) INRS-Eau (Quebec University), rapport scientifique No. 76, 642 pp.
- Ouellett, M. (1984) INRS-Eau (Quebec University), rapport scientifique No. 137, 630 pp.
- Talbot, J. & Lapointe, A. (1988) Ministere du Tourisme, de la Chasse et de la Peche du Quebec, Quebec.
- Ouellett, M. (1979) INRS-Eau (Quebec University), rapport scientifique No. 104, 934 pp.
