
LAKE WASHINGTON
A iew of the lake with Mr. Rainiew in the background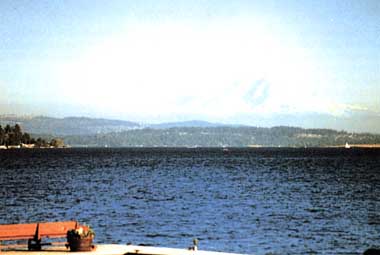
Photo: Y. Kurata
A. LOCATION
Washington, USA. 47:0 -47:5 N, 122:0 -122:6 W; ca. 0 m above sea level.B. DESCRIPTION
Lake Washington is a long, narrow lake located in an urbanized area close to Seattle. It covers an area of 88 km2 and is crossed by two floating bridges. The lake shore affords a good view of the snow-covered cone of Mt. Rainier. The climate around the lake is mild throughout the year with only sporadic snowfall in winter.In 1916, a canal with locks and a fish ladder was made connecting the lake with the open sea to the west for navigation. The lake had been still oligotrophic in the late 1930's, but an increasing influx of urban sewage from the surrounding area caused rapid progress of eutrophication, as indicated by the frequent bloom of blue-green algae in summer since 1955. However, the construction of sewage treatment plants and the diversion of treated water through a 180 km-long pipeline, carried out in the five years from 1963 to 1968, have improved the quality of the lake water until it recovered almost completely in 1975. The chemical parameters of the lake water have remained quite stable for the past ten years, and the citizens of Seattle and neighboring cities enjoy swimming, fishing and sailing in the lake again.
C. PHYSICAL DIMENSIONS
| Surface area [km2] | 88 |
| Volume [km3] | 2.89 |
| Maximum depth [m] | 65.2 |
| Mean depth [m] | 32.9 |
| Water level | Regulated |
| Residence time [yr] | 3.1-1.7 |
| Catchment area [km2] | 1,274 |
D. PHYSIOGRAPHIC FEATURES
D1 GEOGRAPHICAL Bathymetric map: Fig. NAM-09-01. Names of main islands: Mercer. Number of outflowing rivers and channels (name) 1 (Lake Washington Ship Canal).D2 CLIMATIC Climatic data at Seattle, 1931-1960 (1) Mean temp. [deg C]
| Jan | Feb | Mar | Apr | May | Jun | Jul | Aug | Sep | Oct | Nov | Dec | Ann. |
|---|---|---|---|---|---|---|---|---|---|---|---|---|
| 5.1 | 6.4 | 8.0 | 11.0 | 14.1 | 16.3 | 18.7 | 18.3 | 16.2 | 12.4 | 8.3 | 6.6 | 11.8 |
| Jan | Feb | Mar | Apr | May | Jun | Jul | Aug | Sep | Oct | Nov | Dec | Ann. |
|---|---|---|---|---|---|---|---|---|---|---|---|---|
| 132 | 99 | 84 | 50 | 40 | 36 | 16 | 19 | 42 | 83 | 127 | 138 | 865 |
Bathymetric map (Q).
Water temperature [deg C](Q) Madison Park Station, 1982
| Depth[m] | Jan | Feb | Mar | Apr | May | Jun | Jul | Aug | Sep | Oct | Nov | Dec |
|---|---|---|---|---|---|---|---|---|---|---|---|---|
| S* | 7.7 | 7.4 | 7.6 | 9.4 | 13.8 | 19.9 | 20.0 | 20.2 | 18.7 | 15.1 | 11.0 | 9.1 |
Seasonal and vertical distribution of water temperature (Madison Park Station), 1982 (Q).
Freezing period: None. Mixing type: Monomictic. Notes on water mixing and thermocline formation Thermocline exists usually from late April or early May until early December.
E. LAKE WATER QUALITY (Q)
E1 TRANSPARENCY [m] Madison Park Station, 1982| Depth[m] | Jan | Feb | Mar | Apr | May | Jun | Jul | Aug | Sep | Oct | Nov | Dec |
|---|---|---|---|---|---|---|---|---|---|---|---|---|
| 7.2 | 7.0 | 5.7 | 4.4 | 2.6 | 6.4 | 6.4 | 5.9 | 5.6 | 5.4 | 6.6 | 6.9 |
| Depth[m] | Jan | Feb | Mar | Apr | May | Jun | Jul | Aug | Sep | Oct | Nov | Dec |
|---|---|---|---|---|---|---|---|---|---|---|---|---|
| S* | 7.20 | 7.26 | 6.25 | 8.19 | 9.02 | 8.75 | 8.38 | 8.22 | 8.18 | 7.71 | 7.42 | 7.27 |
| Depth[m] | Jan | Feb | Mar | Apr | May | Jun | Jul | Aug | Sep | Oct | Nov | Dec |
|---|---|---|---|---|---|---|---|---|---|---|---|---|
| 0 | 1.19 | 1.35 | 1.52 | 3.99 | 5.52 | - | 1.27 | 1.92 | 2.98 | 1.81 | 1.64 | 1.86 |
| 5 | - | - | - | 4.32 | 5.50 | - | 1.30 | - | 2.03 | 2.16 | 1.69 | - |
| 10 | 1.47 | 1.51 | 1.58 | 3.61 | 2.79 | - | 1.38 | 2.01 | 1.99 | 2.03 | 1.54 | 1.50 |
| 15 | - | - | - | 2.72 | 1.28 | - | 1.39 | 0.81 | 0.80 | 1.69 | - | - |
| 20 | - | - | - | - | 0.86 | - | 0.69 | 0.71 | 0.78 | 0.65 | 1.56 | - |
| 30 | - | - | - | - | - | - | 0.58 | 0.59 | 0.87 | 0.58 | 0.90 | 1.58 |
| 40 | - | - | - | - | - | - | 0.30 | 0.56 | 0.62 | 0.76 | 0.90 | 1.40 |
| 50 | - | - | - | - | - | - | 0.40 | 0.56 | 0.64 | 0.93 | 1.52 | 1.47 |
| 60 | 1.23 | 1.79 | 1.95 | 3.15 | 1.84 | - | 1.38 | 1.90 | 0.96 | 1.92 | 1.62 | 1.91 |
| Depth | Jan | Feb | Mar | Apr | May | Jun | Jul | Aug | Sep | Oct | Nov | Dec |
|---|---|---|---|---|---|---|---|---|---|---|---|---|
| 0 | 10.17 | 11.14 | 11.52 | 12.96 | 12.76 | 10.14 | 9.51 | 9.78 | 9.42 | 9.66 | 9.55 | 9.51 |
| 5 | - | - | - | 12.84 | 12.72 | 10.99 | 9.51 | 9.88 | 9.38 | 9.64 | 9.55 | - |
| 10 | 10.12 | 11.10 | 11.58 | 12.06 | 11.53 | 10.19 | 9.24 | 9.31 | 9.12 | 9.54 | 9.49 | 9.51 |
| 15 | - | - | - | 11.44 | 11.09 | 9.79 | 8.56 | 7.51 | 9.06 | 6.77 | - | - |
| 20 | - | - | - | 10.97 | 9.93 | 8.84 | 8.17 | 7.45 | 6.83 | 9.45 | - | - |
| 30 | - | - | - | - | 10.42 | 9.72 | 9.11 | 8.48 | 7.67 | 6.70 | 9.55 | - |
| 40 | - | - | - | - | - | - | 9.86 | 9.05 | 8.37 | 7.87 | 6.42 | 9.55 |
| 50 | - | - | - | - | - | 9.84 | 9.61 | 8.57 | 8.19 | 6.99 | 5.99 | 9.35 |
| 60 | 10.05 | 11.05 | 11.13 | 10.92 | 9.43 | 7.69 | 7.64 | 6.11 | 5.98 | 5.50 | 5.54 | 6.15 |
| Depth[m] | Jan | Feb | Mar | Apr | May | Jun | Jul | Aug | Sep | Oct | Nov | Dec |
|---|---|---|---|---|---|---|---|---|---|---|---|---|
| 0 | 0.40 | 0.61 | 3.08 | 11.61 | 19.96 | 2.40 | 3.22 | 2.53 | 3.03 | 5.64 | 4.00 | 3.18 |
| 5 | - | - | - | 11.37 | 24.34 | 3.46 | 2.92 | 4.40 | 3.44 | 6.17 | 5.28 | - |
| 10 | 0.57 | 0.61 | 3.52 | 8.61 | 11.47 | 3.44 | 2.79 | 3.87 | 2.61 | 7.32 | 4.18 | 3.32 |
| 15 | - | - | - | 7.37 | 4.77 | 2.97 | 1.96 | 2.54 | 1.12 | 6.33 | - | - |
| 20 | - | - | - | - | 2.38 | 1.34 | 1.48 | 1.52 | 0.90 | 0.83 | 4.66 | - |
| 30 | - | - | - | - | - | 0.75 | 0.71 | 0.49 | 0.43 | 0.60 | 0.97 | 3.59 |
| 40 | - | - | - | - | - | - | 0.87 | 0.37 | 0.40 | 0.59 | 0.98 | 3.51 |
| 50 | - | - | - | - | - | 0.61 | 0.70 | 0.31 | 0.28 | 0.74 | 1.09 | 3.30 |
| 60 | 0.66 | 0.56 | 1.87 | 2.91 | 2.71 | 1.03 | 1.20 | 0.99 | 0.21 | 1.27 | 1.32 | 2.94 |
| Depth[m] | Jan | Feb | Mar | Apr | May | Jun | Jul | Aug | Sep | Oct | Nov | Dec |
|---|---|---|---|---|---|---|---|---|---|---|---|---|
| 0 | .24 | .244 | .203 | .249 | .322 | .248 | .213 | .294 | .268 | .277 | .299 | .216 |
| 5 | - | - | - | .289 | .327 | .317 | .219 | .256 | .223 | .254 | .446 | - |
| 10 | .221 | .266 | .182 | .249 | .275 | .311 | .183 | .256 | .268 | .277 | .247 | .171 |
| 15 | - | - | - | .223 | .236 | .279 | .195 | .138 | .189 | .331 | - | - |
| 20 | - | - | - | - | .178 | .216 | .207 | .225 | .242 | .215 | .247 | - |
| 30 | - | - | - | - | - | .178 | .178 | .213 | .175 | .277 | .194 | .22 |
| 40 | - | - | - | - | - | - | .178 | .294 | .182 | .231 | .262 | .156 |
| 50 | - | - | - | - | - | .19 | .225 | .256 | .189 | .277 | .232 | .182 |
| 60 | .212 | .216 | .194 | .151 | .171 | .197 | .178 | .313 | .195 | .277 | .239 | .192 |
| Depth[m] | Jan | Feb | Mar | Apr | May | Jun | Jul | Aug | Sep | Oct | Nov | Dec |
|---|---|---|---|---|---|---|---|---|---|---|---|---|
| 0 | .027 | .030 | - | .025 | .029 | .011 | .009 | .011 | .012 | .013 | .012 | .018 |
| 5 | - | - | - | .026 | .021 | .015 | .010 | .012 | .013 | .010 | .011 | .015 |
| 10 | .028 | .030 | - | .029 | .013 | .019 | .009 | .012 | .012 | .010 | .011 | - |
| 15 | - | - | - | .026 | .010 | .008 | .009 | .011 | .007 | .010 | - | - |
| 20 | - | - | - | - | .016 | .008 | .009 | .010 | .006 | .006 | .012 | - |
| 30 | - | - | - | - | - | .019 | .017 | .015 | .014 | .013 | .023 | .016 |
| 40 | - | - | - | - | - | - | .019 | .025 | .023 | .022 | .028 | .017 |
| 50 | - | - | - | - | - | .024 | .022 | .030 | .030 | .032 | .030 | .022 |
| 60 | .028 | .032 | - | .043 | .031 | .026 | .031 | .045 | .034 | .041 | .037 | .026 |
F. BIOLOGICAL FEATURES
F1 FLORA Floating macrophytes: Nymphaea odorata. Submerged macrophytes Myriophyllum spicatum, Ceratophyllum demersum, Potamogeton spp., Elodea canadensis, Zanichellia palustris. Phytoplankton Spring Melosira italica, Fragilaria crotonensis, Stephanodiscus spp., Cyclotella pseudostelligera. Summer and autumn Aphanizomenon flos-aquae, Microcystis aeruginosa, Coelosphaerium haegilianum, Tabellaria flocculosum, Oociptis gigas.F2 FAUNA Zooplankton Daphnia pulicaria, D. thorata, Diaptomus ashlandi, Epischura sp., Neomysis mercedis. Benthos: Various species of chironomids (not identified). Fish Oncorhynchus nerka, O. tshaorytscha, Salmo gairdneri, Micropterus salmoides, Perca flavescens, Lepomis gibbosus, Osmerus sp.
F5 FISHERY PRODUCTS Annual fish catch 1984: Not estimated*. * Sport-fishing only.
F7 NOTES ON THE REMARKABLE CHANGES OF BIOTA IN THE LAKE IN RECENT YEARS Change in phytoplankton from Oscillatoria dominance to diatom dominance since sewage diversion. Appearance and domination of Daphnia spp. since 1976. Appearance and spread of Myriophyllum in shallow water zones.
G. SOCIO-ECONOMIC CONDITIONS
G1 LAND USE IN THE CATCHMENT AREA 1984| Area [km2] | [%] | |
|---|---|---|
| Natural landscape | ||
| Woody and | 382 | 30 |
| herbaceous vegetation | ||
| Agricultural land | 127 | 10 |
| Residential area | 765 | 60 |
| Total | 1,274 | 100 |
G2 INDUSTRIES IN THE CATCHMENT AREA AND THE LAKE 1982 Mainly residential and recreational use of the lake and shoreline. Boeing Company at the south end of the lake.
G3 POPULATION IN THE CATCHMENT AREA 1982
| Population | Major cities | ||
|---|---|---|---|
| Population | density [km-2] | (population) | |
| Total | 1,500,000 | 1,180 | Seattle (490,000), Bellevue |
H. LAKE UTILIZATION
H1 LAKE UTILIZATION Navigation, tourism and recreation (swimming, yachting and sport-fishing).H2 THE LAKE AS WATER RESOURCE 1984: Not used.
I. DETERIORATION OF LAKE ENVIRONMENTS AND HAZARDS
I1 ENHANCED SILTATION Extent of damage: Not serious.I3 EUTROPHICATION Nuisance caused by eutrophication Unusual bloom of Oscillatoria agardhii in the late 1950's to 1974; since gone from the lake. Nitrogen and phosphorus loadings to the lake Nitrogen mainly from agricultural and natural sources, and phosphorus mainly from domestic and agricultural sources.
I4 ACIDIFICATION
- Extent of damage: Not serious.
J. WASTEWATER TREATMENTS
J1 GENERATION OF POLLUTANTS IN THE CATCHMENT AREA- c) Limited pollution with wastewater treatment.
K. IMPROVEMENT WORKS IN THE LAKE
K1 RESTORATION Diversion: All sewage effluent diverted from the lake in 1968 and disposed of elsewhere (Puget Sound).M. LEGISLATIVE AND INSTITUTIONAL MEASURES FOR UPGRADING LAKE ENVIRONMENTS
M1 NATIONAL AND LOCAL LAWS CONCERNED Responsible authorities- Municipality of metropolitan Seattle Main items of control
- Sewage treatment and disposal
N. SOURCES OF DATA
- Questionnaire filled by Dr. S. Abella by recommendation of Dr. W. T. Edmondson, Department of Zoology, University of Washington.
- Muller, M. J. (1982) Selected Climatic Data for a Global Set of Standard Stations for Vegetation Science. 306 pp. Dr. W. Junk Publishers, The Hague.
