LAKE ONTARIO
On the lakeshore at Burlington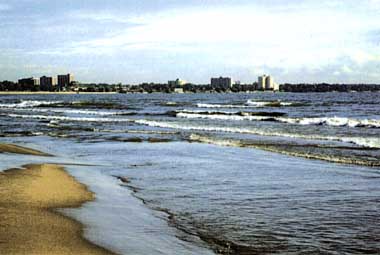
Photo: A. Kurata
A. LOCATION
B. DESCRIPTION
Lake Ontario is the smallest and easternmost of the Great Lakes, covering only 19,099 km2, but is still nearly 30 times the area of L. Biwa. The Lake forms part of the international boundary between Canada and the United States; the whole northern shore belongs to the Canadian Province of Ontario and its southern shore is in the State of New York. Water flows into the lake from L. Erie through the Niagara River with the famous Niagara Falls, and flows out at the northeast end into the St. Lawrence River. There are no large islands in the lake, apart from the far east corner at the entrance to the St. Lawrence River. The most densely populated and industrialized area of Ontario Province is located on the west side of the lake, but there are only a few cities of significant size on the American side.The eutrophication of the lake started with the increase of population in the lake's drainage basin at the beginning of this century, and continued to advance until around 1973. It has been shown by scientists that the eutrophication of Lakes Ontario, Erie and Michigan is due to the increase in phosphorus loading, of which the main source is sewage effluents and in particular the domestic use of detergents containing phosphorus. After the Canada. U.S. international treaty was signed in 1972 for preventing eutrophication of the Great Lakes, however, the concentration of phosphorus in the lake water is decreasing owing to the prohibition on detergent use and the required treatment of sewage discharged into the drainage basin.
C. PHYSICAL DIMENSIONS (1)
| Surface area [km2] | 19,009 |
| Volume [km3] | 1,638 |
| Maximum depth [m] | 224 |
| Mean depth [m] | 86 |
| Water level | Unregulated |
| Length of shoreline [km] | 1,161 |
| Residence time [yr] | 7.9 |
| Catchment area [km2] | 75,272* |
D. PHYSIOGRAPHIC FEATURES
D1 GEOGRAPHICAL Bathymetric map: Fig. NAM-07-01. Number of outflowing rivers and channels (name): 1 (St. Lawrence R.)(Q).D2 CLIMATIC Climatic data at Rochester, 1941-1970 (Q) Mean temp. [deg C]
| Jan | Feb | Mar | Apr | May | Jun | Jul | Aug | Sep | Oct | Nov | Dec | Ann. |
|---|---|---|---|---|---|---|---|---|---|---|---|---|
| -4.4 | -4.0 | 0.6 | 7.8 | 13.6 | 19.4 | 21.8 | 20.7 | 16.8 | 11.3 | 4.7 | -2.1 | 8.8 |
| Jan | Feb | Mar | Apr | May | Jun | Jul | Aug | Sep | Oct | Nov | Dec | Ann. |
|---|---|---|---|---|---|---|---|---|---|---|---|---|
| 63 | 61 | 66 | 66 | 74 | 76 | 79 | 71 | 69 | 71 | 69 | 66 | 828 |
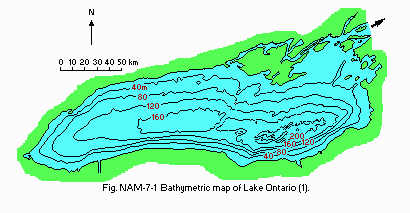
Bathymetric map (1).
Water temperature [deg C](Q1, 2) 1904-1968
| Depth[m] | Jan | Feb | Mar | Apr | May | Jun | Jul | Aug | Sep | Oct | Nov | Dec |
|---|---|---|---|---|---|---|---|---|---|---|---|---|
| S* | 2 | 2 | 2 | 4 | 7 | 12 | 19 | 20 | 18 | 13 | 7 | 3 |
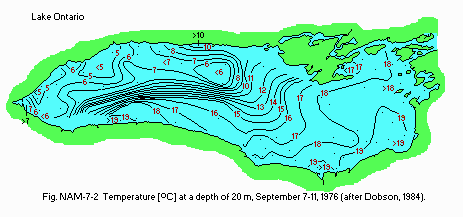
Temperature [deg C] at a depth of 20 m, 7-11 September 1976 (after Dobson, 1984).
Freezing period Middle January-early April, 15% ice coverage (rarely freezes over). Notes on water mixing and thermocline formation The thermocline is formed from early June to middle October; a thermal bar forms in middle April to middle June, isolating nearshore from offshore waters.
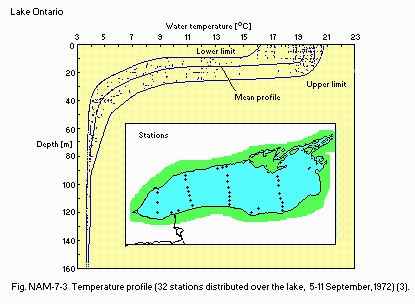
Temperature profile (32 stations distributed over the lake, 5-11 September 1972)(3).
E. LAKE WATER QUALITY
E1 TRANSPARENCY [m](Q1) Lake-wide surveys for 15-176 stations, 1979| Depth[m] | Apr | May | Jun | Jul | Aug | Sep | Oct |
|---|---|---|---|---|---|---|---|
| 1.8 | 3.4 | 4.2 | 6.2 | 5.3 | 4.9 | 2.9 |
| Depth[m] | Apr | May | Jun | Jul | Aug | Sep | Oct |
|---|---|---|---|---|---|---|---|
| 7.76 | 8.25 | 8.36 | 7.97 | 8.20 | 8.35 | 8.14 |
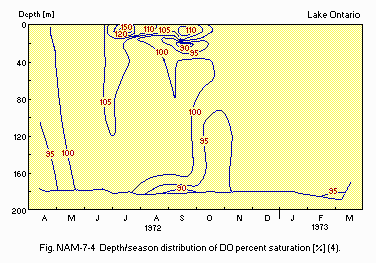
Depth/season distribution of DO percent saturation [%](4).
E6 CHLOROPHYLL CONCENTRATION [micro g l-1](5) Lake-wide surveys, 1974
| Depth[m] | Apr | May | Jun | Jul | Aug | Sep | Oct | Nov |
|---|---|---|---|---|---|---|---|---|
| 5.7 | 6.3 | 5.0 | 4.8 | 4.2 | 5.5 | 8.8 | 5.9 |
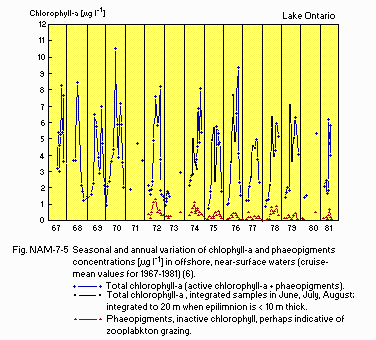
Seasonal and annual variation of chlorophyll a and phaeopigments concentrations [micro g l-1] in offshore, near-surf ace waters (cruise-mean values for 1967-1981)(6).
E8 PHOSPHORUS CONCENTRATION: Fig. NAM-07-06.
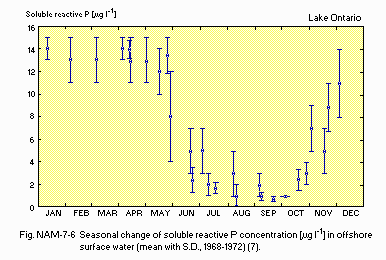
Seasonal change of soluble reactive P concentration [micro g l-1] in offshore surface water (mean with S.D., 1968-1972)(7).
E10 PAST TRENDS: Fig. NAM-07-07 and 08.
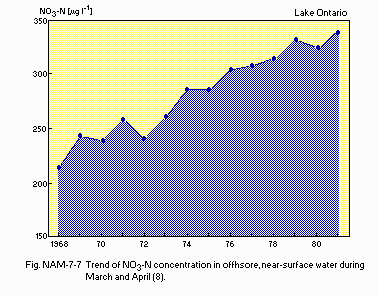
Trend of NO3-N concentration in of offshore, near-surf ace water during March and April (8).
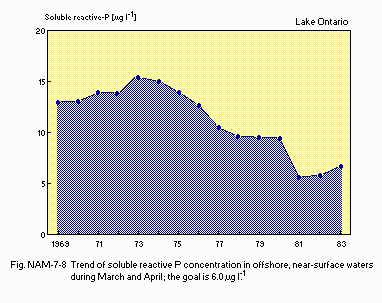
Trend of soluble reactive P concentration in offshore, near-surface waters during March and April; the goal is 6.0 micro g l-1.
F. BIOLOGICAL FEATURES
F1 FLORA Emerged macrophytes: Typha spp. (Q1). Submerged macrophytes: Potamogeton spp., Myriophyllum spp. (Q1). Phytoplankton (10) Asterionella formosa, Fragilaria crotonesis, Melosira binderana, Navicula sp., Nitzschia palea, Stephanodiscus astrea, Tabellaria fenestrata, Cryptomonas erosa, Ceratium hirundinella, Glenodinium pulvisculus, Aphanizomenon flos- aquae, Oscillatoria limnetica, Ankistrodesmus borgei, Pediastrum simplex, Staurastrum paradoxum, Wothrix subtilissima.F2 FAUNA (Q1) Zooplankton Cyclops bicuspidatus thomasi, Daphnia retrocurva, Bosmina longirostris, Tropocyclops prasinus mexicanus, Ceriodaphnia lacustris, Keratella cochlearis, Polyarthra sp. Benthos Pontoporeia affinis, Heterotrissocladius oliveri, Procladius sp., Stylodrilus heringianus, Mysis relicta. Fish Coregonus cupeaformis, Alosa pseudoharengus, Osmerus mordax, Stigostedion vitreum, Morone americana, Perca flavescens, Micropterus dolemieui, Lepomis gibbosus, L. macrochirus, Ictalus nebulosus, Catostomus commersoni.
F3 PRIMARY PRODUCTION RATE (11) Net primary production rate [mg C m-2 day-1] Whole lake surveys, January-December 1970: 120-1,080.
F5 FISHERY PRODUCTS (Q1) Annual fish catch* [metric tons] 1975-1981: 1,100-3,500. * Commercial
F7 NOTES ON THE REMARKABLE CHANGES OF BIOTA IN THE LAKE IN RECENT YEARS (Q1) Between 1923 and 1954 the standing crop of phytoplankton approximately doubled in the waters near Toronto. The dominant algae in the spring pulse changed from Asterionella to Cyclotella and Melosira during this period. Dramatic decline of lake trout (Salvelinus namaycush) and Coregonus spp. to very low levels took place during 1930-1950.
G. SOCIO-ECONOMIC CONDITIONS
G1 LAND USE IN THE CATCHMENT AREA (Q1) 1978| Area [km2] | [%] | |||
|---|---|---|---|---|
| Natural landscape | USA | Canada | Total | |
| Woody vegetation | 29,422 | 12,546 | 41,968 | 55.8 |
| Herbaceous vegetation | 5,387 | 848 | 6,235 | 8.3 |
| align="left"Swamp | ||||
| Agricultural land | ||||
| Crop field | 4,079 | 3,877 | 7,956 | 10.6 |
| Pasture land | 5,262 | 10,565 | 15,827 | 21.0 |
| Residential area | 1,553 | 1,102 | 2,655 | 3.5 |
| Others | 67 | 564 | 631 | 0.8 |
| Total | 45,770 | 29,502 | 75,272 | 100.0 |
G2 INDUSTRIES IN THE CATCHMENT AREA AND THE LAKE
USA 1970, Canada 1980-1981
| Gross product | No. of | No. of | Main products | ||
|---|---|---|---|---|---|
| per year | persons | establish- | or major | ||
| [mill. $]* | engaged | ments | industries | ||
| Primary industry | |||||
| Agriculture | |||||
| USA | 1,003.35 | 31,677 | 29,151 | ||
| Canada | 952.44 | N.A. | 22,374 | 1) | |
| Fisheries | |||||
| USA | N.A. | N.A. | N.A. | ||
| Canada | 1.90 | 294 | N.A. | 2) | |
| Others | |||||
| USA | N.A. | N.A. | N.A. | ||
| Canada | 185.72 | 533 | 17 | 3) | |
| Secondary industry | |||||
| Manufacturing | |||||
| USA | 8,255.30 | 308,787 | N.A. | ||
| Canada | 44,720.70 | 514,620 | 7,665 | 4) | |
| Mining | |||||
| USA | 116.40 | 3,206 | N.A. | ||
| Canada | 398.06 | N.A. | N.A. | 5) | |
| Others | |||||
| USA | N.A. | 620,696 | N.A. | ||
| Canada | 7,150.02 | 110,538 | N.A. | 6) |
G3 POPULATION IN THE CATCHMENT AREA (Q1) USA 1970, Canada 1981
| Population | Major cities | ||
|---|---|---|---|
| Population | density [km-2] | (population) | |
| USA | 2,531,700 | 94.8 | |
| Canada | 4,604,100 | N.A. | Toronto (633,000), Hamilton, |
| Rochester, St. Catherines | |||
| Total | 7,135,800 | N.A. |
H. LAKE UTILIZATION
H1 LAKE UTILIZATION (Q1) Source of water, navigation, fisheries, tourism and recreation (swimming, sport-fishing, yachting).H2 THE LAKE AS WATER RESOURCE 1975
| Use rate [m3 sec-1] | ||
|---|---|---|
| USA | Canada | |
| Domestic | 8.4 | 17.6 |
| Irrigation | 0.6 | 1.1 |
| Industrial | 18.0 | 56.3 |
| Power plant | 101.7 | 129.4 |
| Others | ||
| Mining | 2.6 | 0.3 |
| Rural-stock | N.A. | 0.6 |
I. DETERIORATION OF LAKE ENVIRONMENTS AND HAZARDS
I2 TOXIC CONTAMINATION Summary and range of concentrations of organic contaminants in Lake Ontario media [ppt]*1 (12)| Chemical | Total DDT | PCBs | Mirex | CBs | Dioxins | Lindane |
|---|---|---|---|---|---|---|
| Raw water | 0.3 - 57 | 5 - 60 | 0.1 | 1 - 54 | .01 -0.3 | 0.4 - 11 |
| Bottom | 25,000- | 110,000- | 144,000 | 11,000- | 8000 | 46,000 |
| sediment | 218,000 | 1,600,000 | 4,500,000 | |||
| Benthos | 440,000- | 470,000- | 41,000- | |||
| 1,088,000 | 9,000,000 | 228,000 | NA*3 | NA | NA | |
| "Suspended" | 40,000 | 600,000- | 15,000 | 574,000 | NA | 1,000- |
| sediments | 6,000,000 | 12,000 | ||||
| Plankton | 63,000- | 110,000- | ND*2- | 27,000 | NA | 12,000 |
| 72,000 | 6,100,000 | 12,000 | ||||
| Fishes | 620,000- | 1,378,000- | 50,000- | 6,000- | 5- | 2,000- |
| 7,700,000 | 17,000,000 | 340,000 | 370,000 | 107 | 360,000 | |
| Herring | 7,700,000- | 41,000,000- 1,800,000- | 44- | |||
| gull eggs | 34,000,000 | 204,000,000 | 6,350,000 | 300,000 | 1,200 | 78,000 |
| Element | Concentration |
|---|---|
| As | 3.3 |
| Cd | 2.5 |
| Cr | 48 |
| Cu | 50 |
| Pb | 106 |
| Hg | 0.65 |
| Ni | 52 |
| Zn | 192 |
| Contaminants | 1979 | 1981 | 1982 |
|---|---|---|---|
| DDE | 9.0 | 10 | 12 |
| PCBs | 76 | 72 | 64 |
| Mirex | 1.8 | 2.5 | 3.6 |
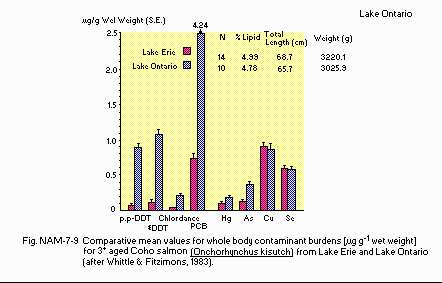
Comparative mean values for whole body contaminant burdens [micro g (wet wt.) g-1] for 3+ aged Coho salmon (Onchorhynchus kisutch) from Lake Erie and Lake Ontario (after Whittle & Fitzimons, 1983).
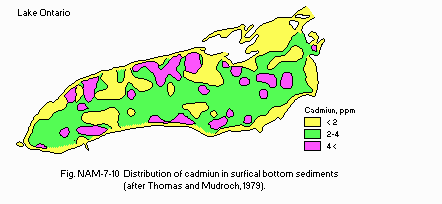
Distribution of cadmium in surficial bottom sediments (after Thomas and Mudroch, 1979).
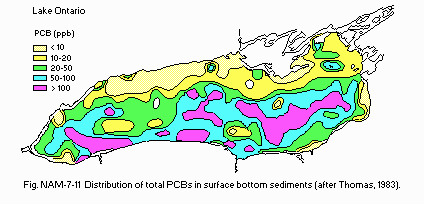
Distribution of total PCBs in surface bottom sediments (after Thomas, 1983).
Supplementary notes (Q2) Toxic contamination hazards included the input of toxic inorganic and organic chemicals from municipal point sources, combined sewer overflows, rural and urban nonpoint sources and leachates from municipal and hazardous waste landfill disposal sites. Problems from these sources are most apparent in highly industrialized harbors and embayments and nearby areas.
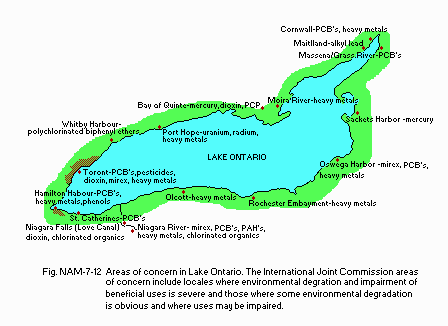
Areas of concern in Lake Ontario. The International Joint Commission areas of concern include locales where environmental degradation and impairment of beneficial uses is severe and those where some environmental degradation is obvious and where uses may be impaired.
I3 EUTROPHICATION (Q) Nuisance caused by eutrophication Disturbed filtration in cleaning bed. While eutrophication problems are not evident in the open waters, there are local problems near major tributaries. Nitrogen and phosphorus loadings to the lake [t yr-1]
| Sources | Industrial | Domestic | Agricultural | Natural | Total |
|---|---|---|---|---|---|
| T-N 1967 | N.A. | N.A. | N.A. | N.A. | 176,000 |
| T-P 1967 | N.A. | N.A. | N.A. | N.A. | 27,300 |
| 1976 | 102 | 2,815 | 3,581 | 488 | 11,755* |
J. WASTEWATER TREATMENTS
J1 GENERATION OF POLLUTANTS IN THE CATCHMENT AREA- f) Severe pollution with well-developed wastewater treatment.
K. IMPROVEMENT WORKS IN THE LAKE
Kl RESTORATION Multi-billion dollar remedial programs (capital operating) to improve sewage treatment for removal of BOD and phosphorus (to 1 mg l-1) were inaugurated in Canada and the USA in 1970, following a report on pollution in Lake Erie and Ontario undertaken by the International Joint Commission. A regional (Great Lakes) Office of the International Joint Commission was established under the Canada-United States Great Lakes Water Quality Agreement of 1972 in Windsor, Ontario.M. LEGISLATIVE AND INSTITUTIONAL MEASURES FOR UPGRADING LAKE ENVIRONMENTS
See L. Erie.N. SOURCES OF DATA
- Questionnaire filled by Drs. J. R. Vallentyne and K. Suboch, Canada Centre for Inland Waters, Burlington.
- Questionnaire filled by Prof. F. M. D'Itri, Institute of Water Research, Michigan State University, Lansing.
- International Joint Commission (1969) Report on Pollution of Lakes Ontario and Erie.
- Dobson, H. F. H. (1984) National Water Research Institute, Contribution No. 15, 157 pp.
- Dobson, H. F. H. (1972) Unpublished atlas.
- Dobson, H. F. H. Unpublished atlas.
- Dobson, H. F. H. (1981) Trophic conditions and trends in the Laurentian Great Lakes. Water Quality Bulletin, 6(4): 146-151, 158.
- Dobson, H. F. H. (1967-1981) Unpublished atlas.
- Dobson, H. F. H. (1968-1981) Unpublished atlas.
- Dobson, H. F. H. (1968-1981) Unpublished atlas.
- Dobson, H. F. H. (1969-1983) Unpublished atlas.
- Munawar, M. & I. F. (1981) A general composition of the taxonomic composition and size analyses of the phytoplankton of the North American Great Lakes. Verh. Internat. Verein. Limnol., 21: 1695-1716.
- Vollenweider, R. A., Munawar, M. & Stadelmann, P. (1974) A comparative review of phytoplankton and primary production in the Laurentian Great lakes. J. Fish. Res. Bd. Can., 31 (5): 739-762.
- Allan, R. J. (1986) The Role of Particulate Matter in the Fate of Contaminants in Aquatic Ecosystems. Scientific Series No. 142, 128 pp. Inland Waters Directorate, National Water Research Institute, Canada Centre for Inland Waters.
- Whittle, D. M. & Fitzsimons, J. D. (1983) J. Great Lakes Res., 9: 295- 302.
- Thomas, R. L. & Mudroch, A. (1979) Report to Small Craft Harbours, Ontario Region, December 1979. 149 pp.
- Thomas, R. L. (1983) J. Great Lakes Res., 9: 118-124.


