
LAKE ERIE
On the northwestern end of Canadian lakeshore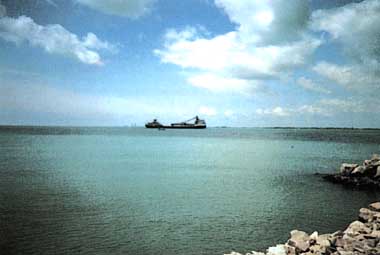
Photo: H. Kurata
A. LOCATION
Michigan, Ohio, Pennsylvania and New York, USA; and Ontario, Canada. 41:1 -42:7 N, 78:8 -83:8 W; 174 m above sea level.B. DESCRIPTION
Lake Erie is the fourth largest and shallowest of the five Great Lakes, and is the only one with its floor above sea level. Generally the eastern portion of the lake is deep, while the western part is shallow and has many islands. The northern shore of the lake is in the Province of Ontario, Canada, and the southern shore is shared by four states of the United States. The lake water comes from L. Huron through the St. Clair River and the Detroit River (via L. St. Clair) at the west end. The only natural flow-out is at the northeast end through the Niagara River; besides, the Welland Canal bypasses Niagara Falls leading to L. Ontario.Extensive commerce is carried out between the harbors on the lake as well as to and from the other Great Lakes. L. Erie is thus quite important to the St. Lawrence seaway system. The western shore side is one of the most highly industrialized and densely populated areas in the United States. The lake reached a fairly high level of eutrophication similar to that of L. Ontario before the 1970's. On the other hand, L. Erie is known, together with L. Michigan, for abundant fish catch which is much greater than that in other Great Lakes.
C. PHYSICAL DIMENSIONS
| Surface area [km2] | 25,821 |
| Volume [km3] | 458 |
| Maximum depth [m] | 64 |
| Mean depth [m] | 17.7 |
| Water level | Unregulated |
| Length of shoreline [km] | 1,369 |
| Residence time [yr] | 2.6 |
| Catchment area [km2] | 78,769* |
D. PHYSIOGRAPHIC FEATURES
D1 GEOGRAPHICAL (Q1) Bathymetric map: Fig. NAM-06-0l. Names of main islands: Pelee. Number of outflowing rivers and channels (name) 2 (Niagara R. and Welland Canal). D2 CLIMATIC Climatic data at Cleveland (Q1) Mean temp. [deg C]| Jan | Feb | Mar | Apr | May | Jun | Jul | Aug | Sep | Oct | Nov | Dec | Ann. |
|---|---|---|---|---|---|---|---|---|---|---|---|---|
| -2.8 | -2.3 | 2.3 | 9.0 | 14.6 | 19.9 | 21.9 | 21.1 | 17.7 | 12.1 | 5.3 | -0.9 | 9.8 |
| Jan | Feb | Mar | Apr | May | Jun | Jul | Aug | Sep | Oct | Nov | Dec | Ann. |
|---|---|---|---|---|---|---|---|---|---|---|---|---|
| 63 | 58 | 71 | 71 | 79 | 84 | 86 | 74 | 79 | 66 | 66 | 61 | 864 |
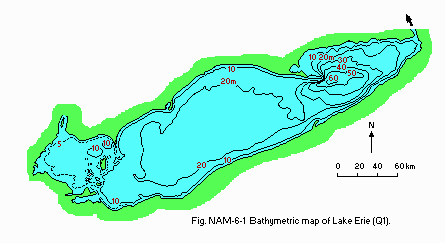
Bathymetric map (Q1).
Water temperature [deg C](Q1) Whole lake, 1968-1983
| Depth[m] | Jan | Feb | Mar | Apr | May | Jun | Jul | Aug | Sep | Oct | Nov | Dec |
|---|---|---|---|---|---|---|---|---|---|---|---|---|
| S* | 1 | 1 | 1 | 4 | 9 | 17 | 21 | 22 | 19 | 15 | 9 | 3 |
E. LAKE WATER QUALITY
E1 TRANSPARENCY [m](Q1) Lake-wide surveys, 1962-1972| Depth[m] | Jan | Feb | Mar | Apr | May | Jun | Jul | Aug | Sep | Oct | Nov | Dec |
|---|---|---|---|---|---|---|---|---|---|---|---|---|
| - | 2.7 | 1.4 | 2.1 | 2.5 | 2.8 | 4.2 | 4.2 | 3.2 | 2.4 | 1.8 | 1.5 |
E4 DO: Fig. NAM-06-02.
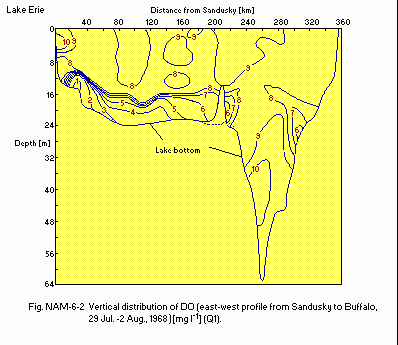
Vertical distribution of DO (east-west profile from Sandusky to Buffalo, 29 July-2 August 1968)[mg l-1](Q1).
E5 COD [mg l-1](1) 1963-1968
| Basin | Min | Max | Ann. |
|---|---|---|---|
| Western | 1.1 | 19.0 | 10.1 |
| Central | 3.1 | 16.0 | 7.8 |
| Eastern | 4.7 | 27.0 | 7.8 |
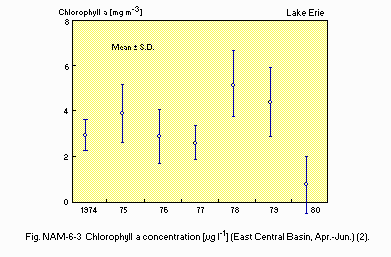
Chlorophyll a concentration [micro g l-1](East Central Basin, April-June)(2).
E7 NITROGEN CONCENTRATION (Q1) Inorganic-N [micro g l-1] Lake-wide
surveys, 1968-1980: 100-1,020.
E8 PHOSPHORUS CONCENTRATION Total-P: Fig. NAM-06-04.
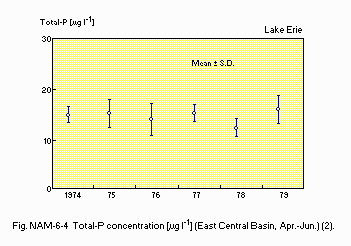
Total-P concentration [micro g l-1](East Central Basin, April-June)(2).
F. BIOLOGICAL FEATURES
F1 FLORA Emerged macrophytes (Q1) Typha sp., Scirpus acutus, S. americanus, Sparganium sp., Phragmites sp., Eleocharis sp. Submerged macrophytes (Q1) Myriophyllum spp., Potamogeton spp., Vallisneria americana, Nitella flexilis, Chara globularis, Isoetes riparia Phytoplankton (3) Coscinodiscus rotbii, Fragilaria capucina, F. crotonensis, Melosira binderana, M. islandica, Stephanodiscus tenus, Cryptomonas erosa, Rhodomonas minuta, Ceratium hirundinella, Aphanizomenon flos-aquae, Chroococcus dispersus var. minor, Chlorella sp., Cosmarium sp.F2 FAUNA (Q1) Zooplankton Protozoa (Difflugia globulosa, Codonella cratera); Cladocera (Bosmina longispina, Daphnia retrocurva); Rotifera (Polyarthra vulgaris, Notholca longispira); Copepoda (Diaptomus ashlandi, Limnocalanus macrurus). Benthos Western basin: Chironomus plumosus, Limnodrilus spp., Pisidium, Sphaerium. Central basin: Chironomus plumosus, Potamothrix spherox. Eastern basin: Procladius cf. denticulatus, Chironomus plumosus, Tubifex spp. Fish Stizostedion vitreum, Osmorus mordox, Perca flavescens, Dorosoma cepedianum, Aplodinotus grunniens, Notropis atherinoides, N. hudsonius.
F3 PRIMARY PRODUCTION RATE (4, Q2) Net primary production rate [mg C m-2 day-1] January-December 1970 Western basin (3 stations): 30-4,760. Central basin (14 stations): 120-1,690. Eastern basin (8 stations): 140-1,440. Whole lake average: 250.
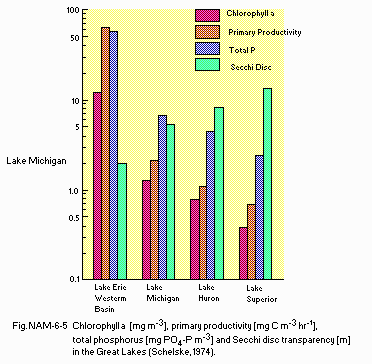
Chlorophyll a [mg m-3], primary productivity [mg C m-3 hr-1], total phosphorus [mg PO4-P m-3] and Secchi disc transparency [m] in the Great Lakes (Schelske, 1974).
F4 BIOMASS (Q1) Phytoplankton [mg l-1] April-December 1970 Western
basin: 0.8-13.2. Central basin: 0.6-6.0. Eastern basin: 1.0-4.2.
F5 FISHERY PRODUCTS Annual fish catch* [metric tons] 1915-1980:
13,000-33,000. * Commercial (Canada & U.S).
F7 NOTES ON THE REMARKABLE CHANGES OF BIOTA IN THE LAKE IN RECENT
YEARS (Q1) Primary production since the 1930's has experienced shifts
both in species dominance and standing crop. Generally the diatoms are
becoming less dominant, while green and blue-green algae are becoming more
important. A program of phosphorus control (removal from detergents and
sewage treatment plants) was initiated in 1972 in both Canada and the United
States. This has curtailed the rate of increase of phytoplankton. There
was a dramatic decline in walleye (Stizostedion vitreum) fishery in the
late 1940's; dramatic recovery in the late 1970's following closure of
the commercial walleye fishery because of high levels of mercury. The mayfly,
Hexagenia, which was an important component of the bottom fauna in the
Central and Western basins, virtually disappeared in the 1950's and 1960's
apparently from periods of low oxygen in bottom waters.
G. SOCIO-ECONOMIC CONDITIONS
G1 LAND USE IN THE CATCHMENT AREA (2, 5-10) 1978| Area [km2] | [%] | ||||
|---|---|---|---|---|---|
| U.S. | Canada | Total | |||
| Natural landscape | |||||
| Forest/woodland | 10,057 | 3,422 | 11,479 | 17.1 | |
| Barren/brush/wetland | 11,148 | 344 | 11,492 | 14.6 | |
| Agricultural land | |||||
| Crop field | 19,233 | 11,822 | 31,055 | 39.4 | |
| Pasture land | 8,823 | 6,700 | 15,523 | 19.7 | |
| Residential area | 5,531 | 659 | 6,190 | 7.9 | |
| Others | |||||
| Commercial | 797 | 233 | 1,030 | 1.3 | |
| Total | 55,589 | 23,180 | 78,769 | 100.0 |
G2 INDUSTRIES IN THE CATCHMENT AREA AND THE LAKE (2, 5-8) U.S. 1970, Canada 1980-1982
| Gross product | No. of | No. of | Main products | ||
|---|---|---|---|---|---|
| during the | persons | establish- or major | |||
| year [mill. $]*1 | engaged | ments | industries | ||
| Primary industry | |||||
| Agriculture | |||||
| U.S. | 1,731.58 | 144,900 | 72,533 | ||
| Canada | 2,200.23 | N.A. | 26,256 | 1) | |
| Fisheries | |||||
| U.S. | 10.55*2 | N.A. | N.A. | ||
| Canada | 26.26 | N.A. | N.A. | 2) | |
| Others | |||||
| U.S. | N.A. | N.A. | N.A. | ||
| Canada | 185.92 | 133 | 4 | 3) | |
| Secondary industry | |||||
| Manufacturing | |||||
| U.S. | 19,347.30 | 1,597,426 | N.A. | ||
| Canada | 21,954.00 | 210,963 | 2,701 | 4) | |
| Mining | |||||
| U.S. | 297,602.43 | 8,662 | N.A. | ||
| Canada | 187,069.93 | N.A. | N.A. | 5) | |
| Others | |||||
| U.S. | N.A. | 2,731,336 | N.A. | ||
| Canada | 3,628.57 | 56,097 | N.A. | 6) | |
| Tertiary industry | |||||
| N.A. | N.A. | N.A. |
G3 POPULATION IN THE CATCHMENT AREA (2, 5-10) U.S. 1970, Canada 1981
| Population | Major cities | ||
|---|---|---|---|
| Population | density [km-2] | (population) | |
| USA | 11,513,900 | N.A. | Detroit*(1,290,000), Buffalo, |
| Toledo, Cleveland, Erie | |||
| Canada | 2,335,200 | N.A. | |
| Total | 13,849,100 | 175.8 |
H. LAKE UTILIZATION
H1 LAKE UTILIZATION (Q1) Source of water, fisheries, navigation, tourism and recreation (swimming, sport-fishing, yachting).H2 THE LAKE AS WATER RESOURCE (2, 5-7) 1983
| Use rate [m3 day-1] | |||
|---|---|---|---|
| U.S. | Canada | ||
| Domestic | 4,556 | 465 | |
| Irrigation | 100 | 196 | |
| Industrial | 24.205 | 3,718 | |
| Power plant | 30,829 | 2,470 | |
| Others | |||
| Rural-stock | - | 73 | |
| Mining | 748 | - |
I. DETERIORATION OF LAKE ENVIRONMENTS AND HAZARDS
I2 TOXIC CONTAMINATION Toxic metals in suspended particles and surficial sediments (11)| Lake Erie*1 | Typical upper*2 | Typical lower*3 | ||
|---|---|---|---|---|
| Sample type | Element | Basin | Niagara River | Niagara River |
| [micro g g-1] | [micro g g-1] | [micro g g-1] | ||
| Suspended | As | - | 9.8 | 16 |
| particles | Cd | 6.6 | 8.2 | 3 |
| Cr | 53 | 160 | 80 | |
| Cu | 170 | 290 | 100 | |
| Pb | 79 | 170 | 100 | |
| Hg | 0.14 | 0.73 | 0.69 | |
| Ni | 91 | 75 | 53 | |
| Zn | 160 | 870 | 330 | |
| Surficial | As | 3.2 | 1.9 | 2.5 |
| sediments | Cd | 2.5 | 0.50 | 0.72 |
| Cr | 53 | 11 | 15 | |
| Cu | 39 | 8.5 | 8.8 | |
| Pb | 81 | 11 | 13 | |
| Hg | 0.48 | 0.09 | 19 | |
| Ni | 49 | 6 | 7.2 | |
| Zn | 177 | 100 | 63 |
- Organic chemicals in suspended particles and surficial
sediments (11)
- Mean levels of selected contaminants in herring gull eggs
from the Niagara River and nearby monitor colonies [æg (wet wt.) g-1](11)
| Colony | Contaminants | 1979 | 1981 | 1982 |
|---|---|---|---|---|
| Lake Erie | pp' DDE | 3.4 | 4.7 | 7.5 |
| PCBs | 38 | 44 | 60 | |
| Mirex | 0.25 | 0.42 | 0.60 | |
| Niagara River | pp' DDE | 4.1 | 5.7 | 3.7 |
| PCBs | 50 | 50 | 46 | |
| Mirex | 0.49 | 0.74 | 0.98 |
Lake Erie walleye [mg (wet wt.) kg-1](12) 1977-1983
| Year | PCB | pp' DDE | DDT | Dieldrin | Hg | Zn | As | Se |
|---|---|---|---|---|---|---|---|---|
| 1977 | 1.61 | 0.36 | 0.50 | 0.07 | 0.20 | 12.93 | - | 0.26 |
| 1978 | 1.47 | 0.14 | 0.26 | 0.05 | 0.15 | 12.34 | 0.22 | 0.35 |
| 1979 | 3.05 | 0.21 | 0.49 | 0.10 | 0.15 | 12.99 | 0.32 | 0.37 |
| 1980 | 1.40 | 0.19 | 0.45 | 0.04 | 0.13 | 13.76 | 0.33 | 0.33 |
| 1981 | 1.16 | 0.04 | 0.10 | 0.02 | 0.10 | 11.03 | 0.38 | 0.44 |
| 1982 | 1.62 | 0.10 | 0.24 | 0.04 | 0.12 | 13.58 | 0.31 | 0.36 |
| 1983 | 1.54 | 0.13 | 0.26 | 0.05 | - | - | - | - |
| Year | PCB | pp' DDE | sigma DT | Hg | Pb | As | Se |
|---|---|---|---|---|---|---|---|
| 1977 | 0.18 | 0.04 | 0.06 | 0.05 | tr* | - | 0.29 |
| 1978 | 0.27 | 0.04 | 0.06 | 0.05 | tr | 0.15 | 0.36 |
| 1979 | 0.38 | 0.05 | 0.10 | 0.04 | tr | 0.23 | 0.31 |
| 1980 | 0.26 | 0.06 | 0.12 | tr | 0.21 | 0.16 | 0.37 |
| 1981 | 0.23 | 0.03 | 0.06 | 0.04 | tr | 0.23 | 0.35 |
| 1982 | 0.30 | 0.03 | 0.07 | 0.03 | tr | 0.26 | 0.35 |
| 1983 | 0.32 | 0.02 | 0.04 | - | - | - | - |
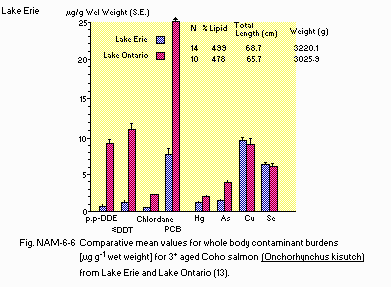
(13) Comparative mean values for whole body contaminant burdens [micro g(wet wt.) g-1] for 3+ aged Coho salmon (Onchorhynchus kisutch) from Lake Erie and Lake Ontario.
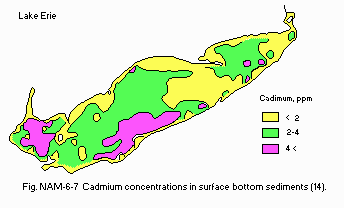
(14) Cadmium concentrations in surface bottom sediments.
Supplementary notes Toxic contamination hazards included the input of toxic inorganic and organic chemicals from municipal point sources, combined sewer overflows, rural and urban nonpoint sources and leachates from municipal and hazardous waste landfill disposal sites. Problems from these sources are most apparent in highly industrialized harbors and embayments and nearby areas.
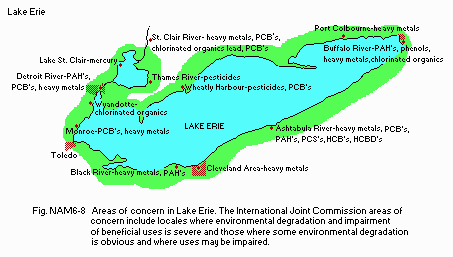
Areas of concern in Lake Erie. The International Joint Commission areas of concern include locales where environmental degradation and impairment of beneficial uses is severe and those where some environmental degradation is obvious and where uses may be impaired.
I3 EUTROPHICATION Nuisance caused by eutrophication (Q1) Unusual bloom of blue-green algae (Aphanizomenon, Anabaena). Nitrogen and phosphorus loadings to the lake [t yr-1](9, 10) T-N: 1967-1976, T-P: 1976
| Sources | Industrial | Domestic | Agri- | Natural | Total |
|---|---|---|---|---|---|
| cultural | |||||
| T-N | N.A. | N.A. | N.A. | N.A. | 193,000-292,000 |
| T-P | 347 | 6,828 | 8,445 | 774 | 17,474* |
J. WASTEWATER TREATMENTS (Q1)
GENERATION OF POLLUTANTS IN THE CATCHMENT AREA: (f) Severe pollution with well-developed wastewater treatment. J3 SANITARY FACILITIES AND SEWERAGE Municipal and industrial wastewater treatment systems Number of secondary and tertiary treatment (activated sludge, trickling filter, oxidation pond) systems: 135 (U.S. 102, Canada 33; rate of treatment 10,370,000 m3 day-1).M. LEGISLATIVE AND INSTITUTIONAL MEASURES FOR UPGRADING LAKE ENVIRONMENTS (Q1)
M1 NATIONAL AND LOCAL LAWS CONCERNED Names of the laws (the year of legislation)- Canada: Canada Water Act, Fisheries Act; Ontario Water Resources Commission Act, Ontario Environment Protection Act; Environmental Contaminants Act.
- U.S.: National Environmental Policy Act, Clean Water Act, Clean Air Act; Water Resources Planning Act, Federal Water Pollution Control Act, Toxic Substances Control Act.
- Canada/U.S.: Boundary Waters Treaty (1909); Great Lakes Water Quality Agreement (1972 and 1978). Responsible authorities
- Canada: Governments of Canada and the Province of Ontario.
- U.S.: Governments of USA and the States of Michigan, Ohio, Pennsylvania and New York.
- Canada/U.S.: International Joint Commission; Great Lakes Fishery Commission. Main items of control
- Canada: Waste disposal, water quality, air quality and water use.
- U.S.: Waste disposal, water quality, air quality and water use.
- Canada/U.S.: Water withdrawals; advisory roles in water quality, air quality and fisheries.
N. SOURCES OF DATA
- Questionnaire filled by Drs. J. R. Vallentyne and K. Suboch, Canada Centre for Inland Waters, Burlington.
- Questionnaire filled by Prof. F. M. D'Itri, Institute of Water Research, Michigan State University, Lansing.
- Data supplied to Drs. Vallentyne and Suboch by Prof. F. D'Itri, Institute of Water Research, Michigan State University.
- International Joint Commission (1983) International Joint Commission Great Lakes Water Quality Board Report for 1983.
- Munawar, M. & I. F. (1981) A general comparison of the taxonomic composition and size analyses of the phytoplankton of the North American Great Lakes. Verh. Intern. Verein Limnol., 21: 1695-1716.
- Vollenweider, R. A., Munawar, M. & Stadelman, P. (1974) A comparative review of phytoplankton and primary production in the Laurentian Great Lakes. J. Fish. Res. Bd. Can., 31 (5): 739-792.
- Weatheson, G. L. (1983) Ontario Mineral Score, 1982. Ontario Statistics 1982. Ministry of Natural Resources, Video Census Series No.2.
- Ontario Ministry of Treasury and Economics (1983) Ontario Statistics 1982.
- International Great Lakes Diversions and Consumptive Uses Study Board (1981) Great Lakes Diversions and Consumptive Uses, Annex F, Consumptive Water Uses.
- Ontario Ministry of Natural Resources, Fisheries Branch (1983) Employment and Investment in the Commercial Fishery-1982 and Commercial Fish Industry.
- International Joint Commission. Inventory of Land Use Practices, Vol.1.
- Ontario Ministry of Agriculture and Food, Statistics Section (1982) Agricultural Statistics for Ontario, 1981.
- Allan, R. J. (1986) The Role of Particulate Matter in the Fate of Contaminants in Aquatic Ecosystems. Scientific Series No. 142. 128 pp. Inland Waters Directorate, National Water Research Institute, Canada Centre for Inland Waters, Burlington.
- Great Lakes Water Quality Board (1985) 1985 Report on Great Lakes Water Quality.
- Whittle, D. M. & Fitzsimons, J. D. (1983) J. Great Lakes Res. 9: 295- 302.
- Thomas, R. L. & Mudroch, A. (1979) Report to Small Craft Harbours, Ontario Region, December 1979. 149 pp.
