
LAKE HURON
A view from Fort Mackinac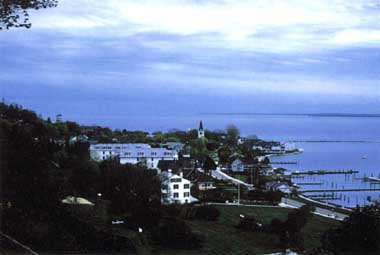
Photo: A. Kurata
A. LOCATION
Michigan, USA; and Ontario, Canada. 43:0 -46:1 N, 79:0 -84:5 W; 176 m above sea level.B. DESCRIPTION
Lake Huron is the second largest of the Great Lakes and the fifth largest in the world, with the most irregular shape of any of the Great Lakes. Even its largest island, Manitoulin, is wider than the State of Rhode Island, and has five small lakes of its own. The lake is connected with its neighbor, nearly same-sized L. Michigan, only by a narrow straight called the Straights of Mackinac, which is spanned by a 8 km-long bridge, the Mighty Mac. The shores around Mackinac offer spectacular landscape. The water quality of the lake is still excellent and oligotrophic. Transparency is generally recorded at 8 m, and chlorophyll a concentration at the lake centre is less than 2 micro l-1. However, the water in Saginaw Bay in the southern part has become considerably worse due to the nutrient loading from surrounding areas.Many long freighters and other seafacing vessels come and go on this "inland sea". In summer, recreational boating and yacht-racing are supported by many local clubs almost every day.
C. PHYSICAL DIMENSIONS (Q)
| Surface area [km2] | 59,570 |
| Volume [km3] | 3,535 |
| Maximum depth [m] | 228 |
| Mean depth [m] | 53 |
| Water level | Unregulated |
| Length of shoreline [km] | 5,088 |
| Residence time [yr] | 22.6 |
| Catchment area [km2] | 128,464* |
D. PHYSIOGRAPHIC FEATURES
D1 GEOGRAPHICAL (1, 2, 3, 4, 5) Bathymetric map: Fig. NAM-05-01. Names of main islands: Manitoulin, Dummond, St. Joseph and Cockburn. Number of outflowing rivers and channels (name): 1 (St. Claire R.).D2 CLIMATIC (4, 5, 6, 7, 8) Climatic data at Alpena, 1943-1980 Mean temp. [deg C]
| Jan | Feb | Mar | Apr | May | Jun | Jul | Aug | Sep | Oct | Nov | Dec | Ann. |
|---|---|---|---|---|---|---|---|---|---|---|---|---|
| -7.1 | -7.5 | -2.9 | 4.2 | 10.4 | 16.0 | 19.0 | 18.2 | 13.9 | 8.5 | 1.9 | -3.9 | 5.9 |
| Jan | Feb | Mar | Apr | May | Jun | Jul | Aug | Sep | Oct | Nov | Dec | Ann. |
|---|---|---|---|---|---|---|---|---|---|---|---|---|
| 46 | 38 | 49 | 58 | 73 | 78 | 69 | 75 | 79 | 64 | 60 | 49 | 739 |
Bathymetric map (Q).
Water temperature [deg C]
| Depth[m] | Jan | Feb | Mar | Apr | May | Jun | Jul | Aug | Sep | Oct | Nov | Dec |
|---|---|---|---|---|---|---|---|---|---|---|---|---|
| S* | 1 | 0 | 1 | 3 | 6 | 14 | 20 | 20 | 18 | 11 | 7 | 3 |
E. LAKE WATER QUALITY (3, 4, 5, 9, 10, 11, 12, 13)
E1 TRANSPARENCY Lake centre, 1954| Depth[m] | Jun | Jul | Aug |
|---|---|---|---|
| 12 | 14 | 13 |
Distribution of transparency [m], August 1954 (Ayers, 1956).
E2 pH Off Harbor Beach, 1974
| Depth[m] | May | Jun | Jul | Aug | Sep | Oct | Nov |
|---|---|---|---|---|---|---|---|
| S* | 8.40 | 8.45 | 8.30 | 8.55 | - | - | 8.3 |
Percent saturation of DO [%] of bottom water, 1971.
E6 CHLOROPHYLL CONCENTRATION [micro g l-1] Off Harbor Beach, 1974
| Depth[m] | Apr | May | Jun | Jul | Aug | Sep | Oct | Nov |
|---|---|---|---|---|---|---|---|---|
| S* | 2 | 2 | 2 | 0.4 | 0.6 | 1.5 | - | 0.6 |
Distribution of inorganic nitrogen. Isopleths refer to mean concentrations [micro g l-1] at 1 m depth , 1971.
E8 PHOSPHORUS CONCENTRATION: Fig. NAM-05-05.
Distribution of total phosphorus. Isopleths refer to mean concentrations [micro g l-1] at 1 m depth, 1971.
E10 PAST TRENDS The water quality of open Lake Huron and that of Saginaw Bay should be considered separately because they are distinct limnologically. The open waters of Lake Huron exhibit low concentrations of dissolved ions with a general increase occurring from north to south. Although the levels indicate a general absence of contamination, the transparency data indicate a decrease from 10 m to 7 m during the 1957-1971 period (Dobson, H. H. (1971): Nutrients in Lake Huron, Canada Centre for Inland Waters). A review of Saginaw Bay water quality data (12) indicates that high levels of nutrient loading have continued from 1956 to 1971. Concentrations of all parameters are higher than those found in the open waters of Lake Huron and are a substantial cause for the north to south increasing concentration gradient. Loadings of total dissolved solids to all of the Great Lakes, with the exception of Lake Superior, have increased significantly over the past 50 years. This has resulted in increased concentrations of nutrients, chlorides, sulphates, and numerous other ions and compounds in Lakes Michigan, Huron, Erie and Ontario.
F. BIOLOGICAL FEATURES (3, 4, 5, 11, 13, 14)
F1 FLORA Emerged macrophytes Scirpus acutus, S. americanus, Sparganium sp., Phragmites sp., Eleocharis sp. Submerged macrophytes Nitella flexilis, Chara globularis, Isoetes riparia. Phytoplankton Cyclotella comensis, C. comita, C. glomerata, Coelastrum reticulatum, Tabellaria fenestrata, Asterionella formosa.F2 FAUNA Zooplankton Protozoa (Difflugia globulosa, Codonella sp.), Cladocera (Bosmina longispina, Daphnia retrocurva), Rotifera (Polyarthra vulgarlis, Notholca longispira); Copepoda (Diaptomus ashlandi, Limnocalanus macrurus). Benthos Amphipod (Pontoporeia affinis), Oligochaeta (Limnodrilus sp., Tubifex sp., Stylodrilus sp.), Mullusca (Pisidium sp.). Fish Alosa pseudoharengus, Oncorhynchus kisutch, O. tschawytscha, Perca flavescens, Osmerus sp., Stizostedion vitreum, Salvelinus namaycush, Coregonus clupeaformis.
F3 PRIMARY PRODUCTION RATE [mg C m-3 hr-1] 1969-1970 Open water: 0.77-1.69. Saginaw Bay: 28.
Chlorophyll a [mg m-3], primary productivity [mg C m-3 hr-1], total phosphorus [mg PO4-P m-3] and Secchi disc transparency [m] in Great Lakes (16).
F5 FISHERY PRODUCTS Annual fish catch* [metric tons] 1977: 2,977.
* Commercial.
F7 NOTES ON THE REMARKABLE CHANGES OF BIOTA IN THE LAKE IN RECENT
YEARS (Q) During the past 40 years major upheavals have occurred. By
1946 sea lamprey had invaded all the Great Lakes and decimated the native
fish population, especially lake trout (Salveinus namaycush). The decline
of native fish populations created conditions favorable for the explosive
increase of alewife (Alosa pseudoharengus) which, in turn, greatly reduced
the populations of yellow perch (Perca flavescens), cisco (Coregonus sp.)
and lake herring (Coregonus artedii). Salmon species were introduced in
1964 and have effectively utilized the alewife as a food source. This has
served to both reduce the alewife populations and create a vital sport-fishing
industry. The predominance of alewife also resulted in a shift toward smaller
size zooplankton as the larger species were selectively harvested (Wells,
L. (1969): U.S. Fish Wildlife Service, Fish. Bull., 60: 343-369).
G. SOCIO-ECONOMIC CONDITIONS (3-5, 17-24)
G1 LAND USE IN THE CATCHMENT AREA 1978| Area [km2] | [%] | |
|---|---|---|
| Natural landscape | ||
| Woody vegetation | 84,447 | 66.0 |
| Herbaceous vegetation | 12,841 | 10.0 |
| Agricultural land | 28,840 | 22.0 |
| Residential area | 2,336 | 2.0 |
| Total | 128,464 | 100.0 |
G2 INDUSTRIES IN THE CATCHMENT AREA AND THE LAKE 1970
| Gross product | No. of | No. of | Main products | |
|---|---|---|---|---|
| during the | persons | establish- | or major | |
| year [mill.$] | engaged | ments | industries | |
| Primary industry | ||||
| Agriculture | 1,090.09 | 42,000 | 23,977 | Dry field |
| beans,livestock, | ||||
| sugar beet, | ||||
| hay,grains | ||||
| Fisheries | 8.72 | 325 | ||
| Whitefish | ||||
| Others | 541.69 | 1,554 | 48 | |
| Paper products | ||||
| Secondary industry | ||||
| Manufacturing | 5,336.70 | 165,433 | 1,186 | Transportation |
| equipment, | ||||
| machinery, metal | ||||
| fabrication | ||||
| Mining | 2,427.25 | 1,696 | N.A. | Sand,cement, |
| gravel, crushed | ||||
| stone | ||||
| Others | 1,472.85 | 243,524 | N.A. | Building, |
| construction | ||||
| engineering |
| Population | Major cities | ||
|---|---|---|---|
| Population | density [km-2] | (population) | |
| Total | 1,236,300 | 9.6 | Flint, Midland |
| Alpena, Saginaw |
H. LAKE UTILIZATION
H1 LAKE UTILIZATION Source of water, fisheries, navigation, tourism and recreation (swimming, sport-fishing, yachting).H2 THE LAKE AS WATER RESOURCE (U.S. only) 1975
| Use rate [m3 day-1] | |
|---|---|
| Domestic | 350,000 |
| Irrigation | 40,000 |
| Industrial | 3,080,000 |
| Power plant | 2,710,000 |
| Others | |
| Mining | 270,000 |
I. DETERIORATION OF LAKE ENVIRONMENTS AND HAZARDS
I2 TOXIC CONTAMINATION Mean contaminant concentrations in whole fish samples of Lake Huron rainbow smelt [mg (wet wt.) kg-1](25) 1979-1983| Year | PCB | pp'DDE | sigma DT | Ag | As | Se |
|---|---|---|---|---|---|---|
| 1979 | 0.19 | 0.05 | 0.07 | 0.06 | 0.27 | 0.64 |
| 1980 | 0.11 | 0.05 | 0.07 | 0.07 | 0.26 | 0.69 |
| 1981 | 0.13 | 0.07 | 0.10 | 0.06 | 0.31 | 0.68 |
| 1982 | 0.29 | 0.08 | 0.12 | 0.05 | 0.36 | 0.54 |
| 1983 | 0.18 | 0.07 | 0.10 | - | - | - |
| Year | PCB | pp'DDE | DDT | Ag | As | Se |
|---|---|---|---|---|---|---|
| 1979 | 0.78 | 0.15 | 0.20 | 0.16 | 0.15 | 0.70 |
| 1980 | 0.42 | 0.22 | 0.25 | 0.18 | 0.18 | 0.75 |
| 1981 | 2.26 | 0.60 | 1.06 | 0.24 | 0.43 | 0.48 |
| 1982 | 2.44 | 0.48 | 0.73 | 0.19 | 0.43 | 0.62 |
| 1983 | 1.24 | 0.39 | 0.68 | - | - | - |
(26) Distribution of cadmium concentrations in surface bottom sediments.
(27) Distribution of quartz-corrected PCBs in surface bottom sediments.
Supplementary notes (Q) Toxic contamination hazards included the input
of toxic inorganic and organic chemicals from municipal point sources,
combined sewer overflows, rural and urban nonpoint sources and leachates
from municipal and hazardous waste landfill disposal sites. Problems from
these sources are most apparent in highly industrialized harbors and embayments
and nearby areas.
I3 EUTROPHICATION (Q) Nitrogen and phosphorus loadings to the
lake [t yr-1] 1976
| Sources | Industrial | Domestic | Agricultural | Natural | Total |
|---|---|---|---|---|---|
| T-N | N.A. | N.A. | N.A. | N.A. | 24,700 |
| T-P | 122 | 515 | 2,442 | 1,129 | 4,857* |
Areas of concern in Lake Huron. The International Joint Commission areas of concern include locales where environmental degradation and impairment of beneficial uses is severe and those where some environmental degradation is obvious and where uses may be impaired.
J. WASTEWATER TREATMENTS (Q)
J1 GENERATION OF POLLUTANTS IN THE CATCHMENT AREA- f) Measurable pollution with well-developed wastewater treatment.
K. IMPROVEMENT WORKS IN THE LAKE (Q)
Beginning in 1970, a multi-billion dollar remedial program was undertaken by the United States and Canada under the supervision of the International Joint Commission.M. LEGISLATIVE AND INSTITUTIONAL MEASURES FOR UPGRADING LAKE ENVIRONMENTS (Q)
M1 NATIONAL AND LOCAL LAWS CONCERNED Names of the laws (the year of legislation) A large number of Federal and State Laws, Policies and Industrial Agreements (see Lake Erie). Responsible authorities United States and Canadian Federal Governments, State of Michigan and Province of Ontario, local governments. Main items of control- Water quality and waste disposal, water use and withdrawal, fishing rights, navigation, flood and erosion control
N. SOURCES OF DATA
- Questionnaire was filled by Prof. F. M. D'Itri, Institute of Water Research, Michigan State University, Lansing, based on the data obtained from the following sources (1-27).
- Hough, J. L. (1958) Geology of the Great Lakes. University of Illinois Press, Urbana, Illinois.
- Pincus, H. J. (1962) Great Lakes Basin. American Association for the Advancement of Science, Washington, D. C.
- Great Lakes Basin Commission Public Information Office (1974) Great Lakes Basin Frame work Study. Ann Arbor, Michigan.
- Great Lakes Fishery Commission (1980) Annual Report. Ann Arbor, Michigan.
- Great Lakes Fisheries Commission (1978) Commercial Fish Production in the Great Lakes, 1967-1977. Technical Report 3. Ann Arbor, Michigan.
- National Oceanic and Atmospheric Administration, National Environmental Satellite, Data and Information Service, National Climatic Data Centre. Department of Commerce, Asheville, North Carolina.
- Solar Energy Research Institute. Solar Energy Information Data Book, Insolation Data Manual. Golden, Colorado.
- National Oceanic and Atmospheric Administration Environmental Data Service. U.S. Department of Commerce, Local Climatological Data.
- Great Lakes Water Quality Board, International Joint Commission; United States and Canada Great Lakes Regional Office (1973) Great Lakes Water Quality Annual Report to the International Joint Commission. Windsor, Ontario.
- International Joint Commission; United States and Canada Great Lakes Regional Office (1980) Great Lakes Water Quality, 7th Annual Report. Windsor, Ontario.
- United States Environmental Protection Agency. Limnological Conditions in Southern Lake Huron, 1974 and 1975. Publication No. EPA-600/3-80-074. Duluth, Minnesota.
- Great Lakes Research Division, Institute of Science and Technology, University of Michigan (1973) Limnological Survey of Lakes Michigan, Superior, Huron and Erie. Publication No. 17. The University of Michigan, Ann Arbor, Michigan.
- Great Lakes Research Division, Institute of Science and Technology, University of Michigan (1972) Phytoplankton and Physical-Chemical Conditions in Selected Rivers and the Coastal Zone of Lake Michigan, 1972. Publication No. 19. The University of Michigan, Ann Arbor, Michigan.
- Sommers, L. M. (1982) Fish in Lake Michigan. Michigan Sea Grant, University of Michigan, Ann Arbor, Michigan.
- Interagency Committee on Marine Science and Engineering, Federal Council for Science and Technology, Argonne National Laboratory (1975) Proceedings of the Second Federal Conference on the Great Lakes.
- Weathesen, G. L. (1983) Ontario Mineral Score, 1982. Ontario Ministry of Natural Resources, Video Census Series No. 2.
- International Joint Commission; United States and Canada Great Lakes Regional Office (1978) Environmental Management Strategy for the Great Lakes System. Windsor, Ontario.
- International Great Lakes Diversions and Consumptive Uses Study Board (1981) Great Lakes Diversions and Consumptive Uses, Annex F: Consumptive Water Uses.
- International Joint Commission (1978) Inventory of Land Use and Land Use Practices, 1, Canadian Great Lakes Basin Summary.
- Ontario Ministry of Agriculture and Food, Statistics Section (1982) Agricultural Statistics for Ontario, 1981.
- Ontario Ministry of Treasury and Economics. Ontario Statistics, 1982.
- Ontario Ministry of Natural Resources, Fisheries Branch. Employment and Investment in the Commercial Fishery, 1982 and Commercial Fish Industry.
- International Joint Commission; United States and Canada Great Lakes Regional Office (1980) Pollution in the Great Lakes Basin from Land Use Activities. Windsor, Ontario.
- International Joint Commission; United States and Canada Great Lakes Regional Office (1978) Great Lakes Water Quality Agreement. Windsor, Ontario.
- Great Lakes Water Quality Board (1985) 1985 Report on Great Lakes Water Quality.
- Thomas. R. L. & Mudroch, A. (1979) Report to Small Craft Harbours, Ontario Region, December 1979. 149 pp.
- Frank, R., Thomas, R. L., Kemp, A. W. L., Broun, H. E. & Dawson, R. (1979) J. Great Lakes Res., 5: 131-138.
