
LAKE SUPERIOR
A view from the lakeside hill at Duluth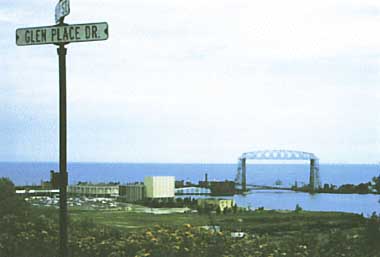
Photo: A. Kurata
A. LOCATION
Michigan, Wisconsin and Minnesota, USA; and Ontario, Canada. 46:5-48:0N, 84:0-92:5W; 183 m above sea level.B. DESCRIPTION
Lake Superior is the second largest lake in the world next to the Caspian Sea, and has more surface area than any other freshwater lake. Its surface area (82,367 km2) is larger than the State of Maine. The lake was formed approximately 14,000 years ago by the retreat of continental ice-sheet together with the other Great Lakes. It is surrounded by hills and cliffs which offer the most spectacular landscape of any of the Great Lakes. The largest island, Isle Royale, is a United States National Park.The Apostle Islands of Wisconsin are now a National Lakeshore, with beautiful scenery and geological features. The long, hooked arm of the beautiful Keweenaw Peninsula is also a National Lakeshore of Michigan. The lake water flows out to L. Huron through the St. Mary's River from the eastern end.
There are no large cities along the Canadian northern shore of this lake except for Thunder Bay, Ontario. Twin cities, Duluth and Superior, are situated at the western end of the lake. A large amount of ore and grain is loaded for transport abroad in the harbors of these cities. The 1,900 km journey from Duluth, Minnesota, to Kingston, Ontario, is the longest inland water transportation route in the world. The lake water is still oligotrophic and transparency at the centre of the lake is generally around 9m.
C. PHYSICAL DIMENSIONS (1, 2, 3)
| Surface area [km2] | 82,367 |
| Volume [km3] | 12,221 |
| Maximum depth [m] | 406 |
| Mean depth [m] | 148 |
| Water level | Regulated |
| Normal range of annual water | |
| level fluctuation [m]* | 0.3 |
| Length of shoreline [km] | 4,768 |
| Residence time [yr] | 191 |
| Catchment area [km2] | 124,838 |
D. PHYSIOGRAPHIC FEATURES
D1 GEOGRAPHICAL (Q, 1, 2, 3, 4, 5, 6, 9) Bathymetric map: Fig. NAM-04-01. Names of main islands: Royale (544 km2) and Grand (36.4 km2). Number of outflowing rivers and channels (name): 1 (St. Mary's R.).D2 CLIMATIC (Q, 4, 5, 6, 7, 8) Climatic data at Marquette, 1943-1980 Mean temp. [deg C]
| Jan | Feb | Mar | Apr | May | Jun | Jul | Aug | Sep | Oct | Nov | Dec | Ann. |
|---|---|---|---|---|---|---|---|---|---|---|---|---|
| -8.3 | -7.9 | -3.3 | 3.7 | 9.6 | 15.2 | 18.8 | 18.0 | 14.0 | 8.4 | 0.8 | -0.5 | 5.3 |
| Jan | Feb | Mar | Apr | May | Jun | Jul | Aug | Sep | Oct | Nov | Dec | Ann. |
|---|---|---|---|---|---|---|---|---|---|---|---|---|
| 52 | 43 | 52 | 62 | 74 | 87 | 77 | 71 | 89 | 70 | 72 | 58 | 808 |
Bathymetric map (Q).
Water temperature [deg C] Marquette, 1937-1969
| Depth[m] Jan | Feb | Mar | Apr | May | Jun | Jul | Aug | Sep | Oct | Nov | Dec | |
|---|---|---|---|---|---|---|---|---|---|---|---|---|
| 0 | 0 | 1 | 1 | 2 | 4 | 7 | 12 | 12 | 9 | 6 | 3 |
E. LAKE WATER QUALITY (Q, 3, 4, 5, 12, 13, 14, 15, 23, 30)
E1 TRANSPARENCY [m] Nearshore, 1973*: 8.5 (0.5-15). Back Bay: 2.3. * Summer and fall.
Areal distribution of Secchi disc readings in nearshore waters.
E2 pH Surface water Spring 1974: 7.4-8.0. Fall 1974: 7.6-7.9. 1975: 7.6-7.8.
pH of surface water, 1969.
E3 SS Suspended solids were virtually absent in Lake Superior
waters, except in the harbor areas. The lower transparency in Black Bay
and Batchawana Bay was attributed to the natural re-suspension of bottom
sediments by wave action and the low transparency in Thunder Bay and Nipigon
Bay was to urban and industrial sources of suspended solids.
E4 DO [mg l-1] Surface water Spring 1974: - (10.1-13.2). Fall
1974: - (8.5-10.9). 1975: 12.4E.6 (11.2-13.2).
DO [% saturation] in bottom water, 1971.
E6 CHLOROPHYLL CONCENTRATION [micro g l-1] Nearshore: 0.8 (2<)*. Embayment areas: (0.4-3.8). * Rarely exceeded.
Mean concentrations of chlorophyll-a [micro g l-1], 1970-1971.
E7 NITROGEN CONCENTRATION: Fig. NAM-04-06.
Mean concentrations of inorganic-N [micro g l-1] at 5 m depth, 1971.
E8 PHOSPHORUS CONCENTRATION Total-P: Fig. NAM-04-07.
Mean concentrations of total-P [micro g l-1] at 5 m depth, 1971.
E9 CHLORIDE CONCENTRATION [mg l-1] 1963: 1.9. 1974: 0.9-1.4. 1975: 1.1-2.3.
F. BIOLOGICAL FEATURES (Q, 3, 4, 5, 12, 13, 14, 15, 24, 30, 41, 32, 33, 34, 35, 36)
F1 FLORA Emerged macrophytes Scirpus acutus, S. americanus, Sparganium sp., Phragmites sp., Eleocharis sp. Submerged macrophytes: Nitella flexilis, Chara globularis, Isoetes riparia. Phytoplankton Cyclotella comensis, C. comita, C. glomerata, Coelastrum reticulatum, Tabellaria fenestrata, Asterionella formosa.F2 FAUNA Zooplankton Protozoa (Difflugia globulosa, Codonella sp.), Cladocera (Bosmina longispina, Daphnia retrocurva), Rotifera (Polyarthra vulgaris, Notholca longispira), Copepoda (Diaptomus ashlandi, Limnocalanus macrurus). Benthos Amphipoda (Pontopooreia affinis), Oligochaeta (Limnodrilus sp., Tubifex sp., Stylodrilus sp.), Mollusca (Pisidium sp.). Fish Alosa pseudoharengus, Oncorhynchus kisutch, O. tschawytscha, Perca flavescens, Osmerus sp., Stizostedion vitreum, Salvelinus namayucush, Coregonus clupeaformis. Supplementary notes on the biota Phytoplankton assemblages originally dominated by diatoms have been altered dramatically, first from oligotrophic diatoms to more eutrophic diatoms and more recently, from diatom dominated assemblages to phytoplankton assemblages with increasing proportions of blue-green and green algae has occurred (Conway et al., 1977; Schelske et al., 1976; Stoermer et al., 1974; Schelske and Stoermer, 1971). Phytoplankton growth is phosphorus limited and increased inputs of this nutrient have stimulated growth of diatoms to the extent that, in summer, silica becomes the limiting nutrient. The result is that the phytoplankton assemblages are shifting from diatoms to physiological forms of phytoplankton which do not require silica (Schelske and Stoermer, 1972).
F3 PRIMARY PRODUCTION RATE Carbon fixation rates [mg C m-3 day-1] 1973 Open water: 0.37 EO.18. Bays: 0.59 E0.14. Photosynthetic assimilation ratios [mp C hr-1 mg chl-a] Open water: 0.82 E0.45.
Chlorophyll a [micro g l-1], primary productivity [micro g C l-1 hr-1], total phosphorus [micro g PO4-P l-1] and Secchi disc transparency [m] in the Great Lakes.
F4 BIOMASS: Fig. NAM-04-09.
Nearshore phytoplankton standing crop, 1974.
F5 FISHERY PRODUCTS Annual fish catch [metric tons] 1977: 4,184.
G. SOCIO-ECONOMIC CONDITIONS (Q, 3, 5, 10, 11, 16-22, 27)
G1 LAND USE IN THE CATCHMENT AREA| Area [km2] | [%] | |
|---|---|---|
| Natural landscape | ||
| Woody vegetation | 117,970 | 95.0 |
| Herbaceous vegetation | 4,963 | 4.0 |
| Agricultural land | 1,740 | 1.0 |
| Residential area | 165 | 1.0 |
| Total | 124,838 | 100.0 |
G2 INDUSTRIES IN THE CATCHMENT AREA AND THE LAKE (U.S. only)
| Gross product | No. of | No. of | Main products | ||
|---|---|---|---|---|---|
| per year | persons | establish- | or major | ||
| [mill.$] | engaged | ments | industries | ||
| Primary industry | |||||
| Agriculture | 32.40 | 10,900 | 7,194 | Livestock, hay, | |
| forest products | |||||
| Fisheries | 2.06 | 173 | N.A. | Lake herring | |
| Others | 2,321.55 | 6,660 | 203 | Paper products | |
| Secondary industry | |||||
| Manufacturing | 982.50 | 25,485 | N.A. | Machinery, paper | |
| products, | |||||
| printing, publishing | |||||
| Mining | 624.73 | 17,044 | N.A. | ||
| Others | 254.40 | 125,488 | N.A. |
G3 POPULATION IN THE CATCHMENT AREA (U.S. only) 1970
| Population | Major cities | ||
|---|---|---|---|
| Population | density [km-2] | (population) | |
| Total | 533.500 | 4.3 | Duluth, Marquette, Superior |
H. LAKE UTILIZATION (Q)
H1 LAKE UTILIZATION Source of water, fisheries, tourism, recreation (swimming, yachting, sport- fishing) and navigation. H2 THE LAKE AS WATER RESOURCE* 1975| Use rate [m3 day-1] | |
|---|---|
| Domestic | 150,000 |
| Irrigation | 8,700 |
| Industrial | 1,080,000 |
| Power plant | 2,110,000 |
| Others | |
| Mining | 830,000 |
I. DETERIORATION OF LAKE ENVIRONMENTS AND HAZARDS
I1 ENHANCED SILTATION (Q) Extent of damage: Not serious. Supplementary notes Local siltation in Duluth/Superior harbor and in Thunder Bay from mining. High water levels (1987) have led to increased siltation in some shoreline areas due to shore erosion. Presently, the problem is not serious, because the area is very lightly farmed and there is little open area; however, it could become serious if not controlled.I2 TOXIC CONTAMINATION Present status (Q): Detected but not serious. Past trends of decrease of contaminants in various fish [ppm (wet wt.) basis](25).
| Names of | Fish* | Degree of decrease [ppm] | |
|---|---|---|---|
| contaminants | |||
| DDT | Lake trout* | 1.2 (1977) | <0.4 (1982) |
| PCB | Lake trout | 1.8 (1980) | 0.4 (1982) |
| Dieldrin | Lake trout | 0.5 |
Total DDT residues in Lake Superior lake trout.
Total PCB residues in Lake Superior lake trout.
Dieldrin residues in Lake Superior lake trout.
Mercury residues in Lake Superior lake trout.
Distribution of contaminants in the lake sediments [ppb (dry wt.) basis] (26, 27)
| Names of | Range | Average |
|---|---|---|
| contaminants | ||
| DDT | <1.0-3.0 < | 0.71 |
| PCB | <5-10 < | 3.3 |
| Dieldrin | - | <0.25 |
| Hg | <50-500 | - |
| Pb | <50,000,100,000-150,000 | - |
| Content in dry sediments (ng g-1)*1 | |||||||
|---|---|---|---|---|---|---|---|
| p,p'-DDE | HEOD*2 | PCB | |||||
| Locations | No. | Mean | SD | Mean | SD | Mean | SD |
| All basins | 216 | 1.1 | 1.9 | 0.25 | 0.18 | 4.8 | 5.5 |
| Non-depositional zone | 189 | 0.4 | 0.6 | <0.25 | - | 3.9 | 2.1 |
| Duluth sub-basin | 27 | 1.9 | 1.6 | <0.25 | - | 8.6 | 13.7 |
| Chefswet sub-basin | 27 | 0.7 | 0.8 | <0.25 | - | 3.3 | 1.3 |
| Apostle sub-basin | 13 | 0.6 | 0.7 | 0.25 | 0.19 | 5.0 | 2.2 |
| Thunder Bay Trough | 17 | 2.7 | 5.5 | 0.27 | 0.17 | 5.5 | 2.9 |
| Isle Royale sub-basin | 50 | 0.8 | 0.7 | 0.25 | 0.15 | 4.5 | 2.2 |
| Thunder Bay | 5 | 1.2 | 1.3 | 0.26 | 0.13 | 5.7 | 3.6 |
| Marathon basin | 6 | 0.7 | 0.3 | 0.32 | 0.18 | 6.4 | 7.3 |
| Keweenaw basin | 4 | 0.8 | 0.7 | <0.25 | - | 3.1 | 1.3 |
| Caribou sub-basin | 49 | 0.8 | 1.0 | 0.27 | 0.28 | 3.7 | 1.6 |
| Whitefish sub-basin | 18 | 0.9 | 1.2 | 0.28 | 0.16 | 4.4 | 3.0 |
(38) PCB concentrations in surface sediments (3 cm).
Food safety standards or tolerance limits for toxic contaminant residue (Q) Regulatory limitations are set by the U.S. Food and Drug Administration and Canada Dept. of National Health and Welfare and are advisories only with regard to human consumption of fish. The U.S. standards are: PCB 2 mg kg-1 DDT 5 mg kg-1, Dieldrin 3 mg kg-1 and mercury 1 mg kg-1 (Federal limit) and 0.5 mg kg-1 (State limit).
| Restrict consumption | Do not eat | |
|---|---|---|
| Important* | ||
| Lake Superior (applies to | ||
| Michigan, Wisconsin and | Lake Trout up to 30" | Lake Trout over 30" |
| Minnesota waters) |
| Metal | Total deposition |
|---|---|
| Zn | 8,210 |
| Pb | 1,230 |
| Cu | 821 |
| Cd | 82 |
| Ni | 328 |
| Fe | 8,210 |
| Al | 14,000 |
| Mn | 1,640 |
| Substance | Total deposition |
|---|---|
| Total PCB | 9.8 |
| Total DDT | .58 |
| alfa-BHC | 3.3 |
| ganmma-BHC | 15.9 |
| Dieldrin | .54 |
| HCB | 1.7 |
| p,p'-methoxychlor | 8.3 |
| apfa-endosulfan | 7.9 |
| beta-endosulfan | 8.0 |
| Total PAH | 163 |
| Anthracene | 4.8 |
| Phenanthrene | 4.8 |
| Pyrene | 8.3 |
| Benzo (a) anthracene | 4.1 |
| Perylene | 4.8 |
| Benzo (a) pyrene | 7.9 |
| DBP | 16 |
| DEHP | 16 |
| Total organic carbon | 200,000 |
Areas of concern in Lake Superior.
I3 EUTROPHICATION Nuisance caused by eutrophication (Q) Others:
Not a significant problem except in urban areas, bays and river mouth.
I4 ACIDIFICATION Extent of damage (Q): No information. Kinds
of damage (Q ) Evidence of damage to Lake Superior from acidic deposition
is not discernable at this time. Supplementary notes (Q) Data relating
the amount of airborne acid deposition and stream effect are highly variable
depending on the total stream alkalinity. For very soft water streams in
the Upper Peninsula of Michigan (i.e., alkalinity less than 10 mg l-1 as
CaCO3), pH decreases of 1 to 2 units (from stream pH values of 7 or 8 to
6 or 7) have been observed in the headwaters area. To date, no studies
have demonstrated detectable ecosystem trends which can be totally ascribed
to acidification. The effects of increased acidic deposition, especially
over terrestrial watershed with little alkaline character, may be more
discernable. Mean monthly value of pH (Washington Creek, Isle Royale National
Park, 1967- 1980)(58).
| Month | |||||||
|---|---|---|---|---|---|---|---|
| O | F | M | M | J | J | A | S |
| 7.28 | 7.47 | 7.41 | 7.20 | 7.33 | 7.57 | 7.38 | 7.19 |
J. WASTEWATER TREATMENTS
J1 GENERATION OF POLLUTANTS IN THE CATCHMENT AREA- c) Limited pollution with wastewater treatment. d) Measurable pollution
with limited wastewater treatment. Situation differs locally.
| P [metric tons yr-1] | ||||
|---|---|---|---|---|
| Sources | Canada | U.S. | Total | [%] |
| Direct municipal sewage treatment plants | 29 | 39 | 68 | [2] |
| Tributary municipal sewage treatment | 38 | 162 | 200 | [5] |
| Plants | ||||
| Direct industrial | 102 | 0 | 102 | [2] |
| Tributary industrial | 0 | 33 | 33 | [ <1] |
| Urban nonpoint direct | 16 | 16 | [ <1] | |
| Tributary diffuse | 1,453 | 769 | 2,222 | [53] |
| (Tributary total) | (1,491) | (964) | (2,455) | |
| Sub-total | 1,638 | 1,003 | 2.641 | [63] |
| Atmospheric | - | - | 1,566 | [37] |
| Load from upstream lake | - | - | - | |
| Total | 4.207 | [100] | ||
| Shoreline erosion | 0 | 3,781 | 3,781 | |
| (not included in total) |
K. IMPROVEMENT WORKS IN THE LAKE (Q)
None.L. DEVELOPMENT PLANS (Q)
On the southern shore of Lake Superior, some limited development planning has occurred with respect to increased recreational use (second homes, tourism) by the states' Sea Grant Programs and the Coastal Management Program of NOAA. The Coastal Management Program has been especially concerned since 1982 with high water levels.M. LEGISLATIVE AND INSTITUTIONAL MEASURES FOR UPGRADING LAKE ENVIRONMENTS (Q)
M1 NATIONAL AND LOCAL LAWS CONCERNED Names of the laws (the year of legislation)- Rivers and Harbors Acts of 1899 and 1909 (33 USC 401 et seq.)
- Flood Control Acts of 1917, 1936 and 1944
- Safe Drinking Water Act
- State legislation implementing and augmenting federal laws
- Federal Water Pollution Control (Clean Water) Act of 1972 (PL 92-500) and Amendments of 1977 and 1987 (33 USC 125 et seq.)
- Boundary Water Treaty of 1909 between United State and Canada
- 1972 and 1978 United States-Canada Agreements on Great Lakes Water Quality
- Canada Shipping Act (Section XX)
- Canada Navigable Water Protection Act
- Canada Waters Act
- Canada Environmental Contaminants Act
- Canada Fisheries Act (Section XXXIII)
- Canada Pesticide Registration Act
- Ontario Water Resources Act (1982)
- Ontario Environmental Protection Act (amended 1983)
- Ontario Pesticide Act (1974 as amended) Responsible authorities
- Corps of Engineers of the U.S. Army
- Corps of Engineers of the U.S. Army
- State Agencies for Environment and Natural Resources
- U.S. Environmental Protection Agency
- U.S. Environmental Protection Agency
- International Joint Commission
- International Joint Commission
- Canadian Ministry of Transport
- Canadian Ministry of Transport
- Environment Canada
- Environment Canada
- Environment Canada
- Environment Canada and Agriculture Canada
- Ontario Ministry of the Environment
- Ontario Ministry of the Environment
- Ontario Ministry of the Environment Main items of control
- Discharges, dredging and filling
- Flood control
- Drinking water-including standards
- The entire range of water related problems
- Water pollution
- Quality of Great Lakes water relative to nutrients
- Quality of Great Lakes water relative to toxic chemicals
- All contaminants
- All contaminants l0) Nutrients
- Toxic organic and inorganic chemicals
- Substances injurious to fish
- Pesticides
- All contaminants
- All contaminants
- Pesticides, herbicides and slimicides Supplementary notes Other U.S. laws which indirectly relate to preserving the water quality of the Great Lakes include the 1976 Resource Conservation and Recovery Acts (RCRA), the 1976 Toxic Substances Control Act (TSCA) and the Comprehensive Environmental Response, Compensation, and Liability Act of 1980 as amended 1987 (CERCLA or Superfund).
- Great Lakes Fishery Commission (International) was established in 1960 to formulate, coordinate and implement fisheries research programs related to the Great Lakes; MI.
- International Joint Commission (International) was established in 1909 to investigate pollution in the boundary waters of the United States and Canada; Windsor, Ontario.
- United States Environmental Protection Agency was established in 1972 to protect the nation's atmospheric, terrestrial and aquatic environments and enforce legislation enacted to protect them; Chicago, IL.
- The United States Army Corps of Engineers (U.S., Federal) is concerned with all aspects of water resources as they relate to present and future needs of navigation, flood control, power, water supply, irrigation, beach erosion, dredging and recreational activities; Chicago, IL.
- The United States Bureau of Commercial Fisheries (U.S., Federal) is concerned with maintaining viable and expanding fisheries in the Great Lakes. In this regard, it conducts a broad research program on parasite (lamprey) control, effects of exploitation on the Great Lakes Fishery and establishing the relationship between limnological conditions and the general biology of commercial fish species.
- The United States Public Health Service (U.S., Federal) is concerned with monitoring food and water supplies as they relate to human health. One of their primary functions is to develop and maintain an inventory of the sources and nature of pollutants entering each lake relative to the population and industry of the region; Washington, DC.
- U.S. Department of Agriculture (U.S., Federal) is concerned with developing programs and research to minimize nonpoint pollution from agriculture (pesticides, nutrients, and erosion) as it relates to protecting the water quality of the Great Lakes.
- U.S. Department of Commerce (U.S., Federal) has Great Lakes research and monitoring programs administered under its National Oceanic and Atmospheric Administration (NOAA).
- U.S. Department of the Interior (U.S., Federal) under its U.S. Geological Survey, sponsors research and education programs through the State Water Resources Institute program.
- Great Lakes Commission (an interstate Compact Commission) was established in 1955 by the eight states bordering the Great Lakes to provide communication, coordination and advocacy on Lakes issues. The Commission deals with environmental quality, resources management, transportation and economic development; Ann Arbor, MI.
- The State Departments of Natural Resources (U.S., State). Each state in the United States has a Department of Natural Resources or equivalent department which is responsible for monitoring the state's natural resources and enforcing legislation enacted to protect them.
- The State Departments of Public Health (U.S., State). Each state in the United States has a Department of Public Health or equivalent department, which is responsible for monitoring food and water supplies as they relate to human health.
- Environment Canada (Canada, Federal). Primary concerns are related to the protection of the atmospheric, terrestrial and aquatic environments; Toronto, Ontario.
- Department of Fisheries and Oceans (Canada, Federal). Primary function is to protect the water quality of freshwater and marine environments as fish habitats; Burlington, Ontario.
- Health and Welfare Canada (Canada, Federal). Primary function is to monitor food (fish) taken from the Great Lakes as it relates to human health; Ottawa, Ontario.
- Agriculture Canada (Canada, Federal) is responsible for developing programs and research to minimize nonpoint pollution from agriculture (pesticides, nutrients and erosion) as it relates to protecting the water quality of the Great Lakes; Ottawa, Ontario.
- Ministry of Agriculture and Food (Canada, Provincial). Primary function is to monitor food (fish) taken from the Great Lakes as it relates to human health; Toronto, Ontario.
- The Ontario Ministry of the Environment (Canada, Provincial) is responsible for monitoring the water quality of lakes, streams, groundwater and drinking water and to enforce abatement activities around industrial and municipal facilities; Toronto, Ontario.
- Ontario Ministry of Natural Resources (Canada, Provincial). Primary function is to protect the environmental quality of forests and lakes as related to fisheries and wildlife habitat; Toronto, Ontario.
- Institute of Environmental Studies, University of Toronto, Toronto, Ontario; Emphasis: monitoring and research.
- Lakehead University, Thunder Bay, Ontario; Emphasis: fish toxicity studies as related to Lake Superior.
- Great Lakes Institute, University of Windsor, Windsor, Canada; Emphasis: Great Lakes monitoring and research.
- Great Lakes Research Division, University of Michigan, Ann Arbor, Michigan; Emphasis: monitoring and research.
- University of Minnesota Limnological Research Centre, University of Minnesota, St. Paul, Minnesota; Emphasis: monitoring and research. Supplementary notes Private organizations concerned with the well-being of the Great Lakes.
- Centre for the Great Lakes, Chicago, IL
- Great Lakes Tomorrow, Toronto, Ontario
- Great Lakes United, Buffalo, NY
- Operation Clean Niagara, Niagara-on-the-Lake, Ontario
- Pollution Probe, Toronto, Ontario
N. SOURCES OF DATA
- Questionnaire filled by Prof. F. M. D'Itri, Institute of Water Research, Michigan State University based on the following sources.
- Hough, J. L. (1958) Geology of the Great Lakes. University of Illinois Press, Urbana, Illinois.
- Pincus, H. J. (1962) Great Lakes Basin. American Association for the Advancement of Science, Washington, D. C.
- Great Lakes Basin Commission Public Information Office (1974) Great Lakes Basin Framework Study. Ann Arbor, Michigan.
- Great Lakes Fishery Commission (1980) Annual Report. Ann Arbor, Michigan.
- Great Lakes Fisheries Commission (1978) Commercial Fish Production in the Great Lakes 1868-1977. Technical Report 3. Ann Arbor, Michigan.
- National Oceanic and Atmospheric Administration, National Environmental Satellite, Data and Information Service, National Climatic Data Centre. Department of Commerce. Ashville, North Carolina.
- Solar Energy Research Institute. Solar Energy Information Data Book, Insolation Data Manual. Golden, Colorado.
- National Oceanic and Atmospheric Administration Environmental Data Service, U.S. Department of Commerce. Local Climatological Data.
- Great Lakes Water Quality Board, International Joint Commission, United States and Canada Great Lakes Regional Office (1973) Great Lakes Water Quality Annual Report to the International Joint Commission. Windsor, Ontario.
- International Joint Commission, United States and Canada Great Lakes Regional Office (1980) Great Lakes Water Quality, 7th Annual Report. Windsor, Ontario.
- International Joint Commission (1978) Inventory of Land Use and Land Use Practices, 1, Canadian Great Lakes Basin Summary.
- Great Lakes Research Division, Institute of Science and Technology, University of Michigan (1972) Phytoplankton and Physical-Chemical Conditions in Selected Rivers and the Coastal Zone of Lake Michigan, 1972. Publication No.19. The University of Michigan, Ann Arbor.
- Sommers, L. M. (1982) Fish in Lake Michigan. Michigan Sea Grant, University of Michigan, Ann Arbor, Michigan.
- United States Environmental Protection Agency. Limnological Condition in Southern Lake Huron, 1974 and 1975.
- Interagency Committee on Marine Science and Engineering, Federal Council for Science and Technology, Argonne National Laboratory (1975) Proceedings of the Second Federal Conference on the Great Lakes.
- Weathesen, G. L. (1983) Ontario Mineral Score, 1982. Ontario Ministry of Natural Resources, Video Census Series No.2.
- International Joint Commission, United States and Canada Great Lakes Regional Office (1978) Environmental Management Strategy for the Great Lakes system. Windsor, Ontario.
- International Great Lakes Diversions and Consumptive Uses Study Board (1981) Great Lakes Diversions and Consumptive Uses, Annex F: Consumptive Water Uses.
- Ontario Ministry of Agriculture and Food Statistics Section (1982) Agricultural Statistics for Ontario, 1981.
- Ontario Ministry of Treasury and Economics. Ontario Statistics, 1982.
- Ontario Ministry of Natural Resources, Fisheries Branch. Employment and Investment in the Commercial Fishery, 1982 and Commercial Fish Industry.
- International Joint Commission, United States and Canada Great Lakes Regional Office (1980) Pollution in the Great Lakes Basin from Land Use Activities.
- Beeton, A. M. (1962) Light Penetration in the Great Lakes. Pub. No.9, Great Lakes Res. Div., Inst. Sci. and Tech., Univ. of Michigan, Ann Arbor, MI, pp. 68-79.
- Conway, H. L., Parker, J. I. Yaguchi E. M. & Mellinger D. L. (1977) Biological utilization and regeneration of silicon in Lake Michigan. J. Fish. Res. Board Can. 34: 537-544.
- D'Itri, F.M. (1987) Contaminants in selected fishes from the Upper Great Lakes. Proceedings of World Conference on Large Lakes-Mackinac '86, W. W. Schmidtke, Editor, Lewis Publishers, Inc., Chelsea, MI. In press.
- Frank, R., Thomas, R. L., Braun, H. E. Gross, D. L. & Davies, T. T. (1981) Organochlorine insecticides and PCB in surficial sediments of Lake Michigan. J. Great Lakes Research 7: 42 -50.
- IJC. (1978) Environmental Management Strategy for the Great Lakes System. International Reference Group on Great Lakes Pollution from Land Use Activities (PLUARG), Final Report, International Joint Commission, Great Lakes Regional Office, 100 Ouellette Avenue, Windsor, Ontario N9A 6T3, Canada.
- IJC. (1980) A Perspective on the Problem of Hazardous Substances in the Great Lakes Ecosystem. Great Lakes Science Advisory Board, Annual Report, International Joint Commission, Great Lakes Regional Office, 100 Ouellette Avenue, Windsor, Ontario N9A 6T3, Canada.
- IJC. (1985) Report on Great Lakes Water Quality. International Joint Commission, Great Lakes Water Quality Board. (30) Kinkead, J. D. & Chatterjee, R. M. (1974) A Limnological Survey of Nearshore Waters of Lake Superior. Proc. 17th Conf. Great Lakes Res., Int'l Assoc. Great Lakes Res., pp. 549-573.
- Schelske, G. L. (1977) Trophic status and nutrient loading for Lake Michigan. In: North American Project-A Study of U.S. Water Bodies: A Report for the Organization of Economic Cooperation and Development. Great Lakes Res. Div., Univ. of Michigan, Ann Arbor, MI, pp. 499-536.
- Schelske, G. L. & Roth, O.C. (1973) Limnological survey of Lakes Michigan, Superior, Huron and Erie. Great Lakes Res. Div., Univ. of Michigan, Ann Arbor, MI, Pub. 17. (33) Schelske, C. L. & Stoermer E. F. (1971) Eutrophication, sillica depletion and predicted changes in algal quality in Lake Michigan. Science 173: 423-424.
- Schelske, C. L. & Stoermer, E. F. (1972) Phosphorus, silica and eutrophication of Lake Michigan. In: G. E. Likens (Ed.), Nutrients and Eutrophication. Special Symposium Vol. 1, American Society of Limnology and Oceanography, Allen Press, Lawrence, KS, pp. 157-171.
- Schelske, C. L., Stoermer, E. F. Gannon, J. E. & Simmons, M. S. (1976) Biological, chemical and physical relationships in the Straits of Mackinac. Ecol. Res. Series, U.S. Environmental Protection Agency, Duluth, MN, Rep. No. EPA-600/3.76-095, 266 pp.
- Stoermer, E. F., Bowman, M. M. Kingston, J. C. & Schaedel, A. L. (1974) Phytoplankton composition and abundance during IFYGL. Great Lakes Res. Div., Univ. of Michigan, Ann Arbor, MI, Spec. Rep. No. 53, 373 pp.
- Villeneuve, D. C. (1986) Proceeding of Governor's Conference on Illinois' Great Lake-Lake Michigan. Illinois Department of Energy and Natural Resources, DOC No. RE-IS/86/03. Springfield, IL, pp. 23-25.
- Frank, R., Thomas, R. S., Braun, H. E., Raspher, J. & Dawson, R. (1980) Organochlorine insecticides and PCB in surficial sediments of Lake Superior (1973) J. Great Lakes Research, 6: 113-120.
