
LAKE MICHIGAN
Northnmost part of the lake rom Front Mackinac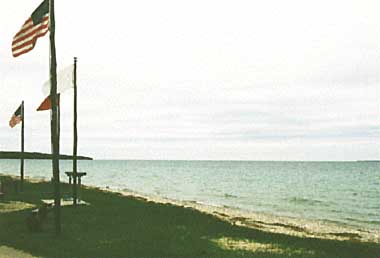
Photo: A. Kurata
A. LOCATION
Michigan, Indiana, Illinois and Wisconsin, USA.41:0'-46:8'N, 84:4'-87:4'W; 176.7 m above sea level.
B. DESCRIPTION
Lake Michigan is the third largest of North America's Great Lakes, and is the only one entirely within the United States, while Canada shares sovereignty over the other four lakes. The lake is therefore the largest freshwater lake in the United States. It extends about 520 km from north to south, and measures about 100 km in its maximum width, with long stretches of scenic shoreline, beaches, bays and inlets. The lake water flows out to L. Huron through Mackinac Straights.Since the middle of the last century, urbanization and industrialization have progressed rapidly along the lake's southern shore, which is now one of the most highly industrialized areas in the United States. The lake water along the southern coast has been seriously eutrophicated since the early 1970's. To counter this trend, a number of laws have been legislated and wastewater treatment plants constructed. The use of synthetic detergents containing phosphorus was thereby prohibited in the lake's watershed. The wastewater, that had once entered the lake, was diverted to the Mississippi River. As the result, the quality of the lake water is now recovering gradually.
C. PHYSICAL DIMENSIONS (1, 2, 3)
| Surface area [km2] | 58,016 |
| Volume [km3] | 4,871 |
| Maximum depth [m] | 281 |
| Mean depth [m] | 84 |
| Water level | Unregulated |
| Normal range of annual water | |
| level fluctuation [m]* | 0.3 |
| Length of shoreline [km] | 2,656 |
| Residence time [yr] | 99.1 |
| Catchment area [km2] | 117,845 |
D. PHYSIOGRAPHIC FEATURES
D1 GEOGRAPHICAL (Q, 1, 2, 3, 4, 5) Bathymetric map: Fig. NAM-03-01. Names of main islands Beaver (200 km2), Washington (55 km2), North Manitou (48 km2), South Manitou (21 km2), Garden (17 km2), South Fox (14 km2), High (13 km2) and Hog (9 km2). Number of outflowing rivers and channels (name) 2 (Straits of Mackinac and Chicago Diversion).D2 CLIMATIC (1, 2, 4, 5, 6, 7, 8) Climatic data at Muskegon, 1943-1980 Mean temp. [deg C]
| Jan | Feb | Mar | Apr | May | Jun | Jul | Aug | Sep | Oct | Nov | Dec | Ann. |
|---|---|---|---|---|---|---|---|---|---|---|---|---|
| -4.8 | -4.4 | 0.2 | 7.2 | 13.2 | 18.4 | 21.1 | 20.4 | 16.3 | 10.6 | 3.9 | -1.8 | 8.3 |
| Jan | Feb | Mar | Apr | May | Jun | Jul | Aug | Sep | Oct | Nov | Dec | Ann. |
|---|---|---|---|---|---|---|---|---|---|---|---|---|
| 60 | 43 | 64 | 79 | 69 | 69 | 61 | 77 | 79 | 67 | 75 | 67 | 808 |
Bathymetric map (Q).
Water temperature [deg C](Q) 1937-1969
| Depth[m] | Jan | Feb | Mar | Apr | May | Jun | Jul | Aug | Sep | Oct | Nov | Dec |
|---|---|---|---|---|---|---|---|---|---|---|---|---|
| S* | 0 | 0 | 1 | 3 | 5 | 10 | 16 | 21 | 17 | 12 | 7 | 4 |
Seasonal change in water temperature (northern part), 1976 (Q).
Freezing period: December or January-middle March. Mixing type: Dimictic. Notes on water mixing and thermocline formation Thermocline generally develops during January-March and July-November. Supplementary notes Thermal cycle is similar throughout the lake but with variations resulting from differences in latitude and depth. While the water temperature in the lake is nearly homothermous from November to late May, slight inverse stratification of ten occurs in middle winter. Thermal stratification of Lake Michigan begins in early to middle June. In the lower latitudes of Lake Michigan, the ice forms in December or January and lasts until middle March. In the northern latitudes, ice formation may begin about 30 days earlier. In either case, the lake never freezes shore to shore.
E. LAKE WATER QUALITY (Q, 1, 2, 3, 4, 5, 9, 10, 11, 12, 13)
E1 TRANSPARENCY: Fig. NAM-03-03.
Seasonal variation in Secchi depth [m] in 1976 (Bartone and Schleske, 1982).
Supplementary notes The Michigan Department of Natural Resources (MDNR)(1984)
found that secchi depth transparency ranged from 0.4 to 9.8 m with increasing
transparency from south to north, excluding Green Bay. Northern locations
generally averaged 2 to 4 times greater transparency than southern lake
locations.
E2 pH: Fig. NAM-03-04.
pH profiles in the northern part, 1976 (Q).
E3 SS [mg l-1] 1976
| Depth[m] | Average |
|---|---|
| 1 | 1-9 |
| Basin | 1978 | 1981 |
|---|---|---|
| Indiana | 39,491 | 19,335 |
| Michigan | 36,490 | 20,522 |
| Wisconsin | 46,662 | 21,354 |

Distribution of DO in surface water, 1964 (Beeton and Moffet, 1964).
E5 COD [mg l-1] Determined by K2CrO4 method. Illinois, 1969-1973:
6.5 (2-16). Indiana Harbor, 1969-1973: 9.1 (2-21). Milwaukee, 1969-1973:
8.2 (5-40).
E6 CHLOROPHYLL CONCENTRATION [micro g l-1] Inshore, 1970-1971:
1.1-10.3. Offshore, 1970-1971: 0.6-3.7. Mean of all stations, 1974-1975:
1.34.
E7 NITROGEN CONCENTRATION: Fig. NAM-03-06.
Average concentration of organic nitrogen [micro g l-1](Robertson and Powers, 1968). Upper number: in the upper 20 m. Lower number: below a depth of 20 m.
E8 PHOSPHORUS CONCENTRATION PO4-P [micro g l-1] Open waters, 1964: 5-20.
Distribution of PO4-P [micro g l-1] in surface water (Beeton and Moffet, 1964).
E9 CHLORIDE CONCENTRATION [mg l-1] Inshore, 1962-1965: 7.1. Offshore, 1962-1965: 6.5. Southern end, 1962-1965: 8.0. Nearshore and Offshore, 1984: 8.3 (7.6-9.1).
Seasonal and spatial distribution of chloride. 1980 (Moll and Brahce, 1986). Means and standard errors are plotted.
E10 PAST TRENDS Loading of total dissolved solids to all of the Great Lakes, with the exception of Lake Superior. has increased significantly over the past 50 years. This has resulted in increased concentration of nutrients, chlorides, sulphates and numerous other ions and compounds in Lakes Michigan, Huron, Erie and Ontario.
F. BIOLOGICAL FEATURES
F1 FLORA (1, 2, 3, 4, 5, 11, 13, 14, 15) Emerged macrophytes Scirpus acutus, S. americanus, Sparganium sp., Phragmites sp., Eleocharis sp. Floating macrophytes: No dominant species. Submerged macrophytes Nitella flexilis, Chara globularis, Isoetes riparia. Phytoplankton Cyclotella comensis, C. comita, C. glomerata, Coelastrum reticulatum, Tabellaria fenestrata, Asterionella formosa.F2 FAUNA (1, 2, 3, 4, 5, 11, 13, 14, 15) Zooplankton Protozoa (Difflugia globulosa), Cladocera (Bosmina longispina, Daphnia retrocurva),Rotifera (Polyarthra vulgaris, Notholca longispira), Copepoda (Diaptomus ashlandi, Limnocalanus macrurus). Benthos Amphipoda (Pontoporeia affinis), Oligochaeta (Limnodrilus sp., Tubifex sp., Stylodrilus sp.) Mollusca (Pisidium sp.). Fish Alosa pseudoharengus, Cyprinus carpio, Oncorhynchus kisutch, O. tschawytscha, Perca flavescens, Osmerus sp., Salvelinus namaycush, Coregonus chupeaformis.
F3 PRIMARY PRODUCTION RATE (Q) Carbon-fixation rate [mg C m-3 day-1]: 2.40 òÂ0.82. Photosynthetic assimilation ratio [mg C hr-1 mg (Chl-a)-1]: 0.74.
Chlorophyll a [mg l-1], primary productivity [mg C l-1 hr-1], total phosphorus [mg PO4-P l-1] and Secchi disc transparency [m] in the Great Lakes (Schelske, 1974).
F4 BIOMASS: Fig. NAM-03-10 (Q).
Seasonal and spatial distribution of chlorophyll, 1980 (Mohr and Brahce, 1986). Means and standard errors are plotted.
F5 FISHERY PRODUCTS (Q) Annual fish catch [metric tons] 1980:
11,432.
F7 NOTES ON THE REMARKABLE CHANGES OF BIOTA IN THE LAKE IN RECENT
YEARS The phytoplankton of Lake Michigan were originally dominated
by oligotrophic diatoms. With increased nutrient loading to the lake, the
more eutrophic species of diatoms became more prevalent. Recently, an additional
shift has occurred from diatoms to phytoplankton assemblages with increasing
proportions of both green and blue-green algae. These shifts are most evident
in eutrophic areas of Green Bay and localized areas at the southern shore
(16). Major upheaval has occurred during the past 40 years. By 1946, sea
lamprey has invaded all the Great Lakes and decimated the native fish populations.
The decline of native fish populations created conditions favorable for
the explosive increase of alewife (Alosa pseudoharengus) which, in turn,
greatly reduced the populations of yellow perch (Perca flavescens), cisco
(Coregonus sp.) and lake herring (Coregonus artedii). Salmon species were
introduced in 1964 and have effectively utilized the alewife as a food
source. This has served to both reduce the alewife population and create
a vital sport-fishing industry. The predominance of alewife also resulted
in a shift toward smaller size zooplankton as the larger species were selectively
harvested (Wells, L., 1969: U.S. Fish Wildlife Service, Fish. Bull., 60:
343-369).
G. SOCIO-ECONOMIC CONDITIONS (Q, 3-5, 10, 17-24)
G1 LAND USE IN THE CATCHMENT AREA 1978| Area [km2] | [%] | |
|---|---|---|
| Natural landscape | ||
| Woody vegetation | 58,645 | 49.8 |
| Herbaceous vegetation | 27,515 | 23.3 |
| Agricultural land | 27,595 | 23.4 |
| Residential area | 4,090 | 3.5 |
| Total | 117,845 | 100.0 |
G2 INDUSTRIES IN THE CATCHMENT AREA AND THE LAKE 1970
| Gross product | No.of | No. of | Main products | |
|---|---|---|---|---|
| per year | persons | establish- | or major | |
| [mill.$] | engaged | ments | industries | |
| Primary industry | ||||
| Agriculture | 2,869.42 | 118,350 | 110,215 | |
| 1) | ||||
| Fisheries | N.A. | N.A. | N.A. | |
| Others | N.A. | N.A. | N.A. | |
| Secondary industry | ||||
| Manufacturing | 27,599.80 | 1,808,395 | N.A. | |
| 2) | ||||
| Mining | 286.00 | 8,392 | N.A. | |
| 3) | ||||
| Others | N.A. | 3,436,022 | N.A. |
G3 POPULATION IN THE CATCHMENT AREA 1970
| Population | Major cities | |||||
|---|---|---|---|---|---|---|
| Population | density [km-2] | (population) | ||||
| Total | 13,517,000 | 114.7 | Chicago* | (3,063,000), | ||
| Milwaukee, Grand | Rapids, Green Bay. |
H. LAKE UTILIZATION (Q)
H1 LAKE UTILIZATION Source of water, navigation, tourism, recreation (swimming, sport-fishing and yachting) and fisheries.H2 THE LAKE AS WATER RESOURCE* 1975
| Use rate [m3 sec-1] | |
|---|---|
| Domestic | 77.4 |
| Irrigation | 5.4 |
| Industrial | 290.7 |
| Power plant | 472.0 |
| Others | |
| Mining | 6.5 |
| Livestock | 2.0 |
I. DETERIORATION OF LAKE ENVIRONMENTS AND HAZARDS (Q)
Il ENHANCED SILTATION Extent of damage: Not serious. Supplementary notes The siltation is only serious at its confluence (i.e., about 0.6 km) with rivers draining agricultural areas. Presently, the problem is not serious overall; however, it could become a serious problem if not controlled. As of 1987, Lake Michigan was at a record high level, leading to greatly increased shoreline erosion and temporary shoreline siltation.I2 TOXIC CONTAMINATION Present status: Detected but not serious. Generalized distribution of contaminants in the lake sediments [ppb (dry wt.) basis]
| Names of | Range | Average |
|---|---|---|
| contaminants | ||
| DDT | <10-40 < | 12 |
| PCB | <2-20 | <10 |
| Dieldrin | <0.1-1.0 < | 0.25 |
| Hg | <50-500 < | - |
| Pb | <50,000, 100,000-150,000 | - |
| Concentrations in sediments | ||||||||
|---|---|---|---|---|---|---|---|---|
| Parts of Lake | Parameters* | X1 | X2 | X3 | X4 | X5 | X6 | X7 |
| Whole Lake | Mean | 286 | 0.25 | 0.37 | 0.67 | 1.29 | 279 | 9.7 |
| SD | 0.43 | 0.88 | 1.03 | 1.90 | 15.7 | |||
| Non-Depositional | Mean | 194 | 0.17 | 0.19 | 0.50 | 0.86 | 193 | 6.3 |
| Zones | SD | 0.38 | 0.55 | 0.83 | 1.50 | 8.1 | ||
| Depositional | Mean | 92 | 0.41 | 0.73 | 1.05 | 2.19 | 86 | 17.3 |
| Basins | SD | 0.49 | 1.26 | 1.29 | 2.29 | 23.9 | ||
| Algoma Basin | Mean | 40 | 0.36 | 0.53 | 0.56 | 1.45 | 37 | 10.1 |
| SD | 0.36 | 0.93 | 0.62 | 1.33 | 10.6 | |||
| Fox Basin | Mean | 4 | 0.21 | 0.05 | 2.70 | 2.96 | 4 | 73.5 |
| SD | 0.21 | 1.08 | 1.17 | 78.9 | ||||
| Grand Haven Basin Mean | 9 | 0.52 | 1.47 | 1.18 | 3.17 | 8 | 17.1 | |
| SD | 0.71 | 2.05 | 1.90 | 4.40 | 23.1 | |||
| Milwaukee Basin | Mean | 6 | 0.38 | 0.56 | 2.52 | 3.46 | 6 | 29.2 |
| SD | 0.31 | 1.25 | 2.06 | 2.42 | 23.1 | |||
| Sarian Basin | Mean | 2 | 0.06 | 1.33 | 0.58 | 1.97 | 2 | 7.9 |
| SD | 0.06 | 1.80 | 0.74 | 2.48 | 2.0 | |||
| Southern Basin | Mean | 19 | 0.36 | 1.04 | 0.92 | 2.32 | 17 | 17.1 |
| SD | 0.47 | 1.61 | 1.17 | 2.64 | 11.1 | |||
| Traverse Basin | Mean | 2 | 0.46 | 0.28 | 0.05 | 0.79 | 2 | 2.5 |
| SD | 0.26 | 0.32 | 0.58 | |||||
| Waukegan | Mean | 10 | 0.77 | 0.66 | 1.95 | 3.38 | 10 | 19.5 |
| SD | 0.80 | 0.72 | 1.18 | 1.69 | 13.2 |
Past trend of total DDT residues in Lake Michigan fish (D'Itri, 1987). Lake Trout: Salvelinus namaycush. Bloater Chub: Coregonus chupeaformis.
Past trend of total PCB residues in Lake Michigan fish (D'Itri, 1987).
Past trend of dieldrin residues in Lake Michigan fish (D'Itri, 1987).
Past trend of mercury residues in Lake Michigan fish (D'Itri, 1987). Yellow perch: Perca flavescens.
(25) PCB concentrations in surface sediments.
Environmental quality standards for contaminants in the lake IJC* 1978 Agreement objectives are "no-effect levels, for the protection of aquatic life, human consumers of fish, or fish-consuming aquatic birds." Objectives have been recommended for approximately 40 organic and inorganic chemicals, including persistent toxic substances, non-persistent toxic substances, physical materials, microbiological and radiological contaminants. Examples of specific objectives include: Dieldrin, less than 0.001 micro g-1 in water and less than 0.3 micro g-1 in edible portions of fish. DDT and metabolites, less than 0.003 micro g-1 in water and 1.0 micro g-1 in fish. PCB should not exceed 0.1 micro g-1 in fish while the mercury content of filtered water should be less than 0.2 micro g-1 and 0.5 micro g-1 in fish flesh. * IJC: International Joint Commission. Supplementary notes Critical pollutants in the Great Lakes ecosystem include: PCB, 2, 3, 7, 8- TCDD, mirex, 2, 3, 7, 8, TCDF, hexachlorobenzene, benzo-a-pyrene, dieldrin, alkylated lead, DDT and metabolites, toxaphene, and mercury. The worst problems associated with contaminated sediments occurs in bays, harbor mouths and connecting channels. For example, the sediments in some of the drainage ditches emptying into Waukegan Harbor near Chicago contain as much as 500,000 micro g-1 PCB (Villeneue, 1986). Heavy urban and industrial development and use of connecting channels as a transportation corridor have contributed to the degradation of the water quality of the St. Mary's River connecting Lake Superior and Lake Michigan. Past experience with persistent toxic chemicals such as PCB, DDT, mercury, dieldrin and mirex show that once they are introduced into an aquatic ecosystem, they are extremely difficult to remove, especially in sediments which become a source for their remobilization into the water column. Therefore, the emphasis of regulatory officials has been directed toward preventing their release and the development of effective and efficient responses to identified problems. Food safety standards or tolerance limits for toxic contaminant residue Regulatory limitations are set by the U.S. Food and Drug Administration and Canada Dept. of National Health and Welfare and are advisories only with regard to human consumption of fish. The U.S. standards are: PCB 2 mg kg-1, DDT 5 [mg kg-1], Dieldrin 0.3 [mg kg-1] and mercury 1 [mg kg-1] (Federal limit) and 0.5 [mg kg-1] (State limit).
| Restrict consumption | Do not eat | |
|---|---|---|
| (important)*2 | ||
| Lake Michigan1 (applies to | Lake Trout 20-23", | Lake Trout over 23", |
| Michigan, Illinois, Indiana | Coho Salmon over 26", | Chinook over 32", |
| and Wisconsin waters) | Chinook Salmon 21-32", | Brown Trout over 23", |
| and Brown Trout up to | Carp and Catfish | |
| 23" | ||
| Green Bay*1 (Wisconsin | Splake up to 16" | Rainbow Trout over |
| waters South of Marinette/ | 22", Chinook over | |
| Menominee) | 25", Brown Trout over | |
| 12", Brook Trout over | ||
| 15", Splake over 16", | ||
| Northern Pike over | ||
| 28", Walleye over | ||
| 20", White Bass and | ||
| Carp |
| Metal | Total deposition |
|---|---|
| Zn | * |
| Pb | 1,730 |
| Cu | 575 |
| Cd | 58 |
| Ni | 575 |
| Fe | * |
| Al | 28,800 |
| Mn | 1,150 |
| Substance | Total deposition |
|---|---|
| Total PCB | 6.9 |
| Total DDT | .40 |
| alfa BHC | 2.3 |
| -BHC | 11.2 |
| Dieldrin | .38 |
| HCB | 1.2 |
| p, p'-methoxychlor | 5.9 |
| alfa endosulfan | 5.6 |
| -endosulfan | 5.6 |
| Total PAH | 114 |
| Anthracene | 3.4 |
| Phenanthrene | 3.4 |
| Pyrene | 5.9 |
| Benzo(a)anthracene | 2.9 |
| Perylene | 3.3 |
| Benzo(a)pyrene | 5.6 |
| DBP | 11 |
| DEHP | 11 |
| Total organic carbon | 1.4x1.0E+5 |
Areas of concern in Lake Michigan. The IJC areas of concern include locales where environmental degradation and impairment of beneficial uses is severe and those where some environmental degradation is obvious and where uses may be impaired.
J. WASTEWATER TREATMENTS (Q)
J1 GENERATION OF POLLUTANTS IN THE CATCHMENT AREA- c) Limited pollution with wastewater treatment. d) Measurable pollution
with limited wastewater treatment. f) Others.
| P [metric tons yr-1] | ||||
|---|---|---|---|---|
| Source | Canada | U.S. | Total | [%] |
| Direct municipal sewage | - | 1,040 | 1,040 | 16 |
| treatment plants | ||||
| Tributary municipal sewage | - | 1.458 | 1,458 | 23 |
| treatment plants | ||||
| Direct industrial | - | 32 | 32 | <1 |
| Tributary industrial | - | 247 | 247 | 4 |
| Urban nonpoint direct | - | * | * | |
| Tributary diffuse | - | 1,891 | 1,891 | 30 |
| (Tributary total) | - | (3,596) | (3,596) | |
| Sub-total | - | 4,668 | 4,668 | 74 |
| Atmospheric | - | - | 1,682 | 26 |
| Load from upstream lake | - | - | - | |
| Total | 6,350 | 100 | ||
| Shoreline erosion | - | 3,711 | 3.711 | |
| (not included in total) |
K. IMPROVEMENT WORKS IN THE LAKE (Q)
K1 RESTORATION Green Bay Nutrient Mass Balance Study as basis for remedial action plan. St. Louis River-IJC area of concern for remedial action plan.K2 AERATION: N.A.
K3 OTHERS: N.A.
L. DEVELOPMENT PLANS (Q)
Generally, 3 areas of development planning have been or are significant: 1) the planning that has occurred for the conversion of most of the small commercial port facilities to recreational facilities beginning about 1980, 2) the county by county planning for recreational second home development along and near the lake front beginning about 1960, and 3) the recent planning that has occurred with the high water levels (1987). The urban areas are at risk and will be fortifying their water fronts. The state's Sea Grant Programs and the Coastal Management Program of NOAA have had primary responsibility.M. LEGISLATIVE AND INSTITUTIONAL MEASURES FOR UPGRADING LAKE ENVIRONMENTS (Q)
M1 NATIONAL AND LOCAL LAWS CONCERNEDNames of the laws (the year of legislation)
- Rivers and Harbors Acts (1899 and 1909)
- Flood Control Acts (1917, 1936 and 1944)
- Safe Drinking Water Act
- State legislation implementing and augmenting federal laws
- Federal Water Pollution Control (Clean Water) Act (1972, amendments 1977 and 1987) Responsible authorities
- Corps of Engineers of the U.S. Army
- Corps of Engineers of the U.S. Army
- State Agencies for Environment and Natural Resources
- U.S. Environmental Protection Agency
- U.S. Environmental Protection Agency Main items of control
- Discharges, dredging and filling
- Flood control
- Drinking water-including standards
- The entire range of water related problems
- Water pollution Supplementary notes Other U.S. laws which indirectly relate to preserving the water quality of the Great Lakes include the 1976 Resource Conservation and Recovery Acts (RCRA), the 1976 Toxic Substances Control Act (TSCA) and the Comprehensive Environmental Response, Compensation and Liability Act of 1980 as amended 1987 (CERCLA or Superfund).
- Great Lakes Fishery Commission (International); established in 1960 to formulate, coordinate and implement fisheries research programs related to the Great Lakes; Ann Arbor, MI.
- International Joint Commission (International); established in 1909 to investigate pollution in the boundary waters of the United States and Canada; Windsor, Ontario.
- U.S. Environmental Protection Agency; established in 1972 to protect the nation's atmospheric, terrestrial and aquatic environments and enforce legislation enacted to protect them; Chicago, IL.
- The U.S. Army Corps of Engineers (U.S., Federal); concerned with all aspects of water resources as they relate to present and future needs of navigation, flood control, power, water supply, irrigation, beach erosion, dredging and recreational activities; Chicago, IL.
- The U.S. Bureau of Commercial Fisheries (Federal); concerned with maintaining viable and expanding fisheries in the Great Lakes; in this regard, it conducts a broad research program on parasite (lamprey) control, effects of exploitation on the Great Lakes fishery and establishing the relationship between limnological conditions and the general biology of commercial fish species.
- The U.S. Public Health Service (Federal); concerned with monitoring food and water supplies as they relate to human health; one of their primary functions is to develop and maintain an inventory of the resources and nature of pollutants entering each lake relative to the population and industry of the region; Washington, DC.
- U.S. Department of Agriculture (Federal); concerned with developing programs and research to minimize nonpoint pollution from agriculture (pesticides, nutrients, and erosion) as it relates to protecting the water quality of the Great Lakes.
- U.S. Department of Commerce (Federal); Great Lakes research and monitoring programs administered under its National Oceanic and Atmospheric Administration (NOAA).
- U.S. Department of the Interior (Federal); under its U.S. Geological Survey, sponsors research and education programs through the State Water Resources Institute program.
- Great Lakes Commission (an interstate compact commission); established in 1955 by the eight states bordering the Great Lakes to provide communication, coordination and advocacy on Lakes issues; the Commission deals with environmental quality, resources management, transportation and economic development; Ann Arbor, MI.
- The State Departments of Natural Resources (State); Each state in the United States has a Department of Natural Resources or equivalent department which is responsible for monitoring the state's natural resources and enforcing legislation enacted to protect them.
- The State Departments of Public Health (State); each state in the United States has a Department of Public Health or equivalent department, which is responsible for monitoring food and water supplies as they relate to human health.
- Great Lakes Research Division, University of Michigan
- University of Minnesota Limnological Research Centre, University of Minnesota Supplementary notes Private organizations concerned with the well-being of the Great Lakes.
- Centre for the Great Lakes, Chicago, IL
- Great Lakes Tomorrow, Toronto, Ontario
- Great Lakes United, Buffalo, NY
- Operation Clean Niagara, Niagara-on-the-Lake, Ontario
- Pollution Probe, Toronto, Ontario
N. SOURCES OF DATA
- Questionnaire filled by Prof. F. M. D'Itri, Institute of Water Research, Michigan State University based on the following sources.
- Hough, J. L. (1958) Geology of the Great Lakes. University of Illinois Press, Urbana, Illinois.
- Pincus, H. J. (1962) Great Lakes Basin. American Association for the Advancement of Science, Washington, D. C.
- Great Lakes Basin Commission Public Information Office (1974) Great Lakes Basin Frame. work Study. Ann Arbor, Michigan.
- Great Lakes Fishery Commission (1980) Annual Report. Ann Arbor, Michigan.
- Great Lakes Fishery Commission. Commercial Fish Production in the Great Lakes, 1867-1977, Technical Report 3. Ann Arbor, Michigan.
- National Oceanic and Atmospheric Administration, National Environmental Satellite, Data and Information Service, National Climatic Data Centre. Department of Commerce, Asheville, North Carolina.
- Solar Energy Research Institute. Solar Energy Information Data Book, Insolation Data Manual. Golden, Colorado.
- National Oceanic and Atmospheric Administration Environmental Data Service, U.S. Department of Commerce. Local Climatological Data.
- Great Lakes Water Quality Board, International Joint Commission; United States and Canada Great Lakes Regional Office (1973) Great Lakes Water Quality Annual Report to the International Joint Commission. Windsor, Ontario.
- International Joint Commission, United States and Canada Great Lakes Regional Office (1980) Great Lakes Water Quality, 7th Annual Report. Windsor, Ontario.
- United States Environmental Protection Agency. Limnological Conditions in Southern Lake Huron, 1974 and 1975. Publication No. EPA-600/3-80-074. Duluth, Minnesota.
- Great Lakes Research Division, Institute of Science and Technology, University of Michigan (1973) Limnological Survey of Lakes Michigan, Superior, Huron and Erie. Publication No. 17. University of Michigan, Ann Arbor, Michigan.
- Great Lakes Research Division, Institute of Science and Technology, University of Michigan (1972) Phytoplankton and Physical-Chemical Conditions in Selected Rivers and the Coastal Zone of Lake Michigan, 1972. Publication No. 19. University of Michigan, Ann Arbor, Michigan.
- Sommers, G. L. (1982) Fish in Lake Michigan. Michigan Sea Grant, University of Michigan. Ann Arbor, Michigan.
- Interagency Committee on Marine Science and Engineering, Federal Council for Science and Technology, Argonne National Laboratory (1975) Proceedings of the Second Federal Conference on the Great Lakes.
- Schelske, C. L., Feldt, L. E. & Simmons, M. S. (1980) Phytoplankton and Physical. Chemical Conditions in Selected Rivers and the Coastal Zone of Lake Michigan, 1972. Great Lakes Res. Div. Publ. 19.
- Weathesen, G. L. (1983) Ontario Mineral Score, 1982. Ontario Ministry of Natural Resources, Video Census Series No. 2.
- International Joint Commission, United States and Canada Great Lakes Regional Office (1978) Environmental Management Strategy for the Great Lakes System. Windsor, Ontario.
- International Great Lakes Diversions and Consumptive Uses Study Board (1981) Great Lakes Diversions and Consumptive Uses, Annex F: Consumptive Water Uses.
- International Joint Commission (1978) Inventory of Land Use and Land Use Practices. 1, Canadian Great Lakes Basin Summary.
- Ontario Ministry of Agriculture and Food, Statistics Section (1982) Agricultural Statistics for Ontario, 1981.
- Ontario Ministry of Treasury and Economics. Ontario Statistics, 1982.
- Ontario Ministry of Natural Resources, Fisheries Branch. Employment and Investment in the Commercial Fishery, 1982 and Commercial Fish Industry.
- Pollution in the Great Lakes Basin from Land Use Activities, 1980. International Joint Commission; United States and Canada Great Lakes Regional Office, Windsor, Ontario.
- Allan, R. J. (1986) The Role of Particulate Matter in the Fate of Contaminants in Aquatic Ecosystems. Inland Waters Directorate, National Water Research Institute, Canada Centre for Inland Waters. Scientific Series No. 142, p. 60.
