
LOWER LAKE
A view on the lakeshore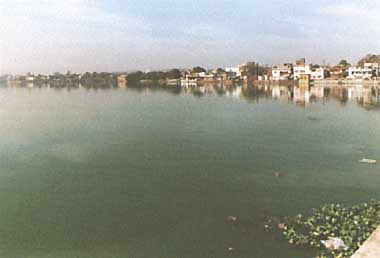
Photo: S.Silakari
A. LOCATION
- Madhya Pradesh, India.
- 23:16N, 77:25E; 495 m above sea level.
B. DESCRIPTION
-
The findings indicate that the lake is highly eutrophicated and grossly polluted by continuous inflow of large amount of sewage badly affecting aquatic life. The lake gets high nutrient loading both from the bottom and the surface which creates complete anaerobic conditions in many parts even at a depth of one meter. The water remains very turbid throughout due to permanent algal blooms specially of Microcystis spp. In summer, water gets stratified with a difference of 9.8deg C but without well defined thermocline. Nutrients N & P; chlorophyll contents have increased many folds within a period of about ten years. Fecal bacteria population is very high indicating a high degree of contamination, with low fish production. The lake has a basic defect in its construction of the lower dam wall which is without a sluice gate and only aerated surface water continuously overflows the dam wall. Since, the lake is surrounded by the rows of houses within a hilly terrain the water remains stagnant without any circulation and mixing of the aerated and anaerobic bottom water and increases the sinking rate of the silt particles into the bottom. The whole lake is thus converted into a large septic tank making the lake shallower and shallower day by day. It has been recommended that all the sewage inflows should be diverted immediately to save its life span. The lake has great importance to local people, who take bath and wash their clothes because of scarcity of water. Water is also used for gardening but there is no well developed tourism because of the fowl odour of decaying algae (Q).
C. PHYSICAL DIMENSIONS (Q)
| Surface area [km2] | 1 |
| Volume [km3] | 0.008 |
| Maximum depth [m] | 10.7 |
| Mean depth [m] | 6.2 |
| Water level | Regulated |
| Normal range of annual water level fluctuation [m] | No record |
| Length of shoreline [km] | 6.3 |
| Residence time [yr] | N.A. |
| Catchment area [km2] | N.A. |
D. PHYSIOGRAPHIC FEATURES
D1 GEOGRAPHICAL (Q)- Bathymetric map: Fig. ASI-47-01.
- Names of main islands: An island towards south side of the lake.
- Number of outflowing rivers and channels (name): 1 (no name).
- Climatic data at Bhopal
| Jan | Feb | Mar | Apr | May | Jun | Jul | Aug | Sep | Oct | Nov | Dec | Ann. | |
|---|---|---|---|---|---|---|---|---|---|---|---|---|---|
| Mean temp. [deg C] | 18.1 | 20.5 | 25.4 | 29.5 | 33.6 | 31.2 | 26.6 | 25.6 | 26.0 | 24.7 | 20.9 | 18.4 | 25.0 |
| Precipitation [mm] | 17 | 5 | 10 | 3 | 11 | 137 | 429 | 308 | 232 | 37 | 15 | 7 | 1,209 |
- Solar radiation: 14.3 MJ m-2 day-1.
 Fig. ASI-47-01
Bathymetric map (Q).
- Water temperature [deg C] (1979-1982)
Surface: 18.6-37.
Bottom: 17.9-31.3.
- Freezing period: None.
- Mixing type: Polymictic.
- Notes on water mixing and thermocline formation
Because of the shallow nature of the lake, there is no stable thermocline.
E. LAKE WATER QUALITY (Q)
E1 TRANSPARENCY [m]*- 0.38-0.9.
* 3-year mean.
- Surface: 7.5-10.
Bottom: 6.8-9.8.
* 3-year mean.
- Surface: 1.0-1.4.
Bottom: 0.4-1.0.
| Deepest point, 1981 | ||||||||||||
| Depth [m] | Jan | Feb | Mar | Apr | May | Jun | Jul | Aug | Sep | Oct | Nov | Dec |
|---|---|---|---|---|---|---|---|---|---|---|---|---|
| 0 | 39 | 23 | 42 | 18 | 34 | 131 | 73 | 112 | 41 | 54 | 44 | 52 |
| 1 | 58 | 22 | 53 | 18 | 20 | 134 | 76 | 93 | 42 | 59 | 40 | 54 |
| 3 | 29 | 12 | 18 | 14 | 13 | 144 | 54 | 38 | 37 | 40 | 34 | 38 |
| 5 | 16 | 7 | 13 | 8 | 6 | 25 | 11 | 28 | 13 | 24 | 18 | 20 |
| 7 | 10 | 5 | 7 | 5 | 6 | 42 | 6 | 13 | 9 | 12 | 44 | 17 |
- Total-P [mg l-1]
- 1980-1981
Surface: 0.2-1.09.
Bottom: 0.22-1.91.
F. BIOLOGICAL FEATURES (Q)
F1 FLORA- Floating macrophytes: Eichhornia crassipes, Lemna sp.
- Submerged macrophytes
Ceratophyllum demersum, Hydrilla verticillata, Myriophyllum sp. - Phytoplankton
Dominant species only. Chlorophyceae (Actinastrum sp., Crucigenia sp., Scenedesmus sp., Tetraedron sp.), Cyanophyceae (Anabaenopsis sp., Merismopedia sp., Microcystis sp.), Bacillariophyceae (Cyclotella sp., Melosira sp., Navicula sp.).
- Zooplankton
Rotifers (Keratella tropica, Brachionus calyciflorus, Filinia longiseta), Cladocerans (Ceriodaphnia sp., Moina sp., Diaphanosoma sp.), Copepods (Mesocyslops sp., Diaptomus sp.).
| September 1980-August 1981 | ||||||||||||
| Jan | Feb | Mar | Apr | May | Jun | Jul | Aug | Sep | Oct | Nov | Dec | |
|---|---|---|---|---|---|---|---|---|---|---|---|---|
| Net production | 5.8 | 5.7 | 2 | 4.4 | 2.5 | 3 | 3 | 2.1 | 4 | 3.5 | 6 | 3 |
| Gross production | 6.4 | 9.2 | 4.7 | 6.7 | 5.6 | 6 | 4 | 5 | 8 | 5 | 7 | 5.7 |
G. SOCIO-ECONOMIC CONDITIONS (Q)
G1 LAND USE IN THE CATCHMENT AREA- No agricultural lands, some human settlements.
- Types of important forest or scrub vegetation: No forest area.
- Levels of fertilizer application on crop fields: No fertilizer application.
- Trends of change in land use in recent years: Encroachment of human settlement.
Township of Bhopal and the catchment of Lower Lake.
G2 INDUSTRIES IN THE CATCHMENT AREA AND THE LAKE
- Number of domestic animals in the catchment area: Cattle 100.
| Population | Population density [km-2] | major cities (population) | |
|---|---|---|---|
| Total | 10,000 | N.A. | Bhopal |
H. LAKE UTILIZATION (Q)
H1 LAKE UTILIZATION- Source of water, sightseeing and tourism (no. of visitors in 1989: 700), and recreation (swimming and sport-fishing).
- For paper mill use only.
I. DETERIORATION OF LAKE ENVIRONMENTS AND HAZARDS (Q)
I1 ENHANCED SILTATION- Extent of damage: Serious.
- Environmental quality standards for contaminants in the lake: None.
- Food safety standards or tolerance limits for toxic contaminant residue
None.
- Nuisance caused by eutrophication
Unusual algal bloom: Microcystis. Harms of fishery products: No information. - Nitrogen and phosphorus loadings to the lake [t yr-1]
| Sources | Industrial | Domestic | Agricultural | Natural | Total |
|---|---|---|---|---|---|
| T-N | - | 2,920 | - | - | 2,920 |
| T-P | - | 1,059 | - | - | 1,059 |
- Extent of damage: None.
- None.
J. WASTEWATER TREATMENTS (Q)
J3 SANITARY FACILITIES AND SEWERAGE- Percentage of municipal population in the catchment area provided with
adequate sanitary facilities (on-site treatment systems) or public sewerage: None. - Percentage of rural population with adequate sanitary facilities (on-site
treatment systems): None. - Municipal wastewater treatment systems: None.
K. IMPROVEMENT WORKS IN THE LAKE (Q)
- None.
M. LEGISLATIVE AND INSTITUTIONAL MEASURES FOR UPGRADING LAKE ENVIRONMENTS (Q)
M1 NATIONAL AND LOCAL LAWS CONCERNED- Names of the laws (the year of legislation): None.
- Responsible authorities
- Municipal corporation (removes only water hyacinth periodically)
- Department of Limnology, Bhopal University, Bhopal
N. SOURCES OF DATA
- Questionnaire filled by Dr. G. P. Bhatnagar, Bhopal University, Bhopal, India.
- Rao, Y. P. (1981) The climate of the Indian Subcontinent. "World Survey of Climatology, Volume 9, Climates of Southern and Western Asia" (ed. Takahashi, K. & Arakawa, H.), p. 153. Elsevier Scientific Publishing Company, Amsterdam-London-New York.
