
LAKE SONGKHLA
Fihs culture on Thale Sap Songkhla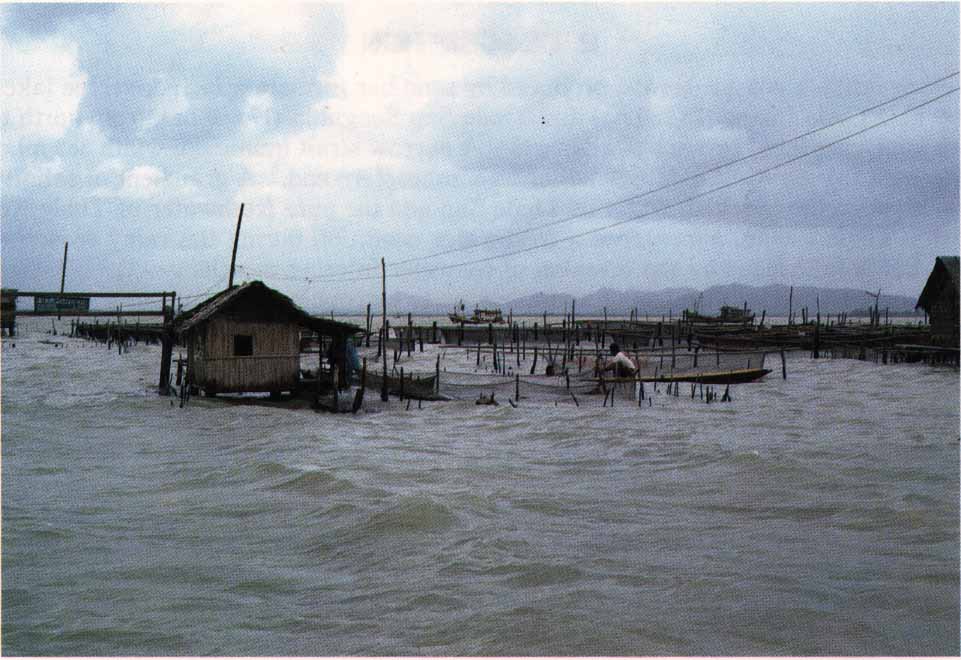
Photo: T. Kira
A. LOCATION
- Phattahalung, Songkhla and Nakhon Si Thammarrat, Thailand.
- 7°08′ - 50′N, 100°07′- 37′E; neary 0 m above sea level.
- Lake Songkhla, a coastal lagoon produced by sand-bar formation includes three lakes, Thale Noi (2,800 ha), Thale Luang (78,280 ha) and Thale Sap Songkhla (17,600 ha), from north to south, which are inter-connected by narrow channels. A narrow strait (minimum width 380 m) connects Thale Sap with the sea (Gulf of Thailand) at its southeastern end. A grandient of salinity exists, therefore, between the brackish water of Thale Sap and the pure freshwater of Thale Noi. The middle lake, Thale Luang, approaches a freshwater condition during the rainy season (October - January), but is influenced by the invasion of seawater in other month.
- The lakes are shallow throughout and moderately eutrophic, with a mean water depth of 1.2 -1.3 m in relatively dry seasons, but the water level rises by about one meter during the winter months. Thale Sap is known for its production of fish, shrimp and crabs, and is also intensively utilized for the aquaculture of seabass (Lates calcarifer). The fry produced and supplied by the National Institute of Coastal Aquaculture in Songkhla is grown in net cages by fishermen families. Thale Noi and the eastern branch of Thale Luang, called Kukut, have been designated as an area for waterfowl protection.
- The catchment area of about 8,020 km2 consistes mostly of lowland rice fields, rubber plantations and forest - covered hills, and contains such rapidly growing cities as Hat Yai and Songkhla. The waste water from certain manufacturing and factories has caused local pollution of the lake and some damage to the fisheries, but the complete and rapid turnover of water in the rainy season seems to prevent severe problems (Q, 1, 2).
C. PHYSICAL DIMENSIONS
| Surface area [km2] | 1,082 |
| Volume [km3] | 1.6 (MSL)** 3.8 (1.5 mMSL)** |
| Maximum depth [m] | 2.0 |
| Mean depth [m] * | 1.4 |
| Luang | 1.8 |
| Sap Songkla | 1.4 |
| Normal range of annual water level fluctuation (unregualtied)[m] |
0.6-2.2 |
| Residence time [yr] | 0.3-0.5 |
| Catchment area [km2] | 8,020 |
- *The depth of the channels connecting Thale Sap with the Gulf of Thailand and with Thale Luang is approximately 6 m. The average of monthly water depth observations at 35 stations in Thale Sap and Thale Luang (Oct. 1976-Sep. 1978) was 1.53 m (2).
- ** mean surface level
D. PHYSIOGRAPHIC FEATURES
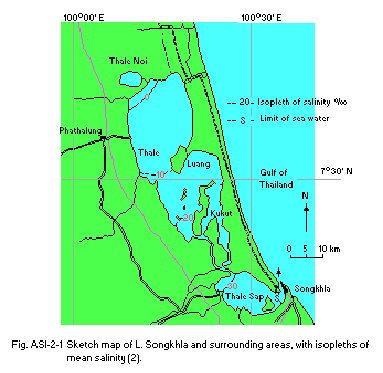
D1 GEOGRAPHICAL (Q)- Sketch map of the lake system: Fig. ASI-02-01.
- Main Islands (4 groups): Ko Yo ; Ko Si, Ko Ha ; Ko Khop, Ko Mak, Ko Nok; Mo Nu, Ko Maco.
- Outfowing rivers and channels (number and names) ; 2 (channnel connecting Thale Sap Songkhla with the Gulf of Thailand, and Ranot Canal).
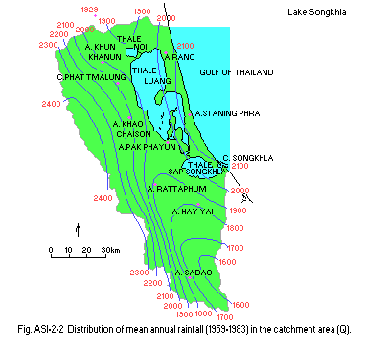
- Climatic data at Songkhal (Q,2) (cf. Fig. ASI-02-02)
| Jan | Feb | Mar | Apr | May | Jun | Jul | Aug | Sep | Oct | Nov | Dec | Ann. | |
|---|---|---|---|---|---|---|---|---|---|---|---|---|---|
| Mean temp.* [deg C] | 26.9 | 27.4 | 28.0 | 28.7 | 28.4 | 28.1 | 27.8 | 27.8 | 27.5 | 27.0 | 26.6 | 26.6 | 27.6 |
| Precipitation **[mm] | 141 | 39 | 42 | 56 | 131 | 102 | 121 | 114 | 122 | 305 | 541 | 437 | 2149 |
- *1951-1980 **1951-1970
- Fig.ASI-2-1 Sketch map of L. Songkhla and surrounding areas, with isopleths of mean salinity (2).
- Number of hours of bright sunshine: 2,625.0 hr yr-1.
- Water temperature [deg C] (Q,4)
| Depth [m] | Jan | Feb | Mar | Apr | May | Jun | Jul | Aug | Sep | Oct | Nov | Dec |
|---|---|---|---|---|---|---|---|---|---|---|---|---|
| Thale Noi* | 26.9 | - | - | - | - | - | - | - | 31.8 | - | - | - |
| Thale Luang** | 28.7 | 28.1 | 30.0 | 31.8 | 31.1 | 29.4 | 30.0 | 28.4 | 29.8 | 30.7 | 27.4 | 27.6 |
| Thale Sap** | 27.3 | 28.3 | 29.6 | 31.0 | 31.3 | 29.8 | 29.6 | 29.4 | 28.5 | 30.4 | 26.5 | 27.0 |
- *May. 1980 -Jan.1981 **Oct. 1976- Sep.1978
- Notes on water mixing and thermocline formation (Q): Extensive mixing in Thale Luang ; no thermocline formation.
E. LAKE WATER QUALITY
E1 TRANSPARENCY [m] , Oct. 1976-Sep.1978 (2)| Jan | Feb | Mar | Apr | May | Jun | Jul | Aug | Sep | Oct | Nov | Dec | |
|---|---|---|---|---|---|---|---|---|---|---|---|---|
| Thale Luang | 0.5 | 0.5 | 0.6 | 0.6 | 0.5 | 0.5 | 0.6 | 0.5 | 0.4 | 0.7 | 0.6 | 0.4 |
| Thale Sap | 0.6 | 0.7 | 0.8 | 0.9 | 0.9 | 0.6 | 0.9 | 0.8 | 0.7 | 0.7 | 0.4 | 0.3 |
| Jan | Feb | Mar | Apr | May | Jun | Jul | Aug | Sep | Oct | Nov | Dec |
|---|---|---|---|---|---|---|---|---|---|---|---|
| 7.8 | 7.8 | 8.1 | 7.9 | 7.2 | 7.3 | 7.8 | 7.3 | 7.5 | 6.9 | 6.9 | 7.2 |
| Jan | May | Sep | |
|---|---|---|---|
| Thale Noi | 26.2 | 176.7 | 49.9 |
| Thale Luang (Kukut) | 35.1 | 33.1 | 32.9 |
| Jan | Feb | Mar | Apr | May | Jun | Jul | Aug | Sep | Oct | Nov | Dec |
|---|---|---|---|---|---|---|---|---|---|---|---|
| 5.9 | 7.1 | 6.8 | 7.1 | 6.9 | 7.0 | 5.3 | 6.6 | 7.2 | 4.7 | 5.3 | 6.7 |
E6 CHLOROPHYLL CONCENTRATION [μg l-1] , 1978-1979, average at 0.3 m depth (Q)
| Jan | Feb | Mar | Apr | May | Jun | Jul | Aug | Sep | Oct | Nov | Dec |
|---|---|---|---|---|---|---|---|---|---|---|---|
| 1.65 | 6.30 | 2.58 | 10.0 | - | - | - | 7.58 | 0.77 | 0.69 | 2.27 | - |
- Total-N of surface water, May 1980-Jan.1981 (6)
| Jan | May | Sep | |
|---|---|---|---|
| Thale Noi | 0.64 | 3.75 | 1.39 |
| Thale Luang (Kukut) | 0.46 | 0.89 | 0.96 |
- NO3-N (mean for whole lake, 1973-1977)(1).
| Jan | Feb | Mar | Apr | May | Jun | Jul | Aug | Sep | Oct | Nov | Dec |
|---|---|---|---|---|---|---|---|---|---|---|---|
| 2.20 | 1.96 | 2.58 | 2.59 | - | - | - | - | 1.95 | 1.97 | 2.29 | 2.33 |
E8 PHOSPHORUS CONCENTRATION [mg l-1]
- PO4-P, 1978-1979, average at 0.3 m depth (Q)
| Jan | Feb | Mar | Apr | May | Jun | Jul | Aug | Sep | Oct | Nov | Dec |
|---|---|---|---|---|---|---|---|---|---|---|---|
| 0.05 | 0.08 | 0.06 | 0.07 | 0.02 | 0.08 | - | - | 0.15 | 0.12 | 0.04 | 0.07 |
| Jan | Feb | Mar | Apr | May | Jun | Jul | Aug | Sep | Oct | Nov | Dec |
|---|---|---|---|---|---|---|---|---|---|---|---|
| 2.9 | 3.3 | 5.9 | 6.9 | 1.2 | 1.1 | 1.3 | 3.1 | 9.3 | 11.0 | 3.5 | 2.2 |
F. BIOLOGICAL FEATURES
F1 FLORA- Mangrove plants: Kukut (Sonneratia caseolaris, Nipa fruticans, Acrostichum aureum) ; Thale Sap (Rhizophora apiculata) (6).
- Emerged macrophytes: Thale Noi (Phragmites communis, Scleris oryzoides, Cyperus grossus and spp., Eleocharis dulcis); Kukut (paspalum sp., Eleocharis dulcis, Scirpus mucronatus, Cyperus tegetiformes and spp., Phragmites connunis) (6).
- Floating macrophtes: Eichhornia crassipes (Q); Thale Noi (Nymphoides indica, Salvinia cucullata); Kukut (Azolla sp., Lemna sp.) (6)
- Submerged macrophytes: Thale Noi (Chara sp., Blyxa echinosperma, Utricularia flexuosa, Ceratophyllum demersum); Kukut (Chara spp., Ceratophyllum demersum, Najas marina) (6).
- Phytoplankton: Kukut (Phormidium spp., Oschillatoria spp., Anabaena spp., Nitzchia spp., Navicula spp., Diatoma spp., Scenedesmus spp., Spirogyra spp.) (6); Thale Luang ; (Pediastrum sp., Spirulina sp., Surirella sp.) (2); Thale Sap (Chaetoceros spp., Nitzchia spp., Rhizosolenia spp., Coscinodiscus spp.) (2)
- Zooplankton: Thale Noi and Kukut (Arcella spp., Difflugia spp., Brachionus spp., Lecane spp., Cladocera, Podoplea) (6).
- Cladocerans tend to be found in the upper part of the lake system, and copepods, urochorodates, nauplius larvae and chaetognatha in the lower part, while fish larvae and malacostraca are more widely distributed (Q).
- Benthos: Thale Noi and Kukut (Polychaeta (Nereis, Dendronereis, Nephtys, Sabella, Meglomma), Mollusca (Melanoides, Idiopoma, Pila, Clea, Corbicula, Modiolus), Crustacea (Palaemon spp., Macrobrachium spp., Gammalus sp.)); Thale Sap (Polychaeta (Nephtys, Nereidae, Orbiniidae, Lambrinereis, Arbella), Crustacea (Upogebia, Cyatura, Apseudes, Gammalus, Penaeus, Metapenaeus)) (2,6). Arthropods are found at high density in the uppere lake system, reaching the maximum level in dry season. Polychaetes increase their density toward the sea, flourishing in dry season. Nematodes are found at high density near the end of each lake, while nemerteans are abundant in the middle lake system (Q).
- Fish(caught by fishing gears): Thale Luang (Tachysurus spp., Mystus spp., Fluta sp., Puntius spp., Ophicephalus spp., Ompox sp.); Thale Sap (Mugil dussunieri and spp., Lates calcarifer, Epinephelus spp., Eleuhteromema sp.,, Gerres sp., Plotosus sp.) (2).
G. SOCIO-ECONOMIC CONDITIONS
G1 LAND USE IN THE CATCHMENT AREA (Q, 7)| Area [km2] | [%] | |
|---|---|---|
| Natural landscape | 1,726 | 24.7 |
| Undisturbed | 1,084 | 15.5 |
| Diturbed | 487 | 7.0 |
| Swamp & Mangrove | 155 | 2.2 |
| Agricultural land | 5,110 | 73.0 |
| Paddy field (rice) | 2,474 | 35.3 |
| Rubber plantation | 2.636 | 37.7 |
| Residential area | 163 | 2.3 |
| Total | 6,999 | 100.0 |
- Main types of woody vegetation (main species): Tropical rain forest; secondary forests at various stages of regeneration; mangrove forest (Rhizophora apiculata, Sonneratia caseolaris, Nipa fruticans); rear mangrove (Melaleuca Leucadendron); brackish swamp forest; freshwater swamp forest (Alstonia spathulata, Eugenia grata); scrub on limestone hills, etc.
- Main types of herbaceous vegetation: Grass swamps (Paspalum scrobiculatum, Phragmites spp., Cyperus, Scirpus, Scleria, etc.).
- Levels of fertilizer application on crop fields: Light
- Trends of change in land use (1974-1982) (1)
| Land use type | 1974 [%] |
1978 [%] | 1982[%] |
|---|---|---|---|
| Forested area | |||
| Undisturbed forest | |||
| -Tropical evergreen forest | 19.7 | 16.2 | 15.3 |
| -Mangrove and swamps | - | - | 2.2 |
| -Scrub | - | - | 0.2 |
| Diturbed forest | |||
| -Old clearing area | 5.9 | - | 2.7 |
| -New deforesed area | - | - | 4.2 |
| -Rubber plantation mixed with forest | 10.8 | - | - |
| Non-forest area | |||
| Rice field | - | 83.8 | - |
| Rubber plantation | 22.6 | - | 35.3 |
| Residential area | 6.0 | - | 2.3 |
| Total | 100.0 | 100.0 | 100.0 |
- G2 INDUSTRIES IN THE CATCHMENT AREA AND THE LAKE
| Kind of industry | Units | No. of workers |
|---|---|---|
| Rice mills | 950 | 1,462 |
| Fishing industries (including ice) | 89 | 2,605 |
| Other food and beverages | 69 | 775 |
| Wood industries | 61 | 769 |
| Furniture | 27 | 793 |
| Printing | 15 | 113 |
| Rubber processing | 30 | 1,913 |
| Chemical products | 14 | 168 |
| Non-metallic minerals including builing and | ||
| constraction materials | 62 | 816 |
| Metal products | 57 | 375 |
| Machinery including repair | 154 | 1,024 |
| Boat building and repair | 6 | 150 |
| Others (Umbrellas, etc.) | 2 | 55 |
| Total | 1,536 | 11,004 |
| Population | Population density [km-2] | Major cities(population) | |
|---|---|---|---|
| Total | 1,199,000 | 171.2 | Hat Yai Songkhla Patthalung |
H. LAKE UTILIZATION (Q)
H1 LAKE UTILIZATION- Source of water, navigation and transportation, sight-seeing and tourism
(477,400 visitors in 1984: ), recreation (swimming, sport-fishing, yachting,
bird-watching) and fisheries (including aquacluture).
| Use rate [m3 sec-1] | |
|---|---|
| Domestic water | 1.6 |
| Irrigation | 14.3 |
| Industrial water | 1.7 |
| Total | 17.6 |
I. DETERIORATION OF LAKE ENVIRONMENTS AND HAZARDS
I1 ENHANCED SILTATION (Q)- Extent of damage: Not serious.
- Rate of sedimentation (entering lake): 500,000-600,000 [metric ton yr-1]
- Present status: Detected but not serious.
- Pesticide residues in Thale Noi area [ppm]
| Pesticide | Recorded maximum level | Location | Material |
|---|---|---|---|
| Gamma-BHC | 0.03 | Ban Thale Noi, Rhlong Mai | Sediment |
| Heptachlor | 0.03 | Thale Noi non-hunting area | Water |
| Dieldrin | 0.10 | Ban Thale Noi, Kholong Mai | Sediment |
| p,p' DDE | 0.03 | Khlong Mai | Sediment |
| p,p' DDD | 0.08 | Kholong Mai | Sediment |
| p,p'DDT | 0.43 | Ban Thale Noi | Water |
| Total DDT | 0.45 | Ban Thale Noi | Water |
| 0.25 | Ban Thale Noi | Sediment | |
| 0.06 | Thale Noi | Catfish |
- Heavy metals in bottom sediments [ppm, dry, wt. base] (1)
| Mimimum | Maximum | |
|---|---|---|
| Cd | 1.9 | 16.1 |
| Cu | 130.6 | 260.2 |
| Fe | 16,000 | 48,00 |
| Mn | 199.8 | 733.5 |
| Pb | 31.5 | 78.5 |
| Zn | 29.0 | 88.6 |
- Draft water quality standards for freshwater sources (1)
- n: Natural condition
- n': Natural condition ± 3 ℃.
- * In water having hardness less than 100 mg l-1 as CaCO3
- ** In water having hardness higher than 100 mg l-1 as Ca CO3.
- *** Water class
- 1: Very clean water, utilized for :
- - drinking and other consumption ; water treatment may be not necessary but disinfection required,
- - conservation of freshwater ecology and natural growth of aqauatic plants.
- 2: Clean water utilized for :
- - drinking and other consumption ; conventional water treatment and disinfection will be needed,
- - recreation.
- 3: Fairly clean water, utilized for :
- - drinking and other consumption ; conventional water treatment and disinfection necessary,
- - agricultural use as irrigation water.
- 4: Moderately clean water, utilized for :
- - drinking and other consumption ; special water treatment is necessary,
- - industrial water supply,
- - other activities.
- 5: Water other than classes 1-4, utilized for water transportation.
| Characteristics [unit] | percentile | Water class | ||||
| 1 | 2 | 3 | 4 | 5 | ||
| Physical | ||||||
| Floating solids | n | n | n | n | ||
| Colour | n | n | n | n | ||
| Taste & odour | n | n | n | n | ||
| Temperature [℃] | - | n | n' | n' | n' | n' |
| pH | - | 6-8 | 6-8 | 6-8 | 6-8 | 6-8 |
| DO | 80> | n | 6 | 4 | 2 | - |
| BOD5 (20℃) | 80< | Less than 2 | 1.5 | 2.0 | 4.0 | - |
| Coliform bacteria | ||||||
| Total coliforms [MPN 100ml-1] | 80> | 5,000 | 20,000 | 20,000 | - | |
| Faecal coliforms [〃] | - | 1,000 | 4,000 | 4,000 | - | |
| NO3 as N [mg l-1] | 100 | 5.0 | ||||
| NH3 as N [〃] | 0.5 | |||||
| Phenols [〃] | 0.005 | |||||
| Cu [〃] | 0.1 | |||||
| Ni [〃] | 0.1 | |||||
| Mn [〃] | 1.0 | |||||
| Zn [〃] | 1.0 | |||||
| Radioactivity {Alpha Beta} [picocuries l-1] | 100 | 0.1 | ||||
| 100 | 1.0 | |||||
| Toxic Substances | 100 | |||||
| As [mg l-1] | 0.01 | |||||
| Cd [〃] | 0.005* | |||||
| 0.05** | ||||||
| Cr [〃] | 0.05 | |||||
| Cu [〃] | 0.005 | |||||
| Pb [〃] | 0.05 | |||||
| Hg [〃] | 0.002 | |||||
| Pesticides [〃] | 0.05 | |||||
- Industrial wastewater quality standards (1)
| (1) pH | Between 5.0 and 9.0 |
| (2) Permanganate value [mg l-1] | 60 |
| (3) Dissolved solids [mg l -1] | |
| 3.1 Disccharge into water - courses | 2,000 or more but not exceeding 5,000, depending upon discharge point |
| 3.2 Discharge into sea or estuaries (salinity not higher than 2,000 mg l-1) | 5,000 higher than dissolved solids in sea or estuary waters |
| (4) Sulfide as H2S [mg l-1] | 1.0 |
| (5) Cyanide as HCN [mg l-1] | 0.2 |
| (6) Heavy metals [mg l-1] | |
| 6.1 Zn | 5.0 |
| 6.2 Cr | 0.5 |
| 6.3 As | 0.25 |
| 6.4 Cu | 1.0 |
| 6.5 Hg | 0.005 |
| 6.6 Cd | 0.03 |
| 6.7 Ba | 1.0 |
| 6.8 Se | 0.02 |
| 6.9 Pb | 0.2 |
| 6.10 Ni | 0.2 |
| 6.11 Mn | 5.0 |
| (7) Tar | Nil |
| (8) Oil and grease [mg l-1] | 5.0 (except for crude oil refinery and lubricant blending plant; less than 15) |
| (9) Formaldehyde [mg l-1] | 1.0 |
| (10) Phenols and cresols [mg l-1] | 1.0 |
| (11) Free chlorine [mg l-1] | 1.0 |
| (12) Insecticides and radioactive substances | Nil |
| (13) Suspended solids [mg l-1] | 30 or more depending on dilution ratio as shown below |
| Dilution ratio 8-150 | Allowable suspended solids 30 |
151-300 | 80 |
301-500 | 150 |
| (14) BOD, 5 day, 20℃ [mg l-1] | 20 or more but not exceeding 60, depending upon dischargeing point, except for industries shown below |
| 14.1 Fish canning | New process as in (14) |
| 14.2 Tapioka starch | Old process 100 |
| 14.3 Noodle factory, using less than 500 kg or rice per day | 100 |
| 14.4 Tanneries | 100 |
| 14.5 Pulb mills | 100 |
| 14.6 Seafood processing | 100 |
| (15) Temperature [℃] | Less than 40 |
| (16) Color and odor | Not objecttionable when mixed in receiving water |
- Inland freshwater quality standards (1)
- For water classes, symbols and foot notes, see P.10.
| Characteristics [unit] | percentile | Water class | ||||
| 1 | 2 | 3 | 4 | 5 | ||
| Temperature [℃] | - | n | n' | n' | n' | n' |
| pH | - | 6-8 | 6-8 | 6-8 | 6-8 | 6-8 |
| DO | 80> | n | 6 | 4 | 2 | - |
| BOD [mg l-1] | 80< | Less than 2 | 1.5 | 2.0 | 4.0 | - |
| Coliform bacteria[MPN 100ml-1] | ||||||
| Total coliforms | 80> | - | 5,000 | 20,000 | - | - |
| Faecal coliforms | - | - | 1,000 | 4,000 | - | - |
| NO3 as N [mg l-1] | 100 | 5.0 | ||||
| NH3 as N [〃] | 0.5 | |||||
| Phenols [〃] | 0.005 | |||||
| Cu [〃] | 0.1 | |||||
| Ni [〃] | 0.1 | |||||
| Mn [〃] | 1.0 | |||||
| Zn [〃] | 1.0 | |||||
| Radioactivity [curie] | 100 | None | ||||
| Toxic Substances[mg l-1] | 100 | |||||
| As | 0.01 | |||||
| Cd | 0.005*(0.05**) | |||||
| Cr | 0.05 | |||||
| Cu | 0.005 | |||||
| Pb | 0.05 | |||||
| Hg | 0.002 | |||||
| Pesticides | 0.05 | |||||
- Nuisance caused by eutrophication: Unusual algal bloom; blooms of Nostoc sp. and Euglena sp. were observed in Thale Luang in the past.
- Nitrogen and phosphorus loadings: Songkhla Basin Planning Study (1) shows forecasted nutrient loads to the lake for different planning scenarios. The natural growth scenario presents the estimates for BOD, N and P loadings [metric ton yr-1] as follows.
| Year | BOD | N | P |
| 1984 | 26,267 | 20,494 | 5,526 |
| 1986 | 27,809 | 21,365 | 5,747 |
I4 ACIDIFICATION
- Extent of damage: None.
J. WASTEWATER TREATMENTS (Q)
J1 GENERATION OF POLLUTANTS IN THE CATCHMENT AREA : (c) Limited pollution with some wastewater treatment.J2 APPROXIMATE PERCENTAGE DISTRIBUTION OF POLLUTANT LOADS : Nonpoint sources 90% , point sources 10%.
J3 SANITARY FACILITIES AND SEWERGE
- Percentage of municipal population provided with adequate sanitary facilities (on-site treatment systems): 100%.
- Percentage of rural population provided with adequate sanitary facilities : 0%
- Municipal wastewater treatment systems : Septic tank and cesspool.
- Industrial wastewater treatment systems : Biological treatment requiered by law for organic pollutants in all industrial plants.
K. IMPROVMENT WORKS IN THE LAKE
K3 OTHERS (Q)
Construction of new fishing ports with wastewater treatment facilities ; plants for sewerage and seeage treatment systems.L. DEVELOPMENT PLANTS
Deep sea-port under construction ; Koh Yor Bridge completed ; salinity barrier under study (Q).M. LEGISLATIVE AND INSTITUTIONAL MEASURES FOR UPGRADING LAKE ENVIRONMENTS (Q)
M1 NATIONAL AND LOCAL LAWS CONCERNED (Q)- Names of the laws (the year of legislation)
- Factory Act (1969)
- National Environmental Quality Act (1975)
- Public Health Act
- Responsible authorities
- Ministry of Industry
- National Environment Board
- Ministry of Health ; local authorities and municipalities.
- Main items of control
- Industrial effuent standards
- Establishment of standards and environment impact assessment
- Sanitation, solid waste management, food sanitation and toxic substand control
M2 INSTlTUTlONAL MEASURES
None solely responsihle for the lake ; the following agencies take collective
resposibilities.
- Naitonal Environment Board established in 1975 ; the monitoring of the lake environment has been kept since 1978 in collaboration with Songkhla University.
- Department of Industrial Works, Ministry of Industry ; occasionally undertakes monitoring.
N. SOURCES OF DATA
(Q) Questionnaire filled by the Dr. Surin Setamanit, Institute of Environmental Research, Chulalongkorn University, Bangkok, Thailand.- National Economic and Social Development Board/National Environment Board (1985) Songkhla Lake Basin Planning Study. Bangkok (with data citations from Meteorological Department, Applied Science and Technology Research Institute, Provincial Industry Offices, Songkhla and Pattahalung Municipalities, Prince of Songkhla University, National Environment Board and LANDSAT).
- Information from the National Institute of Coastal Aquaculture.
- Thai University Research Association (1981) Social, Economic and Demographic Studies for Better Environmental Management of the Songkhla Lake Basin. 624 pp. Office of the National Environment Board of Thailand, Bangkok.
- Dobias, R.J. (1982) The Shell Guide to the National Parks of Thailand. 37 pp. The Shell Company of Thailand, Bangkok.
- Information from National Environment Board of Thailand.
- Ecological Research Division, Thailand Institute of Scientific and Technological Research (1981) Ecological Studies for Conservation of Shore Birds in Songkhla Lake. Vol.1. 559 pp. Office of the National Environment Board of Thailand, Bangkok.
- Information from Ecological Research Division, Thailand Institute of Scientific and Technological Research.
- Information from Mr. Narong Na, Chiang Mai, based on Songkhla Lake Research Report, 1978-1979, Prince of Songkhla University.
